


Introduction
Tuberculosis is one of the major public health problems globally. More than 1.7 billion people, that is, about 25% of the world population, are estimated to be infected with Mycobacterium tuberculosis (M. tuberculosis) [1]. According to the World Health Organization, around 10 million individuals fall ill with tuberculosis each year and 1.6 million die [2]. Successful treatment of pulmonary tuberculosis largely depends on making an accurate diagnosis and starting standardized anti-tuberculosis treatment. In clinical practice, tuberculosis is treated based on patient symptoms, chest radiography (chest X-ray) abnormalities and sputum bacteriological examination. Sputum smear test can find acid-fast bacilli in almost 50-60% of pulmonary tuberculosis [3]. However, in some cases of current active pulmonary tuberculosis, neither bacteriological examination nor serial chest X-ray unequivocally demonstrates the activity of disease. Radiographic findings suggested that the sputum-negative pulmonary tuberculosis without clinical or microbial evidence is one of the most dangerous factors for the development of active tuberculosis [4].
Although smear-negative tuberculosis patients have lower risk of spreading tuberculosis than the smear-positive patients, smear-negative tuberculosis patients are still able to transmit tuberculosis. The relative transmission rate of smear-negative tuberculosis patients in comparison with smear-positive tuberculosis patients has been ascertained at 22% base on a molecular epidemiologic method [5]. Nevertheless, nearly 50% patients with tuberculosis are sputum smear-negative cases, as a result of which the total contribution of smear-negative tuberculosis patients to the transmission of tuberculosis is notable. Polymerase chain response (PCR) can quickly analyze sputum samples, while its sensitivity is low [6]. As a result, clinicians often hesitate in starting anti-tuberculosis treatment for fear of the potential side-effects of anti-tuberculosis drugs. However, some patients received a standard 6-month anti-tuberculosis treatment with- smear and culture turned negative, while the lungs of those patients were remained lesions. About 5% of patients with drug-sensitive pulmonary tuberculosis will experience relapse within six months of completing treatment with a standard 6-month anti-tuberculosis treatment [7, 8]. Tuberculosis relapse is caused by persisting slow growing, metabolically active but non-culturable bacilli that are less sensitive to chemotherapy agents [9, 10]. In cases of prolonged therapy, treatment outcome is difficult to be classified as a success as negative sputum smear is only an indicator for contagiousness but not for disease activity [11].
Positron emission tomography with computed tomography (PET/CT) using fluorine-18-fluorodeoxyglucose (FDG) is a useful imaging modality for guiding management of oncology patients [12]. FDG, an analog of glucose, accumulates at the bacterial infection sites, such as tuberculous granuloma, due to the high consumption of glucose by activated macrophages, the most abundant inflammatory cell in the granuloma [13]. Accumulation of FDG in tuberculosis lesions has been shown to correlate with the number of bacilli and a higher risk of recurrence of hypermetabolic lesions [14, 15]. Although high uptake in pulmonary tuberculosis lesions suggests active disease, it may also indicate a host immune system response that will eventually prevail. However, the immune response is more active in hyper metabolized lesions on PET. When immunosuppression occurs in the host, if the lesion contains residual M. tuberculosis, it is more likely to evolve into recurrent tuberculosis [16]. However, FDG-PET/CT is too expensive to be used as an indicator of complete inactivity of tuberculosis lesions. Therefore, it is urgently needed to uncover biological indicators for accurate diagnosis of complete inactivation of tuberculosis lesions, which may provide proof for a complete cure of tuberculosis in the future.
Long non-coding RNAs (lncRNAs) are molecules that could regulate the expression of protein-coding genes to participate in various cellular events. Dysregulations of lncRNAs have been found associated with many cancers and infectious diseases [17]. In this present study, lung tissue samples with low metabolic activity and high metabolic activity according to FDG-PET/CT were collected from patients with sputum-negative pulmonary tuberculosis. The potential lncRNA biomarkers that can be used as indicators for a complete cure of tuberculosis were screened out by sequencing and bioinformatics methods.
Results
Differentially expressed mRNAs and differentially expressed lncRNAs
386 mRNAs (141 down-regulated and 245 up-regulated mRNAs) were differentially expressed in PET-high samples when compared to PET-low samples (Figure 1A, 1B). Hierarchical clustering of these differentially expressed mRNAs indicated that PET-high samples were indeed distinct from PET-low samples (Figure 1C). Moreover, 44 differentially expressed lncRNAs (24 down-regulated and 20 up-regulated lncRNAs) were identified between PET-high and PET-low samples (Figure 1D, 1E). Hierarchical clustering of differentially expressed lncRNAs again revealed that PET-high and PET-low samples were clustered in two distinct groups (Figure 1F).
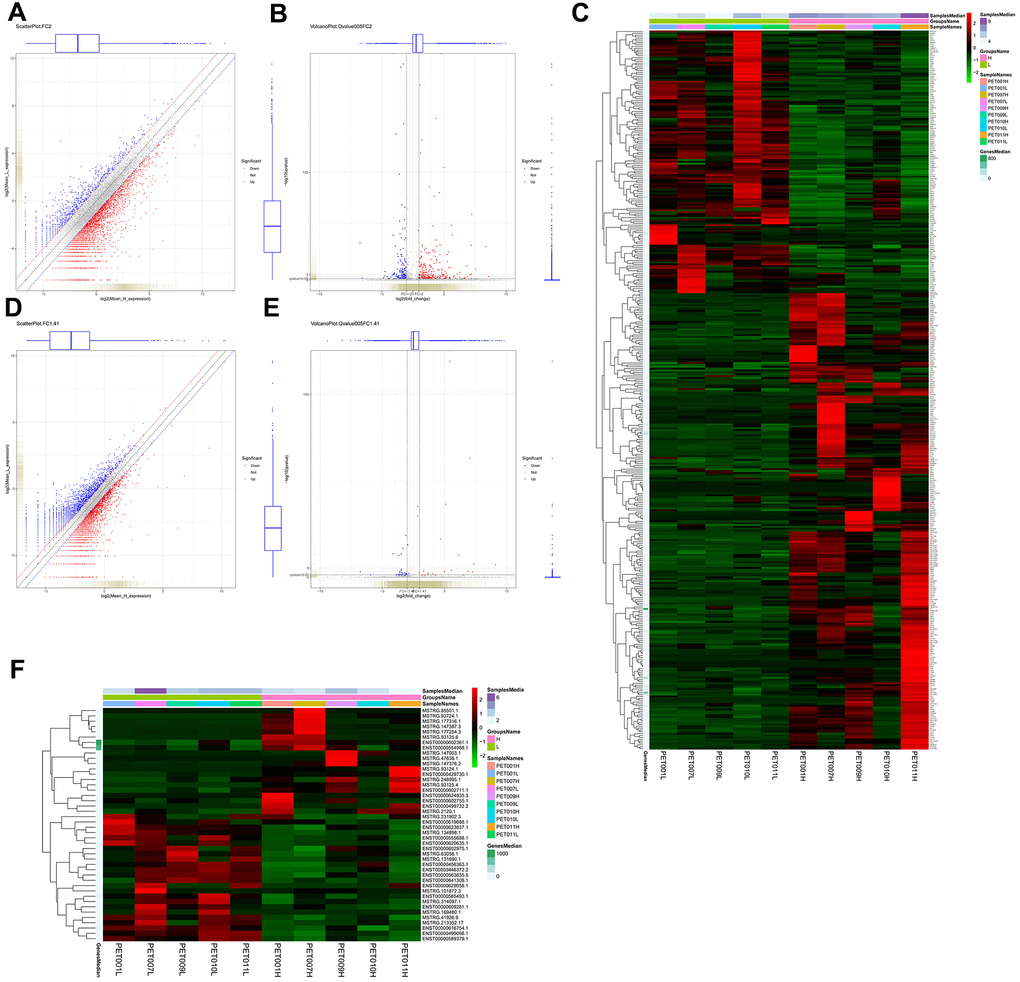
Figure 1. Identification and hierarchical clustering analysis of differentially expressed mRNAs and lncRNAs between lung tissue samples with high metabolic activity (PET-high) and lung tissue samples with low metabolic activity (PET-low). (A) scatter plot of mRNAs with |log2 fold change (FC) | > 1; (B) volcano plot of mRNAs with |log2FC | > 1 (FC > 2) and q value < 0.05; (C) Hierarchical clustering heatmap of differentially expressed mRNAs; (D) scatter plot of lncRNAs with |log2 FC | > 0.5 (FC > 1.41); (E) volcano plot of lncRNAs with |log2 FC | > 0.5 and q value < 0.05; (F) hierarchical clustering heatmap of differentially expressed lncRNAs.
GO functional enrichment analysis indicated that differentially expressed mRNAs were significantly related to the fibrillar collagen (enrich factor = 23.22), platelet-derived growth factor binding (enrich factor = 22.87), and protein heterotrimerization (enrich factor = 20.13) (Figure 2A). Pathway enrichment analysis suggested these differentially expressed mRNAs were involved in the pathways of ribosome (enrich factor = 6.38), systemic lupus erythematosus (enrich factor = 5.87), and staphylococcus aureus infection (enrich factor = 4.99) (Figure 2B).
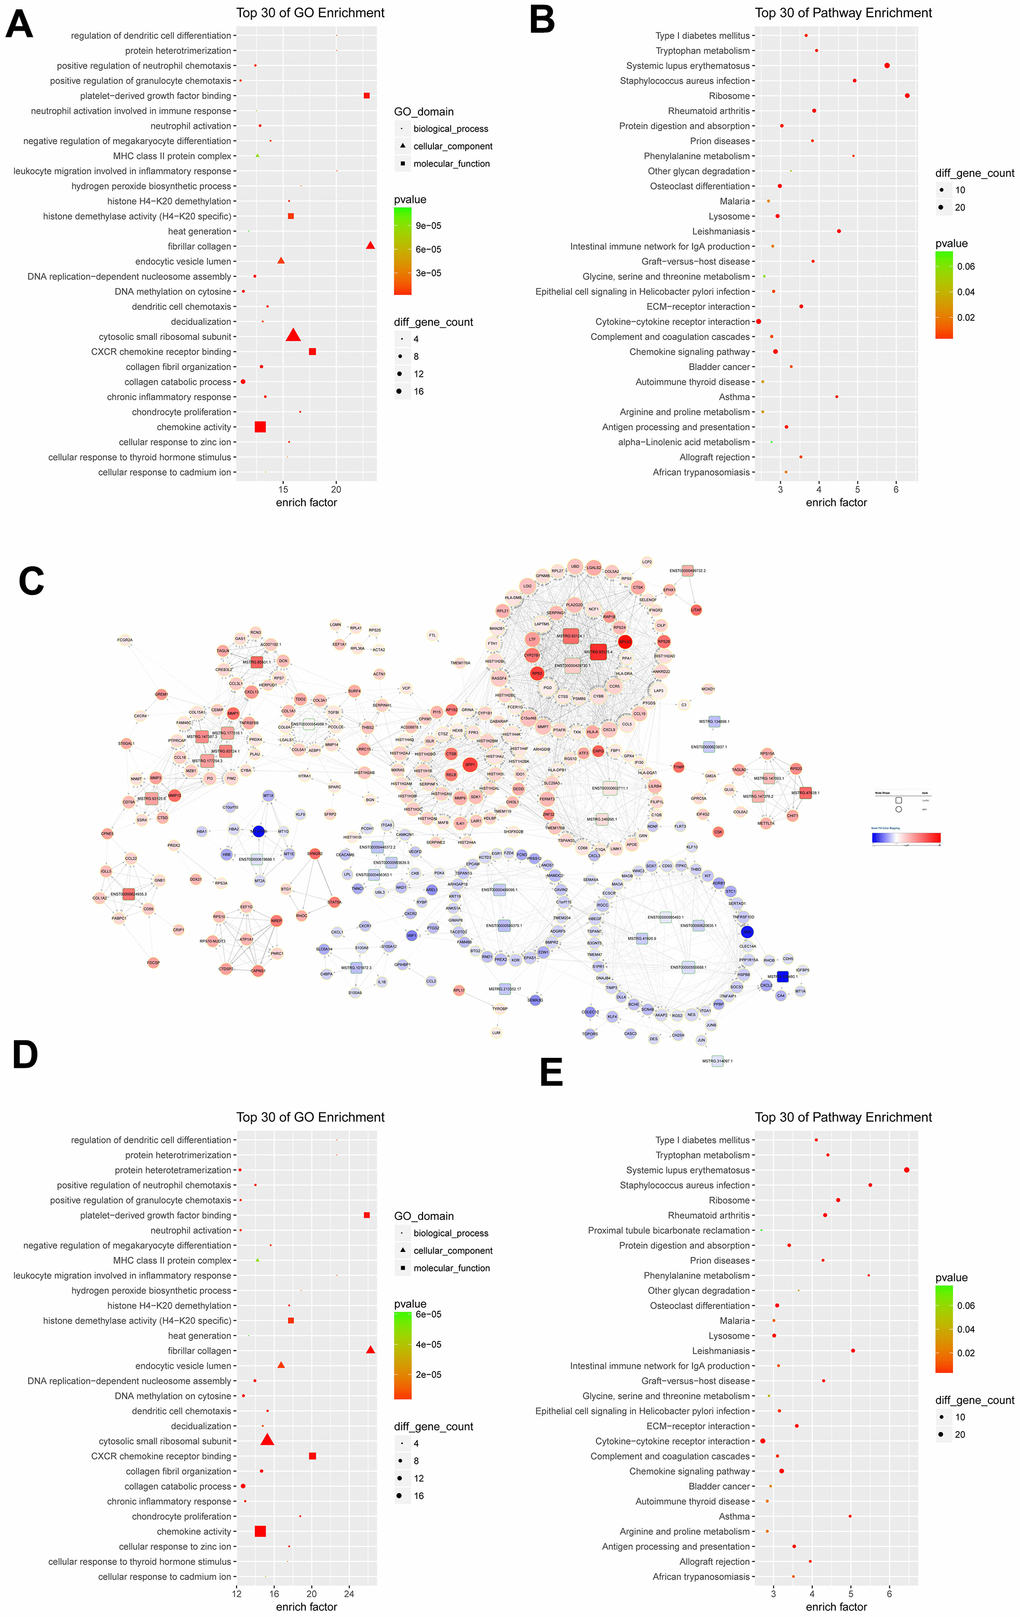
Figure 2. Functional analysis of differentially expressed mRNAs and lncRNA-mRNA co-expression network. (A) the top 30 Gene Ontology (GO) terms in biological process (BP), cellular component (CC), and molecular function (MF) categories for differentially expressed mRNAs; (B) the top 30 KEGG pathways enriched for differentially expressed mRNAs; (C) lncRNA-mRNA co-expression network constructed by co-expressed lncRNA-mRNA correlations; (D) the top 30 significant GO terms for differentially expressed mRNAs in lncRNA-mRNA co-expression network; (E) the top 30 significant KEGG pathways enriched for differentially expressed mRNAs in lncRNA-mRNA co-expression network; (C) lncRNA-mRNA co-expression network constructed by co-expressed lncRNA-mRNA correlations.
LncRNA-mRNA co-expression network
The correlations between differentially expressed lncRNAs and differentially expressed mRNAs were revealed to construct the lncRNA-mRNA co-expression network. The lncRNA-mRNA co-expression network was consisted of 1956 positive correlations and 6 negative correlations involving 33 differentially expressed lncRNAs and 340 differentially expressed mRNAs. Five up-regulated lncRNAs, including MSTRG.93125.4 (40 degrees), ENST00000429730.1 (35 degrees), MSTRG.93124.1 (31 degrees), ENST00000602711.1 (21 degrees), and MSTRG.177254.3 (17 degrees) correlated with more than 15 targeted mRNAs (Figure 2C). Regarding mRNAs, eight up-regulated mRNAs had a degree number larger than 35. They were C15orf48 (41 degrees), RASSF4 (38 degrees), CCL5 (37 degrees), CYBB (37 degrees), PGD (37 degrees), LAP3 (36 degrees), LAPTM5 (36 degrees), and LGI2 (36 degrees) (Figure 2C).
The differentially expressed mRNAs in lncRNA-mRNA co-expression network were enriched with the fibrillar collagen, platelet-derived growth factor binding, protein heterotrimerization, regulation of dendritic cell differentiation, and leukocyte migration involved in inflammatory response (Figure 2D). Pathway enrichment analysis for differentially expressed mRNAs in lncRNA-mRNA co-expression network indicated that the top ranked pathways were involved systemic lupus erythematosus, Staphylococcus aureus infection, phenylalanine metabolism, Leishmaniasis, and asthma (Figure 2E).
Target gene prediction of differentially expressed lncRNAs and functional analysis
One cis-target gene and 440 trans-target genes were selected from the lncRNAs differentially expressed in PET-high lung tissues (See Materials and Methods). The subset of these genes that correlated significantly with the lncRNAs (|R| > 0.85 and FDR < 0.0005) were predicted as target genes and chosen for further functional and pathway enrichment analysis. All of these lncRNA target genes were differentially expressed (Supplementary Table 4). These predicted target genes were mainly involved in the biological processes of chemokine-mediated signaling pathway, collagen catabolic process, neutrophil chemotaxis, neutrophil migration, and collagen metabolic process (Figure 3A). KEGG pathway enrichment analysis indicated the predicted target gene subset were involved in the pathways of systemic lupus erythematosus, rheumatoid arthritis, Staphylococcus aureus infection, chemokine signaling pathway, and cytokine-cytokine receptor interaction (Figure 3B).
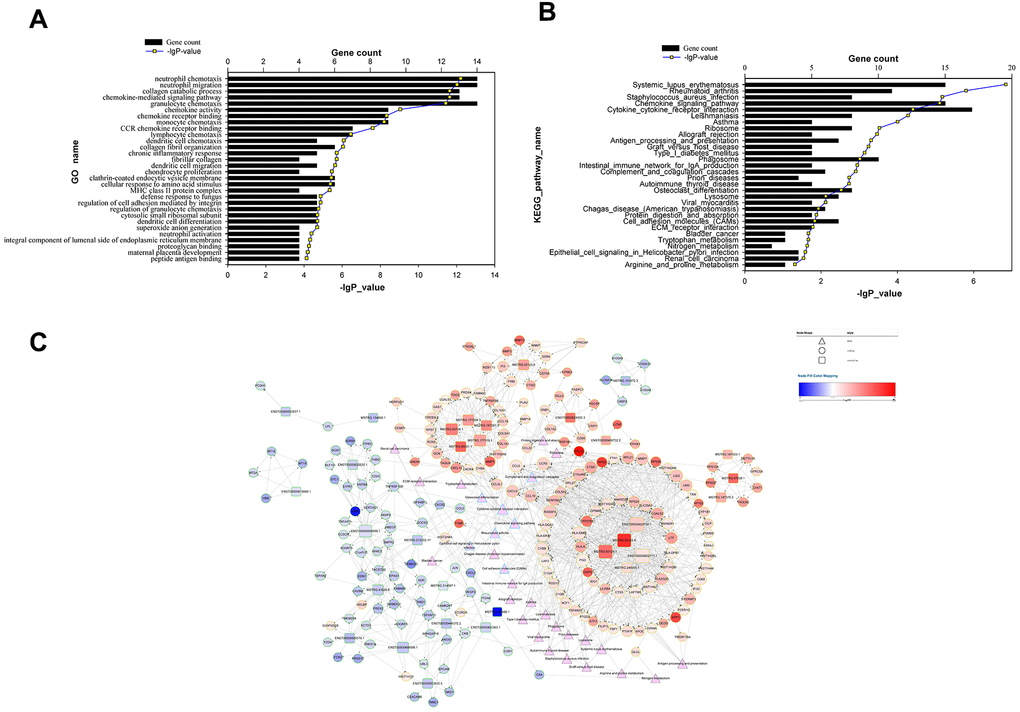
Figure 3. Functional analysis of target genes predicted for differentially expressed lncRNAs and the lncRNA-target-pathway network. (A) significant GO terms for differentially expressed target genes predicted for differentially expressed lncRNAs; (B) significant KEGG pathways enriched for differentially expressed target genes predicted for differentially expressed lncRNAs; (C) lncRNA-target-pathway network constructed by regulatory correlations of differentially expressed lncRNAs with predicted cis- or trans-target genes, as well as the top 30 KEGG pathways.
We then visualized the top 30 KEGG pathways, the predicted target genes, as well as the differentially expressed lncRNAs together in a lncRNA-target-pathway network map (Figure 3C). 5 lncRNAs (ENST00000429730.1, MSTRG.93125.4, MSTRG.93124.1, ENST00000602711.1, and ENST00000555688.1) and 9 target genes (HLA-DMB, RASSF4, CCL5, CXCL9, C15orf48, CCR5, CYBB, LGI2, and PGD) had a degree of number more than 25. These extensively connected genes were involved in pathways that were enriched with connections: cytokine-cytokine receptor interaction (involving CCL5, CXCL9 and CCR5), chemokine signaling pathway (involving CCL5, CXCL9 and CCR5), and cell adhesion molecules (involving HLA-DMB and HLA-DPB1). RASSF4 regulates PIP2 production, a critical step for phagocytosis and phagosome formation. C15orf48 encodes a novel subunit of the mitochondrial electron transport chain (32045714). Leucine-rich repeat glioma inactivated gene member encoded by LGI2 plays an important role in remodeling of synapses between nerve cells (23713523). PGD encodes 6-phosphogluconate dehydrogenase in the pentose phosphate pathway, which converts 6-phosphogluconate into ribulose 5-P, a metabolite product that supports inflammatory macrophage responses (25904920). Other highly-connected pathways in the lncRNA-target-pathway network map included complement and coagulation cascades (involving C1QB and C1QA), lysosome (involving CD68, CTSD, and CTSK), phagosome (involving CYBB and CYBA). Four highly-connected target genes CCL5, CXCL9, CYBB, and HLA-DMB were predicted target genes of two highly-connected lncRNAs ENST00000429730.1 and MSTRG.93124.1 with 54 and 53 predicted target genes, respectively.
Expression validation and prediction efficiencies of lncRNA indicators
Expression levels of 7 mRNAs (C1QB, CD68, CCL5, CCL19, MMP7, HLA-DMB, and CYBB) and 4 lncRNAs (ENST00000429730.1, MSTRG.93125.4, MSTRG.93124.1, and ENST00000602711.1) that had relatively larger number of degree in lncRNA-target-pathway network were measured in the lung PET-high and PET-low tissue samples collected from 11 patients. The expression levels of C1QB, CD68, CCL5, CCL19, MMP7, HLA-DMB, and CYBB were validated to be significantly up-regulated in lung PET-high tissue samples (Figure 4A). Obviously higher expressions of two lncRNAs ENST00000429730.1 and MSTRG.93125.4 were found in lung PET-high tissue samples (Figure 4A). ROC curve analysis of ENST00000429730.1 showed that the AUC was 0.750 with a sensitivity of 58.33% and a specificity of 100.00% (p = 0.024) (Figure 4B), and the AUC of MSTRG.93125.4 was 0.813 with a sensitivity of 58.33% and a specificity of 100.00% (p = 0.001) (Figure 4C).
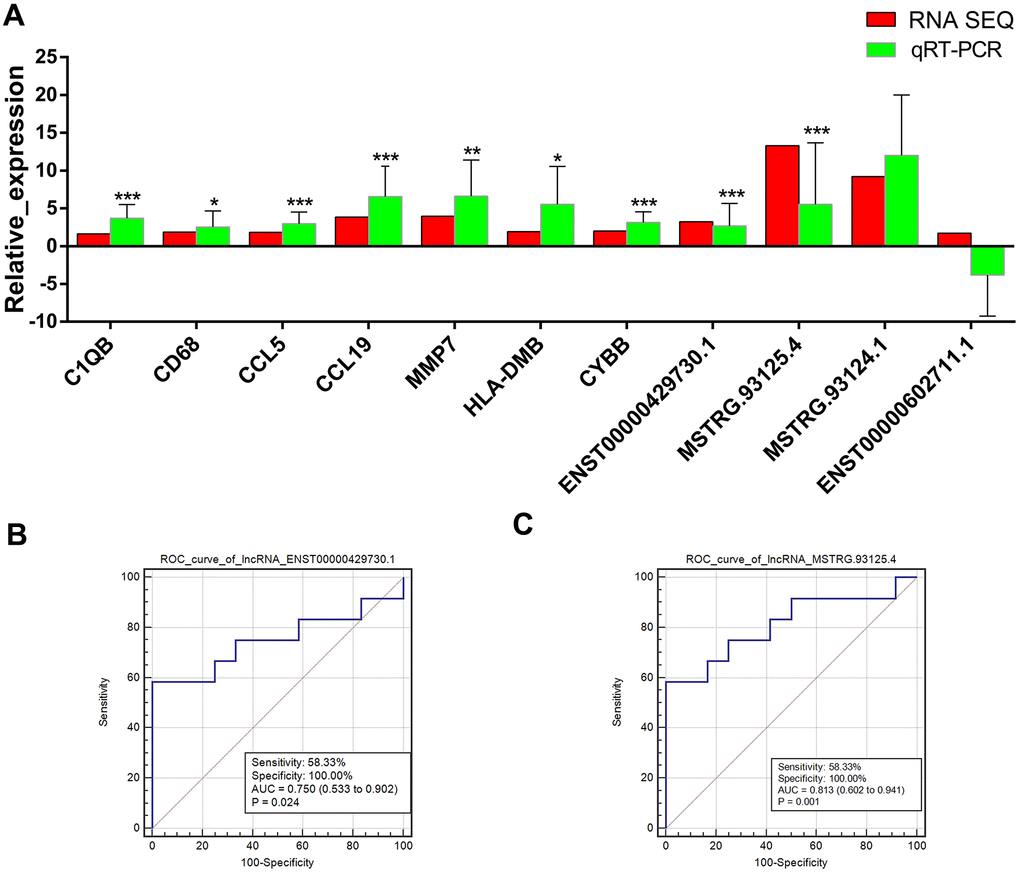
Figure 4. Validation of lncRNAs and mRNAs by quantitative real-time polymerase chain reaction (qRT-PCR) and prediction efficiencies evaluated by receiver operating characteristic (ROC) curve analysis. (A) expressions changes of lncRNAs and mRNAs that had relatively larger number of degree in lncRNA-target-pathway network detected by qRT-PCR. The red bars indicate the expression changes in PET-high samples comparing with PET-low samples according to the RNA-sequencing data of PET-high (n = 5) and PET-low (n = 5) samples. The green bars indicate the expression changes in PET-high samples (n = 11) comparing with PET-low samples (n = 11) according to the qRT-PCR experiment results. The horizontal axis means the names of lncRNAs or mRNAs, and the vertical axis means the relative expression (log2 FC). *: p < 0.05, **: p < 0.01, ***: p < 0.001 comparing with PET-low samples based on qRT-PCR experiment results. (B) ROC curve of ENST00000429730.1. (C) ROC curve of MSTRG.93125.4.
Bioinformatics analysis of ENST00000429730.1 and MSTRG.93125.4
Genomic location of ENST00000429730.1 was predicted to be on chromosome 2q33.3 and assumed to be unable to encode genes (Figure 5A). The optimal secondary structure for ENST00000429730.1 had several hairpin loops with a minimum free energy (MFE) of -110.50 kcal/mol (Figure 5B). There were strong interactions of ENST00000429730.1 with proteins of ELAV1, TRA2B, PTBP1, SRSF9, and SRS10. The interaction between ENST00000429730.1 and ELAV1 has an interaction propensity of 68, and with the discriminative power of 97% (Figure 5C).
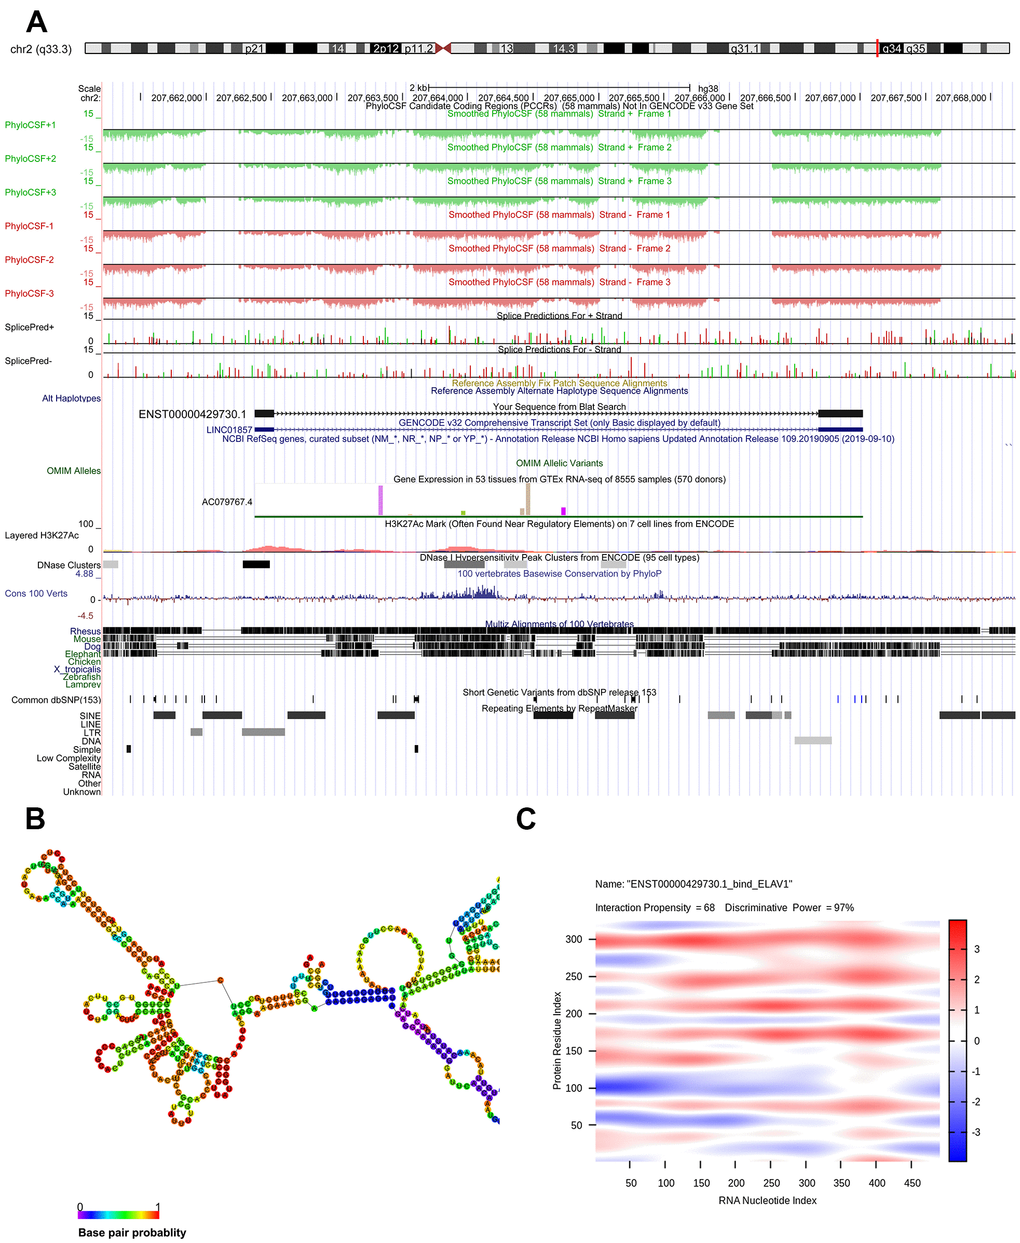
Figure 5. Bioinformatics analysis of ENST00000429730.1. (A) chromosome location of ENST00000429730.1; (B) optimal secondary structure for ENST00000429730.1; (C) interaction between ENST00000429730.1 and ELAV1.
Genomic location of MSTRG.93125.4 was predicted to be on chromosome 14KI270846v1_alt and unable to encode genes (Figure 6A). The optimal secondary structure for MSTRG.93125.4 had the MFE of -359.20 kcal/mol (Figure 6B). For MSTRG.93125.4, strong interactions were found with proteins of SFPQ, PCBP1, LN28B, SRSF2, and PCBP2. The interaction between MSTRG.93125.4 and SFPQ has an interaction propensity of 180, with the discriminative power of 100% (Figure 6C). Prediction analysis of potential transcriptional factors showed that MSTRG.93125.4 can combine with 67 transcriptional factors (such as Kid3, AML1, myogenin, MyoD, and AP-4), and ENST00000429730.1 can combine with 82 transcriptional factors (such as AML1, TBX5, E2F, IPF1, and E2F-1) (Figure 7).
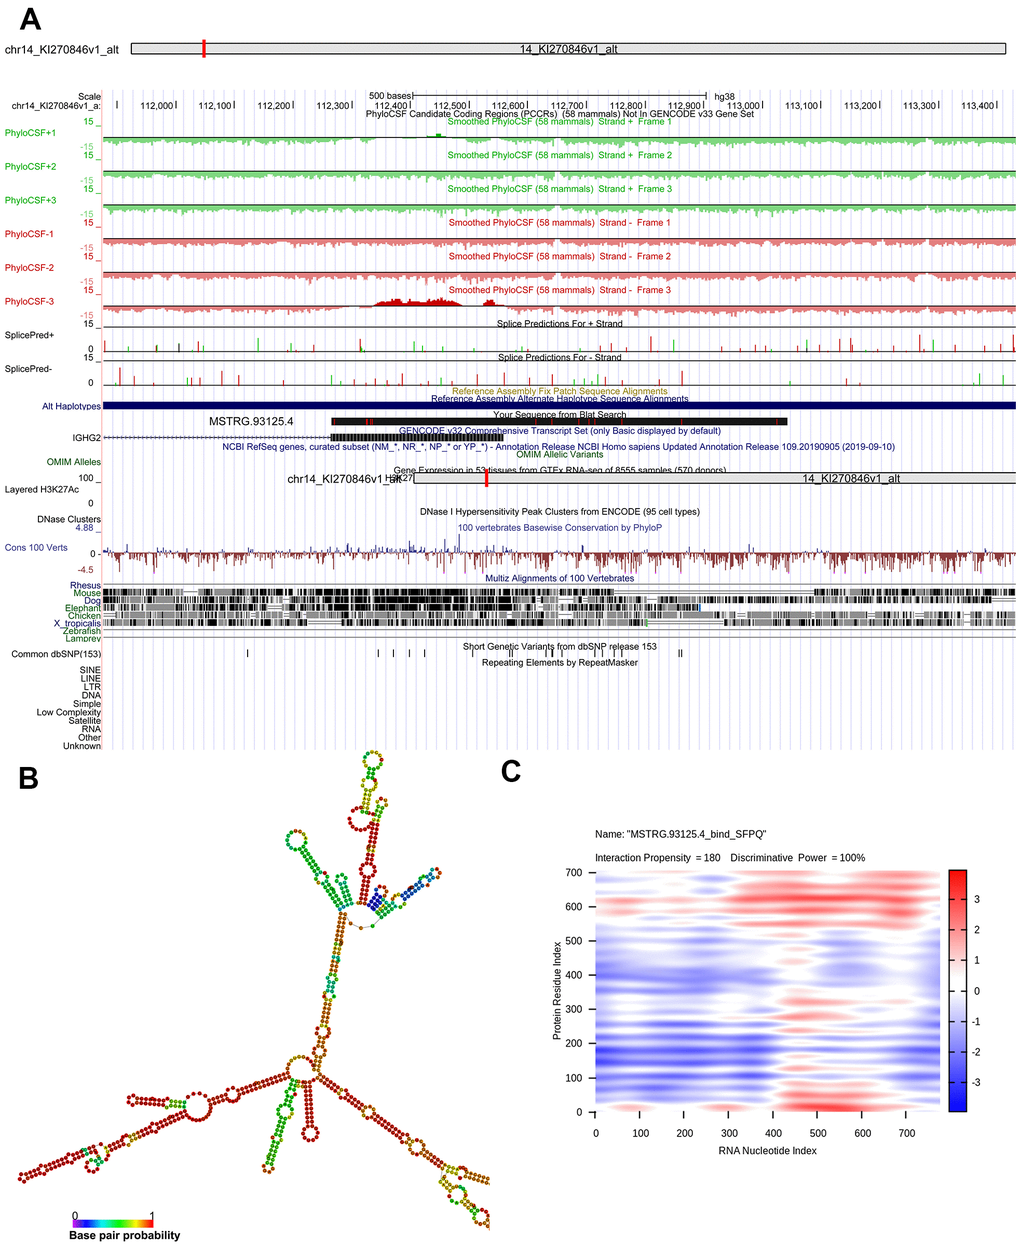
Figure 6. Bioinformatics analysis of MSTRG.93125.4. (A) chromosome location of MSTRG.93125.4; (B) optimal secondary structure for MSTRG.93125.4; (C) interaction between MSTRG.93125.4 and SFPQ.
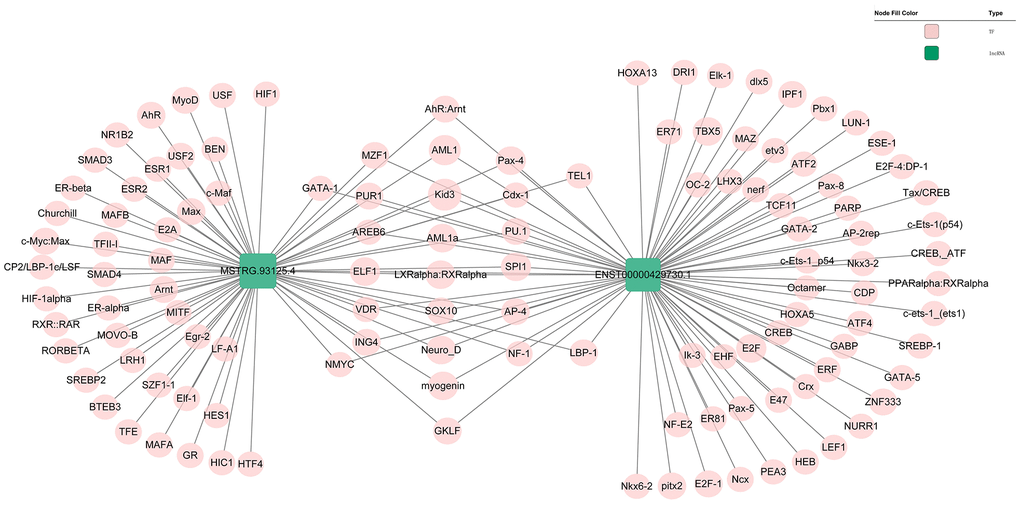
Figure 7. Prediction of the potential transcriptional factors of the ENST00000429730.1 and MSTRG.93125.4.
Discussion
Tuberculosis, an infectious disease caused by M. tuberculosis, remains a major cause of ill health burden and is one of the leading causes of death globally [2]. Although detection techniques and therapeutic approaches for tuberculosis have achieved significant developments, there is still no suitable indicators for complete cure of tuberculosis in patients with sputum-negative tuberculosis. In our study, 386 differentially expressed mRNAs and 44 differentially expressed lncRNAs were identified in lung PET-high tissue samples according to the RNA-sequencing profiles. The differentially expressed mRNAs in lncRNA-mRNA co-expression network were notably associated with the fibrillar collagen, platelet-derived growth factor binding, protein heterotrimerization, regulation of dendritic cell differentiation, and leukocyte migration involved in inflammatory response.
Tuberculosis is characterized by chronic inflammation and tissue fibrosis. Fibrillar collagens, determinants of lung tensile strength and highly resistant to enzymatic degradation, play important roles in lung injury and repair. Only collagenolytic matrix metalloproteinases (MMPs) have unique abilities to cleave these helical collagens at neutral pH [18, 19]. It has been reported that M. tuberculosis infection increased MMP-1 expression, resulting in significantly greater collagen breakdown and alveolar destruction in lung granulomas [20]. Interferon-γ released from lymphocytes stimulated by the M. tuberculosis antigen resulted in increased platelet-derived growth factor-B (PDGF-B) in alveolar macrophages, suggesting a link between the delayed type hypersensitivity response and the first stages of a fibrotic reaction in the lungs of patients with untreated pulmonary tuberculosis [21, 22]. Thus, differentially expressed lncRNAs may co-expressed with differentially expressed mRNAs to influence the functions of fibrillar collagen, platelet-derived growth factor binding, as well as leukocyte migration involved in inflammatory response in lung PET-high tissue samples.
Afterwards, one cis-target gene and 440 trans-target genes were predicted for differentially expressed lncRNAs. The expression levels of C1QB, CD68, CCL5, CCL19, MMP7, HLA-DMB, and CYBB were validated to be significantly elevated in lung PET-high tissue samples. and Obviously higher expressions of two lncRNAs ENST00000429730.1 and MSTRG.93125.4 were found in lung PET-high tissue samples. What’s more, CCL5, CXCL9, CYBB, and HLA-DMB were the predicated trans-target genes ENST00000429730.1 and MSTRG.93125.4. CCL5 and CCL19 were involved in the cytokine-cytokine receptor interaction and chemokine signaling pathway. Cytokines and chemokines play important roles in the initiation, sequential recruitment and activation of cells into M. tuberculosis infected lungs [23]. In the mouse model of M. tuberculosis infection, three CCR5 ligands CCL3, CCL4, and CCL5 are overexpressed in the lungs, among which CCL5 being induced to the highest level. When CCL5 gene deficient mice were infected with M. tuberculosis, transient early impairment in granuloma formation and delayed T cell recruitment were observed [24, 25]. CCR7 ligation by CCL19 and CCL21 is vital for the positioning of T cells and dendritic cells of secondary lymphoid tissues, and CCR7-deficient mice, which are deficient in CCL19 and CCL21 signaling, are fully capable to control pulmonary tuberculosis [26, 27]. Meanwhile, differentially expressed target genes were significant enriched in phagosome (such as CYBB) and cell adhesion molecules (such as HLA-DMB), which were used to construct the lncRNA-target-pathway network. Congenital X-linked mutations in CYBB, which encoding the gp91 (phox) subunit of the phagocyte NADPH oxidase, could lead to recurrent tuberculosis in patients with defects preferentially manifest in macrophages, suggesting CYBB is associated with mendelian susceptibility to mycobacterial disease and the respiratory burst in human macrophages is a crucial mechanism for protective immunity to tuberculous mycobacteria [28, 29]. Therefore, differentially expressed lncRNAs may influence the cytokine-cytokine receptor interaction, chemokine signaling pathway, phagosome, and cell adhesion molecules by regulating their target genes in lung PET-high tissue samples.
Prediction efficiency analysis showed that the AUC of ENST00000429730.1 and MSTRG.93125.4 was 0.750 and 0.813 respectively. These two lncRNAs might be the potential biomarkers for active tuberculosis. Strong interactions of ENST00000429730.1 with ELAV1, and MSTRG.93125.4 with SFPQ were revealed. Solute carrier family 11 member 1 (SLC11A1) has been reported to be involved in susceptibility to human immunodeficiency virus and tuberculosis infection, and RNA binding protein HuR (ELAV1) is a key mediator of stabilization of SLC11A1 mRNA and SLC11A1 protein expression [30, 31]. Splicing factor proline- and glutamine-rich (SFPQ) protein, also known as polypyrimidine tract binding protein-associated splicing factor (PSF), is a multifunctional nuclear protein that participates in cellular activities, such as RNA transport, DNA repair, and apoptosis [32]. Secreted M. tuberculosis Rv3654c protein participate in the suppression of macrophage apoptosis by recognizing and interacting with PSF to cleave it, diminishing the availability of caspase-8, and inactivation of PSF also significantly decreased the level of caspase-8 in macrophages [33, 34]. Taken together, interactions of ENST00000429730.1 with ELAV1, and MSTRG.93125.4 with SFPQ might influence the metabolic activity in tuberculosis lesions. However, the specific regulatory mechanisms related to interactions of ENST00000429730.1 with ELAV1, and MSTRG.93125.4 with SFPQ in the metabolic activity of tuberculosis lesions need to be explored by further studies.
In conclusion, analysis of RNA-sequencing profiles identified 386 differentially expressed mRNAs and 44 differentially expressed lncRNAs in the PET-high lung samples. Two lncRNAs ENST00000429730.1 and MSTRG.93125.4 might be considered as potential biomarkers of metabolic activity in tuberculosis lesions for patients with sputum-negative tuberculosis. Meanwhile, ENST00000429730.1 and MSTRG.93125.4 may influence the cytokine-cytokine receptor interaction, chemokine signaling pathway, phagosome, and cell adhesion molecules by regulating their trans-target genes, such as CCL5, CXCL9, CYBB, and HLA-DMB. Moreover, interactions of ENST00000429730.1 with ELAV1, and MSTRG.93125.4 with SFPQ might associated with metabolic activity in tuberculosis lesions.
Materials and Methods
Patients and samples
Five patients who diagnosed as sputum-negative pulmonary tuberculosis in our hospital from June 06 to December 2018 were enrolled for RNA-sequencing analysis. There were one male and four females, aged 20-38 years, with an average age of 31.2 ± 7.4 years (Supplementary Table 1). Lung tissue samples with high metabolic activity (PET-high) and low metabolic activity (PET-low) demonstrated by (FDG-PET/CT) were collected from these five participants for the subsequent sequencing (Figure 8). Moreover, lung PET-high and PET-low tissue samples collected from 11 enrolled subjects were used for experimental validation of expression changes by quantitative real-time PCR (qRT-PCR). There were 7 male and 4 females, aged 20-57 years, with an average age of 38.3 ± 11.3 years (Supplementary Table 2).
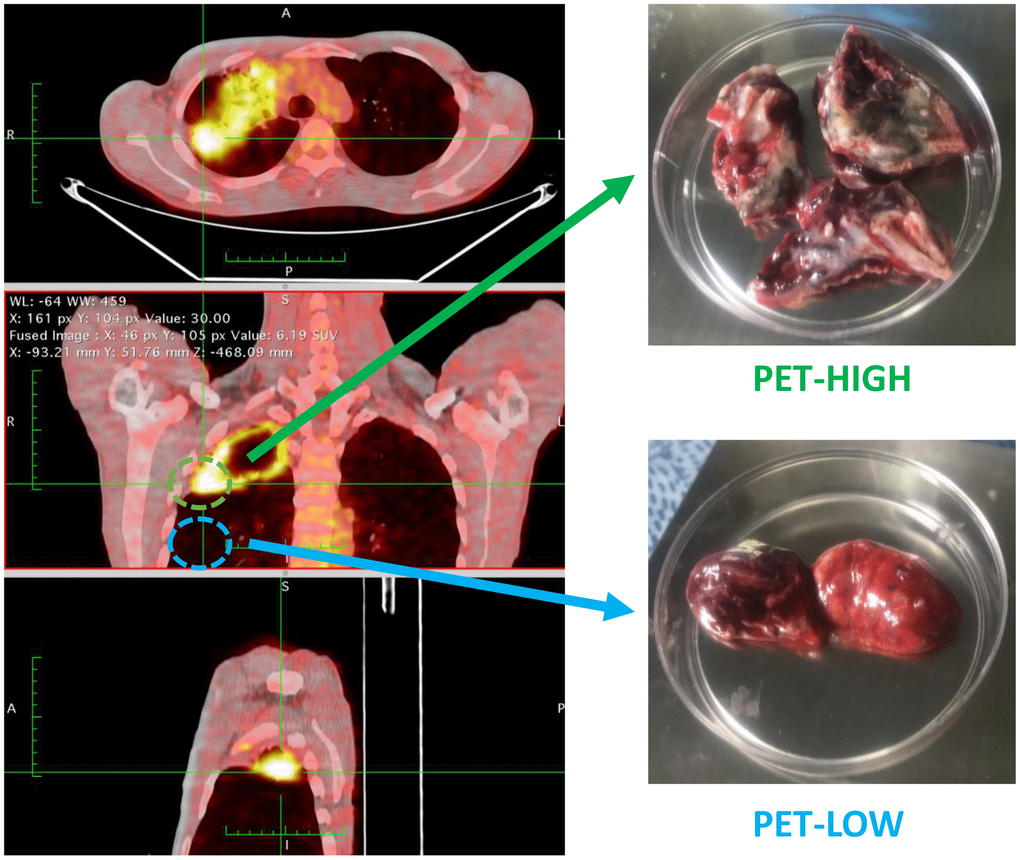
Figure 8. Lung tissue samples with high metabolic activity (PET-high) and low metabolic activity (PET-low) demonstrated by fluorine-18-fluorodeoxyglucose positron emission tomography combined with computed tomography (FDG-PET/CT) were collected for RNA-sequencing.
All the subjects were confirmed as pulmonary tuberculosis by pathological examination with sputum smear and culture negative preoperatively, and accompanied by tuberculous pleurisy or other extrapulmonary tuberculosis. The included participants were demonstrated to have residual metabolic activity by FDG-PET/CT, and in non-human immunodeficiency virus (non-HIV) infection status. Patients were excluded when they met one of the following criteria: sputum positive for mycobacterium tuberculosis complex by Xpert or culture (bacteriologically confirmed tuberculosis disease) before surgery; in the presence of tuberculosis symptoms; signs or symptoms of acute illness; with the diagnosis of malignancy; any clinical condition requiring systemic steroid or other immunosuppressive medication in the preceding six months; uncontrolled diabetes mellitus, pregnant or breastfeeding; anemia (hemoglobin < 7g/dL); significant smoking history (> 30 pack-years). All patients signed informed consent to participate in the study. This study was approved by the Ethics Committee of the Shanghai Public Health Clinical Center.
RNA-sequencing by Illumina HiSeq
Total RNA of each lung sample was extracted by using TRIzol Reagent (Invitrogen, US) and further purified using the RNeasy Mini Kit (Qiagen, Germany) according to the manufacturer’s instructions. Total RNA of each sample was quantified and qualified by Agilent 2100 Bioanalyzer (Agilent Technologies, USA), NanoDrop (Thermo Fisher Scientific Inc., USA) and 1% agarose gel. Total RNA (1 μg) with the value of RNA integrity number (RIN) > 7 was used for library preparation of the following next generation sequencing, with the NEBNext Ultra II Directional RNA Library Prep. Kit for Illumina. The rRNA was depleted from total RNA using Ribo-Zero™ rRNA removal Kit (Illumina, USA), and cDNA libraries were generated following manufacture’s protocols. Then, libraries with different indices were multiplexed and loaded on Illumina HiSeq instrument (Illumina, USA) for 2 × 150 paired-end sequencing according to manufacturer’s instructions in the Medical Laboratory of Nantong ZhongKe.
RNA-sequencing data analysis
Generated raw reads were saved as fastq format. Raw reads were processed by Trimmomatic (version 0.30) to filter dirty reads that with sequence adaptors, primers, fragments, or length of bases less than 20. Afterwards, high quality clean data were aligned to reference genome via software Hisat2 (version 2.0.1). Comparing with the PET-low samples, the mRNAs differentially expressed in PET-high samples were uncovered by the DESeq Bioconductor package. The cut-off criteria were set as |log2 fold change (FC) | > 1 and q value < 0.05, after adjusted by Benjamini and Hochberg’s approach. Hierarchical clustering analysis based on centered Pearson correlation was performed for all the differentially expressed mRNAs via the pheatmap (version 1.0.8) [35, 36]. Meanwhile, differentially expressed lncRNAs between PET-high and PET-low samples were identified by the DESeq Bioconductor package, with the thresholds of |log2 FC| > 0.5 and false discovery rate (FDR) < 0.05.
In order to identify functions and specific signaling pathways of differentially expressed genes, Gene Ontology (GO) and KEGG pathway analyses were performed. The thresholds were set as gene number ≥ 5 and enrichment test p-value ≤ 0.01 [37, 38].
Construction of lncRNA-mRNA co-expression network
The correlations of differentially expressed lncRNAs with differentially expressed mRNAs were evaluated by calculating the Pearson correlation coefficient R values. Fisher's asymptotic test implemented in the WGCNA library of R was adopted to estimate p-values for each correlation pair. The p-value was further adjusted into FDR by Bonferroni multiple test correction implemented in the multtest package of R [39]. The lncRNA-mRNA correlations with the |R| > 0.9 and FDR < 0.005 were regarded as co-expressed and used to construct lncRNA-mRNA co-expression network. The co-expression network was visualized by Cytoscape software. GO functional and KEGG pathway enrichment analysis were conducted for the differentially expressed mRNAs in the lncRNA-mRNA co-expression network, with the criterion of p < 0.05.
LncRNA target prediction and regulatory network construction
Target genes of differentially expressed lncRNAs were predicted via cis- or trans-regulatory effects. LncRNAs and potential target genes were paired and visualized using University of California Santa Cruz (UCSC) genome browser (http://genome-asia.ucsc.edu/index.html). Genes transcribed within a 10 kbp window upstream or downstream of lncRNAs and co-expressed with the lncRNA genes were considered as cis target genes using Bedtools (version 2.17.0). The algorithm for regulation in trans is based on mRNA sequence complementarity and then RNA duplex energy prediction. First, BLAST (version 2.2.28+) software was used sequence complementarity. RNAplex was then used to select trans-acting target gene with threshold parameter of duplex energy–e set as 20.
KEGG pathway analysis was performed for the predicted cis- or trans-target genes among differentially expressed genes to identify important signaling pathways. The correlations of differentially expressed lncRNAs with predicted cis- or trans-target genes were evaluated by calculating the Pearson correlation coefficient R values. The lncRNA-target gene correlations with the |R| > 0.85 and FDR < 0.0005, and the top 30 KEGG pathways were used to construct lncRNA-target pathway network.
Validation of lncRNA and mRNA expressions
The expressions of lncRNAs and mRNAs that had high number of degree in lncRNA-target-pathway network were further confirmed by qRT-PCR. Lung PET-high and PET-low tissues were collected from 11 patients. Total RNA was isolated from each sample using TRIzol reagent and treated with DNase I (Invitrogen) according to the manufacturer’s protocol. RNA was reverse transcribed into cDNA using the PrimeScript RT reagent Kit (Takara, Shiga, Japan) and amplified using the SYBR Green Kit (Takara, Shiga, Japan) on an ABI Prism 7300 sequence detection system (Applied Biosystems, Foster City, USA). The reaction mixture contained cDNA, 200 nM of each primer and 10 μl of 2 × SYBR Green PCR Master Mix (Takara, Shiga, Japan). The primer sequences of lncRNAs and mRNAs were listed in Supplementary Table 3. Reactions were incubated at 95° C for 30s, followed by 40 cycles of 95° C for 10 s and 60° C for 30 s. Reactions were run in triplicate for analysis. At the end of the PCR cycles, melting curve analysis was performed to verify product specificity. Expression levels of lncRNAs and mRNAs were normalized to housekeeping gene GAPDH and the 2-ΔΔCt method was applied to calculate the relative expression levels.
Prediction efficiencies and bioinformatics analysis of lncRNA-binding proteins
The lncRNAs validated by qRT-PCR were further remained as indicators for lesion with high metabolic activity. The prediction efficiencies of lncRNAs were evaluated by receiver operating characteristic (ROC) curve analysis via pROC package (version 1.14.0) to calculate the area under the curve (AUC) [40].
Genomic locations of lncRNA-binding proteins were predicted by using UCSC Genome Browser (http://genome-asia.ucsc.edu/index.html). Secondary structures were identified via RNAfold minimum free energy estimations based on RNAfold webserver (http://rna.tbi.univie.ac.at/cgi-bin/RNAWebSuite/RNAfold.cgi). TRANSFAC (http://www.gene-regulation.com/index2.html) was used to predict the potential transcription factors (TFs) of lncRNAs. Moreover, catRAPID analysis (http://service.tartaglialab.com/) was conducted to predict the potential interacting proteins of lncRNAs.
Ethical approval
The Permission of the Hospital Ethics Committee was obtained by the Shanghai public health clinical center's ethics committee before operation for each patient. (Approval number:2019-S009-02).
Author Contributions
Conceived and designed the experiments: Yanzheng Song, Lin Wang and Ka-Wing Wong. Performed the experiments: Zilu Wen, Hui Ma and Liwei Wu. Analyzed the data: Lin Wang, Zilu Wen, Hui Ma and Liwei Wu. Contributed reagents/materials/analysis tools: Zilu Wen, Hui Ma, Qihang Wu, Liangfei Niu and Liwei Wu. Specifically, Liangfei Niu and Liwei Wu provided the IPA software and contribute to partial analysis work; Laiyi Wan and Jun Wang contribute to the TRANSFAC and UCSC analysis method and analysis; Leilei Li and Laiyi Wan involved in providing PhyloCSF and RNAfold WebServer analysis tools and contribute to partial analysis work; Laiyi Wan contributes to the catRAPID algorithm analysis. Wrote the paper: Lin Wang, Zilu Wen and Ka-Wing Wong. Providing patients: Lin Wang, Zilu Wen, Hui Ma, Liwei Wu, Hui Chen, Hongwei Li, Leilei LI, Yijun Zhu, Lei Shi, Laiyi Wan and Jun Wang.
Conflicts of Interest
The authors declare that they have no conflicts of interest.
Funding
This research was supported by a grant from the Thirteen-Fifth Mega-Scientific Project on “prevention and treatment of AIDS, viral hepatitis and other infectious diseases” (grant no. 2017ZX10201301-003-002).
References
- 1. Houben RM, Dodd PJ. The global burden of latent tuberculosis infection: a re-estimation using mathematical modelling. PLoS Med. 2016; 13:e1002152. https://doi.org/10.1371/journal.pmed.1002152 [PubMed]
- 2. Harding E. WHO global progress report on tuberculosis elimination. Lancet Respir Med. 2020; 8:19. https://doi.org/10.1016/S2213-2600(19)30418-7 [PubMed]
- 3. Siddiqi K, Lambert ML, Walley J. Clinical diagnosis of smear-negative pulmonary tuberculosis in low-income countries: the current evidence. Lancet Infect Dis. 2003; 3:288–96. https://doi.org/10.1016/s1473-3099(03)00609-1 [PubMed]
- 4. Horsburgh CR
Jr . Priorities for the treatment of latent tuberculosis infection in the United States. N Engl J Med. 2004; 350:2060–67. https://doi.org/10.1056/NEJMsa031667 [PubMed] - 5. Kanaya AM, Glidden DV, Chambers HF. Identifying pulmonary tuberculosis in patients with negative sputum smear results. Chest. 2001; 120:349–55. https://doi.org/10.1378/chest.120.2.349 [PubMed]
- 6. Nakanishi M, Demura Y, Ameshima S, Kosaka N, Chiba Y, Nishikawa S, Itoh H, Ishizaki T. Utility of high-resolution computed tomography for predicting risk of sputum smear-negative pulmonary tuberculosis. Eur J Radiol. 2010; 73:545–50. https://doi.org/10.1016/j.ejrad.2008.12.009 [PubMed]
- 7. Lambert ML, Hasker E, Van Deun A, Roberfroid D, Boelaert M, Van der Stuyft P. Recurrence in tuberculosis: relapse or reinfection? Lancet Infect Dis. 2003; 3:282–87. https://doi.org/10.1016/s1473-3099(03)00607-8 [PubMed]
- 8. Gillespie SH, Crook AM, McHugh TD, Mendel CM, Meredith SK, Murray SR, Pappas F, Phillips PP, Nunn AJ, and REMoxTB Consortium. Four-month moxifloxacin-based regimens for drug-sensitive tuberculosis. N Engl J Med. 2014; 371:1577–87. https://doi.org/10.1056/NEJMoa1407426 [PubMed]
- 9. Hu Y, Mangan JA, Dhillon J, Sole KM, Mitchison DA, Butcher PD, Coates AR. Detection of mRNA transcripts and active transcription in persistent mycobacterium tuberculosis induced by exposure to rifampin or pyrazinamide. J Bacteriol. 2000; 182:6358–65. https://doi.org/10.1128/jb.182.22.6358-6365.2000 [PubMed]
- 10. Sathekge MM, Ankrah AO, Lawal I, Vorster M. Monitoring response to therapy. Semin Nucl Med. 2018; 48:166–81. https://doi.org/10.1053/j.semnuclmed.2017.10.004 [PubMed]
- 11. Flick H, Rumetshofer R, Wurzinger G. Tuberkulose. Wien Klin Wochenschr. 2012; 7:33–57. https://doi.org/10.1007/s11812-012-0018-2
- 12. Umutlu L, Beyer T, Grueneisen JS, Rischpler C, Quick HH, Veit-Haibach P, Eiber M, Purz S, Antoch G, Gatidis S, Nikolaou K, Schaefer JF, Rausch I, et al. Whole-body [18F]-FDG-PET/MRI for oncology: a consensus recommendation. Nuklearmedizin. 2019; 58:68–76. https://doi.org/10.1055/a-0830-4453 [PubMed]
- 13. Priftakis D, Riaz S, Zumla A, Bomanji J. Towards more accurate 18F-fluorodeoxyglucose positron emission tomography (18F-FDG PET) imaging in active and latent tuberculosis. Int J Infect Dis. 2020; 92:S85–90. https://doi.org/10.1016/j.ijid.2020.02.017 [PubMed]
- 14. Davis SL, Nuermberger EL, Um PK, Vidal C, Jedynak B, Pomper MG, Bishai WR, Jain SK. Noninvasive pulmonary [18F]-2-fluoro-deoxy-D-glucose positron emission tomography correlates with bactericidal activity of tuberculosis drug treatment. Antimicrob Agents Chemother. 2009; 53:4879–84. https://doi.org/10.1128/AAC.00789-09 [PubMed]
- 15. Ji Y, Shao C, Cui Y, Shao G, Zheng J. 18F-FDG positron-emission tomography/computed tomography findings of radiographic lesions suggesting old healed pulmonary tuberculosis and high-risk signs of predicting recurrence: a retrospective study. Sci Rep. 2019; 9:12582. https://doi.org/10.1038/s41598-019-49057-5 [PubMed]
- 16. Lin PL, Maiello P, Gideon HP, Coleman MT, Cadena AM, Rodgers MA, Gregg R, O’Malley M, Tomko J, Fillmore D, Frye LJ, Rutledge T, DiFazio RM, et al. PET CT identifies reactivation risk in cynomolgus macaques with latent M. Tuberculosis. PLoS Pathog. 2016; 12:e1005739. https://doi.org/10.1371/journal.ppat.1005739 [PubMed]
- 17. Fathizadeh H, Hayat SM, Dao S, Ganbarov K, Tanomand A, Asgharzadeh M, Kafil HS. Long non-coding RNA molecules in tuberculosis. Int J Biol Macromol. 2020; 156:340–46. https://doi.org/10.1016/j.ijbiomac.2020.04.030 [PubMed]
- 18. Page-McCaw A, Ewald AJ, Werb Z. Matrix metalloproteinases and the regulation of tissue remodelling. Nat Rev Mol Cell Biol. 2007; 8:221–33. https://doi.org/10.1038/nrm2125 [PubMed]
- 19. Cabrera S, Maciel M, Hernández-Barrientos D, Calyeca J, Gaxiola M, Selman M, Pardo A. Delayed resolution of bleomycin-induced pulmonary fibrosis in absence of MMP13 (collagenase 3). Am J Physiol Lung Cell Mol Physiol. 2019; 316:L961–76. https://doi.org/10.1152/ajplung.00455.2017 [PubMed]
- 20. Elkington P, Shiomi T, Breen R, Nuttall RK, Ugarte-Gil CA, Walker NF, Saraiva L, Pedersen B, Mauri F, Lipman M, Edwards DR, Robertson BD, D’Armiento J, Friedland JS. MMP-1 drives immunopathology in human tuberculosis and transgenic mice. J Clin Invest. 2011; 121:1827–33. https://doi.org/10.1172/JCI45666 [PubMed]
- 21. Wangoo A, Taylor IK, Haynes AR, Shaw RJ. Up-regulation of alveolar macrophage platelet-derived growth factor-B (PDGF-B) mRNA by interferon-gamma from mycobacterium tuberculosis antigen (PPD)-stimulated lymphocytes. Clin Exp Immunol. 1993; 94:43–50. https://doi.org/10.1111/j.1365-2249.1993.tb05975.x [PubMed]
- 22. Kak G, Tiwari BK, Singh Y, Natarajan K. Regulation of interferon-γ receptor (IFN-γR) expression in macrophages during mycobacterium tuberculosis infection. Biomol Concepts. 2020; 11:76–85. https://doi.org/10.1515/bmc-2020-0006 [PubMed]
- 23. Domingo-Gonzalez R, Prince O, Cooper A, Khader SA. Cytokines and chemokines in mycobacterium tuberculosis infection. Microbiol Spectr. 2016; 4:10.1128. https://doi.org/10.1128/microbiolspec.TBTB2-0018-2016 [PubMed]
- 24. Algood HM, Flynn JL. CCR5-deficient mice control mycobacterium tuberculosis infection despite increased pulmonary lymphocytic infiltration. J Immunol. 2004; 173:3287–96. https://doi.org/10.4049/jimmunol.173.5.3287 [PubMed]
- 25. Vesosky B, Rottinghaus EK, Stromberg P, Turner J, Beamer G. CCL5 participates in early protection against mycobacterium tuberculosis. J Leukoc Biol. 2010; 87:1153–65. https://doi.org/10.1189/jlb.1109742 [PubMed]
- 26. Gunn MD, Kyuwa S, Tam C, Kakiuchi T, Matsuzawa A, Williams LT, Nakano H. Mice lacking expression of secondary lymphoid organ chemokine have defects in lymphocyte homing and dendritic cell localization. J Exp Med. 1999; 189:451–60. https://doi.org/10.1084/jem.189.3.451 [PubMed]
- 27. Kahnert A, Höpken UE, Stein M, Bandermann S, Lipp M, Kaufmann SH. Mycobacterium tuberculosis triggers formation of lymphoid structure in murine lungs. J Infect Dis. 2007; 195:46–54. https://doi.org/10.1086/508894 [PubMed]
- 28. Nathan C, Shiloh MU. Reactive oxygen and nitrogen intermediates in the relationship between mammalian hosts and microbial pathogens. Proc Natl Acad Sci USA. 2000; 97:8841–48. https://doi.org/10.1073/pnas.97.16.8841 [PubMed]
- 29. Bustamante J, Arias AA, Vogt G, Picard C, Galicia LB, Prando C, Grant AV, Marchal CC, Hubeau M, Chapgier A, de Beaucoudrey L, Puel A, Feinberg J, et al. Germline CYBB mutations that selectively affect macrophages in kindreds with X-linked predisposition to tuberculous mycobacterial disease. Nat Immunol. 2011; 12:213–21. https://doi.org/10.1038/ni.1992 [PubMed]
- 30. Blackwell JM, Goswami T, Evans CA, Sibthorpe D, Papo N, White JK, Searle S, Miller EN, Peacock CS, Mohammed H, Ibrahim M. SLC11A1 (formerly NRAMP1) and disease resistance. Cell Microbiol. 2001; 3:773–84. https://doi.org/10.1046/j.1462-5822.2001.00150.x [PubMed]
- 31. Xu YZ, Di Marco S, Gallouzi I, Rola-Pleszczynski M, Radzioch D. RNA-binding protein HuR is required for stabilization of SLC11A1 mRNA and SLC11A1 protein expression. Mol Cell Biol. 2005; 25:8139–49. https://doi.org/10.1128/MCB.25.18.8139-8149.2005 [PubMed]
- 32. Pellarin I, Dall’Acqua A, Gambelli A, Pellizzari I, D’Andrea S, Sonego M, Lorenzon I, Schiappacassi M, Belletti B, Baldassarre G. Splicing factor proline- and glutamine-rich (SFPQ) protein regulates platinum response in ovarian cancer-modulating SRSF2 activity. Oncogene. 2020; 39:4390–403. https://doi.org/10.1038/s41388-020-1292-6 [PubMed]
- 33. Shav-Tal Y, Cohen M, Lapter S, Dye B, Patton JG, Vandekerckhove J, Zipori D. Nuclear relocalization of the pre-mRNA splicing factor PSF during apoptosis involves hyperphosphorylation, masking of antigenic epitopes, and changes in protein interactions. Mol Biol Cell. 2001; 12:2328–40. https://doi.org/10.1091/mbc.12.8.2328 [PubMed]
- 34. Danelishvili L, Yamazaki Y, Selker J, Bermudez LE. Secreted mycobacterium tuberculosis Rv3654c and Rv3655c proteins participate in the suppression of macrophage apoptosis. PLoS One. 2010; 5:e10474. https://doi.org/10.1371/journal.pone.0010474 [PubMed]
- 35. Eisen MB, Spellman PT, Brown PO, Botstein D. Cluster analysis and display of genome-wide expression patterns. Proc Natl Acad Sci USA. 1998; 95:14863–68. https://doi.org/10.1073/pnas.95.25.14863 [PubMed]
- 36. Wang L, Cao C, Ma Q, Zeng Q, Wang H, Cheng Z, Zhu G, Qi J, Ma H, Nian H, Wang Y. RNA-seq analyses of multiple meristems of soybean: novel and alternative transcripts, evolutionary and functional implications. BMC Plant Biol. 2014; 14:169. https://doi.org/10.1186/1471-2229-14-169 [PubMed]
- 37. Ashburner M, Ball CA, Blake JA, Botstein D, Butler H, Cherry JM, Davis AP, Dolinski K, Dwight SS, Eppig JT, Harris MA, Hill DP, Issel-Tarver L, et al. Gene ontology: tool for the unification of biology. The gene ontology consortium. Nat Genet. 2000; 25:25–29. https://doi.org/10.1038/75556 [PubMed]
- 38. Kanehisa M, Goto S. KEGG: kyoto encyclopedia of genes and genomes. Nucleic Acids Res. 2000; 28:27–30. https://doi.org/10.1093/nar/28.1.27 [PubMed]
- 39. Liao Q, Liu C, Yuan X, Kang S, Miao R, Xiao H, Zhao G, Luo H, Bu D, Zhao H, Skogerbø G, Wu Z, Zhao Y. Large-scale prediction of long non-coding RNA functions in a coding-non-coding gene co-expression network. Nucleic Acids Res. 2011; 39:3864–78. https://doi.org/10.1093/nar/gkq1348 [PubMed]
- 40. Robin X, Turck N, Hainard A, Tiberti N, Lisacek F, Sanchez JC, Müller M. pROC: an open-source package for R and S+ to analyze and compare ROC curves. BMC Bioinformatics. 2011; 12:77. https://doi.org/10.1186/1471-2105-12-77 [PubMed]