Transcriptomic alterations in HCC patients with different hypoxia scores
In the previous studies, we established a hypoxia score system based on a novel HCC-specific 21-gene hypoxia signature that could be used to effectively estimate the hypoxia exposure in HCC tissues. In the 10 GEO datasets and the TCGA dataset, hypoxia scores of each tumor tissue samples were calculated. Patients were significantly grouped as high hypoxia exposure group and low hypoxia exposure group according to the hypoxia score (Supplementary Figure 1). First, we analyzed the differences in mRNA expression between HCC patients with high hypoxia scores (greater than the upper quartile) and those with low hypoxia scores (less than the lower quartile) cross the 11 HCC datasets. Here, mRNA with log2FC > 0.58 or log2FC <-0.58 and adjusted P < 0.05 were defined as differentially expressed mRNA (DE-mRNA). In these cohorts, the proportion of DE-mRNA in the total mRNA measured was positively correlated with the interquartile range (IQR) of the liver cancer tissue hypoxia scores in this cohort (Figure 1A), suggesting that the difference in mRNAs was to some extent caused by the difference in hypoxia scores. We counted the frequency of each mRNA identified as a DE-mRNA in all cohorts and included DE-mRNAs with a frequency equal to or greater than 5 in the high frequency/DE-mRNA (HF/DE-mRNA) list. The mRNA changes in this list were relatively consistent among the 10 cohorts. A total of 371 mRNAs were selected, including 192 upregulated DE-mRNAs and 179 down-regulated DE-mRNAs. For a complete HF/DE-mRNA list, see Additional File 1: Supplementary Table 2. Based on the clinical data from the TCGA-LIHC and GSE14520 datasets, we performed survival analysis on 371 HF/DE-mRNAs (logrank test, cut-off = median expression level of candidate mRNA). Through Venny analysis, we integrated the survival data from the TCGA-LIHC and GSE14520 datasets and obtained 129 HF/DE-mRNAs related to HCC survival (logrank PTCGA-LIHC & logrank PGSE14520 < 0.05), which included 59 risk factors (HRTCGA-LIHC & HRGE14520 > 1) and 70 protective factors (HRTCGA-LIHC & HRGE14520 <1). There were 51 HF/DE-mRNAs that met the logrank P < 0.01 and HR < 0.7 or > 1.3 requirements in both of TCGA-LIHC and GSE14520 (Figure 1B). The results of the HF/DE-mRNA survival analysis (logrank test) are shown in Additional File 1: Supplementary Table 3.
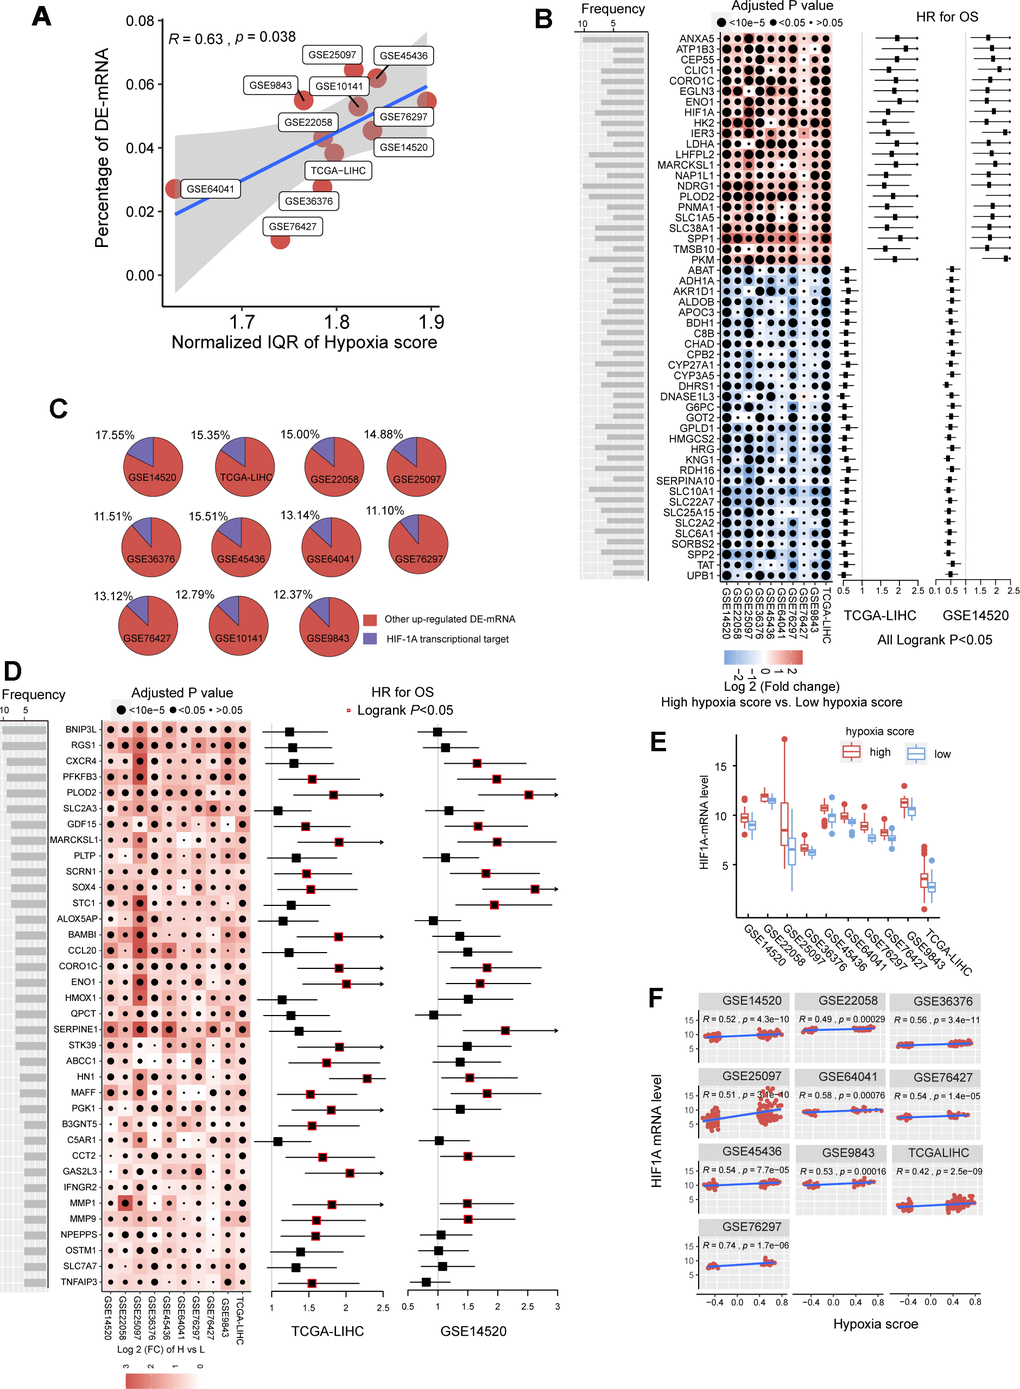
Figure 1. The mRNA alterations in hepatocellular carcinoma (HCC) patients with high hypoxia scores and low hypoxia scores. (A) Hypoxia scores were calculated based on the 21-gene hypoxia signature. According to the upper quartile and the lower quartile, patients were divided into a high hypoxia score group and a low hypoxia score group. In the 11 HCC cohorts, the percentage of differentially expressed (DE)-mRNAs among all mRNAs measured was positively proportional to the interquartile range (IQR) of the hypoxia scores. (B) A total of 51 high frequency/DE-mRNAs (HF/DE-mRNAs) are correlated to HCC patient survival in both TCGA-LIHC and GSE14520. The heat map shows the difference in the expression of these mRNAs between the high hypoxia score group and the low hypoxia score group in the 10 HCC cohorts, that is, the log2 (fold change) between the two groups. The forest plot indicates the hazard ratios (HRs) of these mRNAs for OS in the survival analysis (all logrank P < 0.01, HR < 0.7 or > 1.3, cut-off value = median expression level). (C) The percentage of transcription targets with differentially expressed hypoxia-inducible factor 1-alpha (HIF-1A) in a dataset for all DE-mRNAs in the dataset. (D) Thirty-six mRNAs may function as transcription targets of HIF-1A, and the upregulation trends are consistent in the 10 HCC datasets. The heat map shows the difference in the expression of these mRNAs between the high hypoxia score group and the low hypoxia score group. The forest plot indicates the HRs of these mRNAs for OS in the survival analysis (cut-off = median expression level). (E) The differences in HIF-1A mRNA expression levels between the high hypoxia score group and the low hypoxia score group in 10 HCC datasets. (F) Correlations between HIF-1A mRNA expression levels and hypoxia scores for the 10 HCC datasets.
Hypoxia-inducible factor 1-alpha (HIF-1A) plays a core role in hypoxia. 2450 potential transcription targets genes of the HIF1A transcription factor predicted using the known transcription factor binding site motifs from the TRANSFAC Predicted Transcription Factor Targets database. 10%-15% of the upregulated DE-mRNAs in each cohort may be potential transcription targets of HIF-1A (Figure 1C). Among these potential HIF-1A transcription targets, DE-mRNAs with a frequency higher than 5 among ten cohorts are shown in Figure 1D; most are risk factors for survival. Besides, although HIF-1A protein levels are known to be regulated after translation under hypoxic conditions, 10 HCC datasets indicated that the mRNA level of HIF-1A significantly increased in the high hypoxia score group and showed a significantly positive correlation with the hypoxia score (Figure 1E, 1F).
To further reveal the functions of HF/DE-mRNAs, the enrichments of biological processes and pathways involving HF/DE-mRNA were analyzed using data from different sources, such as Gene Ontology (GO) biological processes, Kyoto Encyclopedia of Genes and Genomes (KEGG) pathways, Reactome Gene Sets, and Canonical Pathways (Figure 2A). In addition to the response to hypoxia, HF/DE-mRNAs are mainly involved in biological processes related to metabolism, including glucose metabolism, lipid metabolism, and amino acid metabolism. As expected, pathway enrichment analysis results for data from multiple sources all showed significant enrichment of the HIF-1 pathway and glucose metabolism pathways; other enriched pathways were mainly related to various metabolic pathways. Besides, some classical tumor-related pathways, such as the PI3K-AKT signaling pathway and activated protein kinase (AMPK) signaling pathway, were also significantly enriched (Additional File 1: Supplementary Table 4). The pathways related to the regulation of the extracellular matrix were also associated with HF/DE-mRNAs. Therefore, we hypothesized that hypoxia exposure might affect the extracellular matrix, which determines tumor invasion and metastasis. To find the connection between terms in the enrichment analysis of biological processes and pathways, we clustered the terms and constructed a network (Figure 2B). The name of each cluster was the name of the most representative term, and the node size was the number of genes in the term. The names of all nodes can be found in Additional File 2. For the HF/DE-mRNA translation products, protein-protein interaction (PPI) enrichment analysis was carried out with the following databases: BioGrid6, InWeb_IM7, and OmniPath8. We constructed a PPI enrichment network of physical interactions using molecular complex detection (MCODE) (Figure 2C). The names of all nodes are listed in Additional File 3. The annotation of each MCODE is shown in Additional File 1: Supplementary Table 5. In addition to focusing on HF/DE-mRNAs, we used gene set enrichment analysis (GSEA) to reveal differences between hallmark gene sets between the high hypoxia score group and the low hypoxia score group based on all mRNA differences between the two groups (Figure 2D). The hypoxia gene set was upregulated in all cohorts with high hypoxia scores. The genes composing the glycolysis gene set was upregulated in the high hypoxia score groups of 9 cohorts. Other upregulated gene sets with high consistency in the 10 cohorts included the P53 pathway, PI3K/AKT/mammalian target of rapamycin (mTOR) signaling, TNFA signaling via NFKB, unfolded protein response, TGF-beta signaling, and MTORC1 signaling. Although the fatty acid metabolism pathway was downregulated in the high hypoxia score groups in the TCGA-LIHC and GSE14520 cohorts, downregulation was not consistent among the other pathways. After applying a bimodality filter and weighted gene correlation network-based clustering, Hoadley's team identified 22 nonredundant gene programs related to the biological behaviors of tumors [10]. We found 15 gene programs that were significantly different between the high hypoxia score group and the low hypoxia score group (Figure 2E), and the single-sample GSEA z-scores for some cancer-promoting gene programs increased in patients with high hypoxia scores.
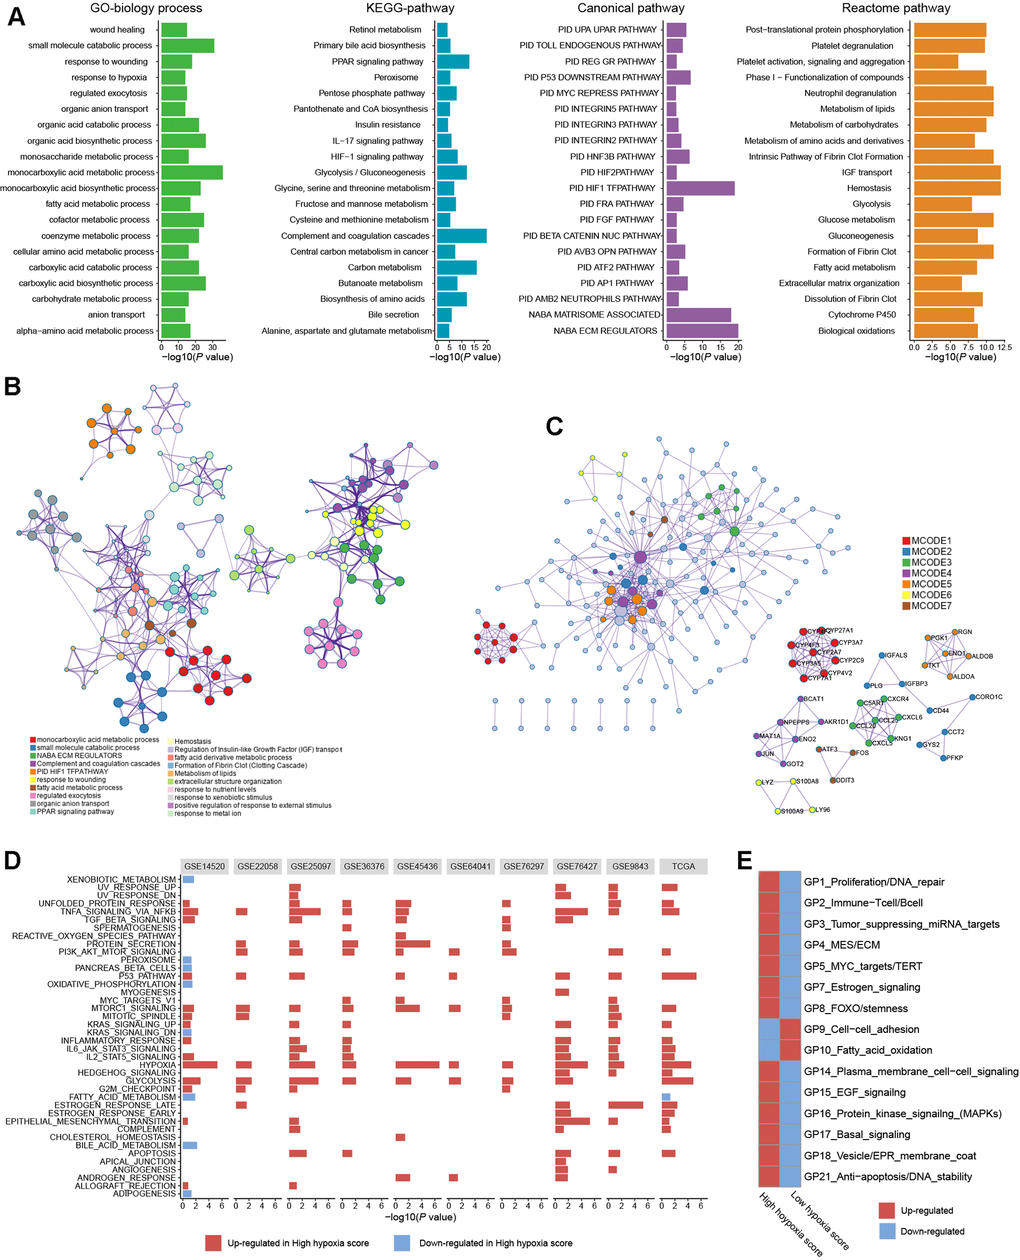
Figure 2. Biological processes and pathway functional enrichment analysis of 371 high frequency/DE-mRNAs (HF/DE-mRNAs) extracted from 10 hepatocellular carcinomas (HCC) datasets. (A) The top 20 (sorted by P-value) from each enrichment analysis result for GO biological processes of HF/DE-mRNAs and the pathway enrichment analysis results for 3 data sources. (B) A clustering network formed by correlated terms from the functional enrichment analysis. (C) Protein-protein interaction (PPI) enrichment network of HF/DE-mRNA translation products constructed based on the molecular complex detection (MCODE) algorithm. (D) Gene set enrichment analysis (GSEA) of HF/DE-mRNAs in 10 datasets, showing the pathways with P < 0.05 and false detection rate (FDR) <0.25. The reference gene sets are the hallmark gene sets. In the TCGA-LIHC dataset, (E) the differences between the high hypoxia score group and the low hypoxia score group in 15 gene programs related to biological behaviors of tumors. These gene programs were identified by Hoadley's team, and the upregulation and downregulation trends were calculated as single-sample GSEA z-scores.
We used TCGA-LIHC data to analyze the differences in microRNAs (miRs) in HCC tissues with high hypoxia scores and low hypoxia scores. The miRs with log2FC > 0.58 or log2FC < -0.58 and adjusted P < 0.05 were defined as differentially expressed miRs (DE-miRs). We found a total of 63 DE-miRs, including 39 upregulated DE-miRs and 24 downregulated DE-miRs. Survival analysis showed that some DE-miRs were related to the OS rate (logrank test, cut-off = median expression level) of HCC patients (Figure 3A and Additional File 1: Supplementary Table 6). In our study, miR-210-3p had the smallest adjusted P value among the upregulated DE-miRs (log2FC = 2.41). Survival analysis using the median expression level as the cut-off showed that miR-210-3p had the largest HR (logrank P < 0.05) and that high miR-210-3p expression indicated a poor prognosis. Additionally, the passenger strand of miR-210 (miR-210-5p) was significantly upregulated in HCC tissues with high hypoxia scores, and high miR-210-5p expression also indicated a poor prognosis. Among the downregulated DE-miRs, miR-139-5p had the smallest adjusted P value (log2FC = -0.68). The response of miR-139-5p to hypoxia has not been reported. We found that low miR-139-5p expression indicates poor outcomes of HCC patients. Next, we predicted target mRNAs of DE-miRs. Combined with the HF/DE-mRNAs list, we obtained 2 independent DE-miRs-HF/DE-mRNAs networks, including upregulated DE-miRs/downregulated DE-mRNAs and downregulated DE-miRs/upregulated DE-mRNAs (Supplementary Figure 2). HIF-1A mRNA has a targeted relationship with some downregulated miRs, such as miR-101-3p and miR-194-3p. These miRs can explain the increase in HIF-1A mRNA expression in the high hypoxia score groups of the 10 cohorts. A survival-related refined network was obtained by combining the survival analysis results (Figure 3B). In this refined DE-miR/DE-mRNA network, all nodes were associated with the survival rate of HCC patients (logrank P < 0.05), and a negative correlation between nodes was indicated (r < -0.4 and P < 0.05). For example, miR-194-5p showed low expression in the high hypoxia score group, which was a protective factor for the survival rate. Its potential target genes, SOX4, HK2, MARCKS, and LHFPL2, showed high expression in the high hypoxia score group and were risk factors for the OS rate. The expression of miR-194-5p was significantly negatively correlated with the mRNA expression of SOX4, HK2, MARCKS, and LHFPL2. The elements in the refined DE-miR/DE-mRNA network should receive more attention. We performed KEGG pathway enrichment analysis on all target genes of DE-miRs. The enrichment results of the top 20 (according to the P-value) were shown in Figure 3C. Some important classical pathways related to tumor development, such as the Hippo pathway, TGF-beta pathway, Ras signaling pathway, mTOR pathway, PI3K-AKT pathway, Wnt pathway, and AMPK pathway, were involved. This result further suggests that these DE-miRs may have an unignorable role in HCC tissues with high hypoxia scores. Besides, more than 80% (54/63) of the DE-miRs had at least one target gene enriched in the HIF-1 signaling pathway. This confirms that DE-miRs identified by the 21-gene hypoxia signature is indeed hypoxic-related.
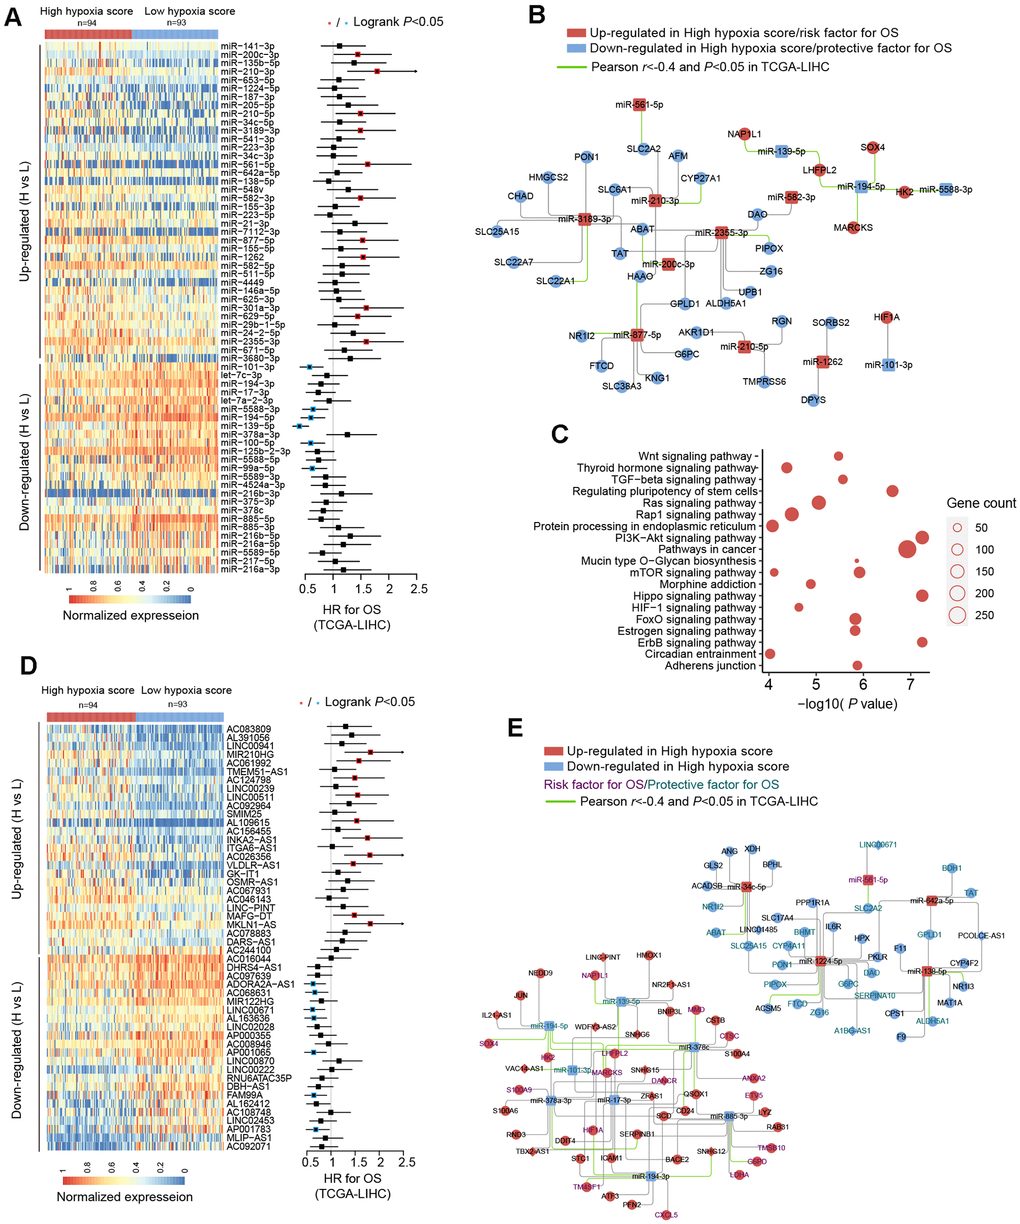
Figure 3. miRNA and long non-coding RNA (lncRNA) alterations in HCC patients with high hypoxia scores and low hypoxia scores. (A) A total of 63 DE-miRNAs were significantly upregulated or downregulated in the high hypoxia score group. The forest plot indicates the hazard ratios (HRs) of these miRNAs for overall survival (OS) in the survival analysis (logrank test). (B) Some DE-miRNAs and HF/DE-mRNAs constitute a survival-related target interaction network. All nodes in the network are correlated with HCC patient survival in TCGA-LIHC (logrank P < 0.05, cut-off = median expression level). The correlations between the nodes were calculated using Pearson correlation analysis. (C) Top 20 (sorted by P-value) KEGG pathway enrichment analysis results from 633 DE-miRNA target genes. (D) Top 50 (sorted by adjusted P-value) DE-lncRNAs that were significantly upregulated or downregulated in the high hypoxia score group. The forest plot indicates the hazard ratios (HRs) of these lncRNAs for OS in the survival analysis (logrank test). (E) The refined DE-lncRNA–DE-miRNA–HF/DE-mRNA ceRNA network. The correlations between nodes were calculated by Pearson correlation analysis. The survival data were from TCGA-LIHC. The cut-off is the median expression level.
Through the 21-gene signature, we revealed the presence of long non-coding RNAs (lncRNAs) that respond to and influence hypoxia exposure. In HCC tissues of patients with high hypoxia scores and low hypoxia scores, we found 719 differentially expressed lncRNAs (DE-lncRNAs), including 499 upregulated DE-lncRNAs and 220 downregulated DE-lncRNAs. The top-50 DE-lncRNAs (sorted by adjusted P) and survival analysis results (logrank test, cut-off = median expression level) are shown in Figure 3D. The complete lists of DE-lncRNAs and survival analysis results can be found in Additional File 1: Supplementary Tables 7, 8, respectively. miR210HG exhibited the most significant change (log2FC = 2.21) among the upregulated DE-lncRNAs. Higher miR210HG suggested poorer survival (HR = 1.82, logrank P < 0.05). Similarly, lncRNAs AC124798 and AC061992 were also upregulated in the high hypoxia score group and suggested poor prognosis. In addition, lncRNAs LNC00671 and FAM99A were downregulated in the high hypoxia score group, which might be protective factors for prognosis. Based on competing endogenous RNA (ceRNA) theory and expression changes, we constructed a DE-lncRNA-DE-microRNA-HF/DE-mRNA network (Figure 3E). The relationship between each node and the survival rate for HCC patients was identified, and a negative correlation between nodes was also indicated. The miR-lncRNA relationship in the network was supported by experimental evidence (provided by DIANA-LncBase). Taking lncRNA-SNHG12 as an example, it exhibits high expression in the high hypoxia score group and is a risk factor for the survival of HCC patients. lncRNA-SNHG12 and miR-194-3p may have sequence complementarity. miR-194-3p was low in the high hypoxia score group and thus is a protective factor for HCC patient survival. The target mRNAs of miR-194-3p were TM4SF1 and HIF-1A. TM4SF1 and HIF-1A showed high expression in the high hypoxia score group and thus were risk factors for HCC patient survival. TM4SF1, HIF-1A, and SNHG12 showed a significantly negative correlation with miR-194-3p. Therefore, a hypoxia-responsive lncRNA-SNHG12/miR-194-3p/TM4SF1 or HIF-1A ceRNA network is likely to present in the cancer tissues of HCC patients, and the ceRNA network is involved in tumor development and is related to patient prognosis. Leaving out sequence complementarity, we constructed the co-expression networks of all HF/DE-mRNAs, DE-miRs, and DE-lncRNAs (|Pearson r| > 0.8 and P < 0.05), including a positive co-network (Supplementary Figure 3A, Pearson r > 0.8 for all nodes) and a negative co-expression network (Supplementary Figure 3B, Pearson r < -0.8 for all nodes); the hub genes in the 2 networks were SERPINC1 and PKM, respectively. SERPINC1 was significantly downregulated in the high hypoxia score groups of 6 cohorts while PKM was significantly upregulated in the high hypoxia score groups of 10 cohorts (Supplementary Figure 3C). Compared with those in normal tissues, SERPINC1 was significantly lower and PKM was significantly higher in HCC tissues (Supplementary Figure 3D). Combined with the survival analysis results (Supplementary Figure 3E), we speculated that SERPINC1 and PKM play important roles, namely, cancer-suppressing and cancer-promoting functions, respectively, under hypoxia exposure. Supplementary Figure 4 displays all mRNAs and lncRNAs related to HIF-1A mRNA levels (|Pearson r|> 0.4 and P < 0.05), and the relationship between nodes and survival was indicated. Among miRs, only microRNA-194-3p and microRNA-194-5p had a significantly negative correlation with HIF-1A. These data may help to explain the differences in HIF-1A mRNA between groups with high hypoxia scores and reflect the core role of HIF-1A mRNA.
Genomic alterations in HCC patients with different hypoxia scores
TCGA-LIHC data were used to reveal somatic copy number aberrations (CNAs) and somatic single-nucleotide variants (SNVs) in HCC patients with different hypoxia scores. First, from the overall differences in gene-level CNAs in patients with high hypoxia scores (greater than the upper quartile) and low hypoxia scores (less than the lower quartile), we found that CNAs of approximately 13.7% (3396/24769) of the genes were concentrated in the high hypoxia score group (Supplementary Figure 5A and Additional File 1: Supplementary Table 9). CNA events in 71 cancer genes (according to the definition of the Precision Oncology Knowledge Base (OncoKB) cancer gene list) were significantly differentially distributed between the two groups (Figure 4A). The copy number gain to copy number loss ratios for most genes were significantly increased in the high hypoxia score group. The roles and CNA tendencies (according to the proportions of homozygous deletions, single copy deletions, low-level copy number amplification, and high-level copy number amplification) of these 71 cancer genes were provided.
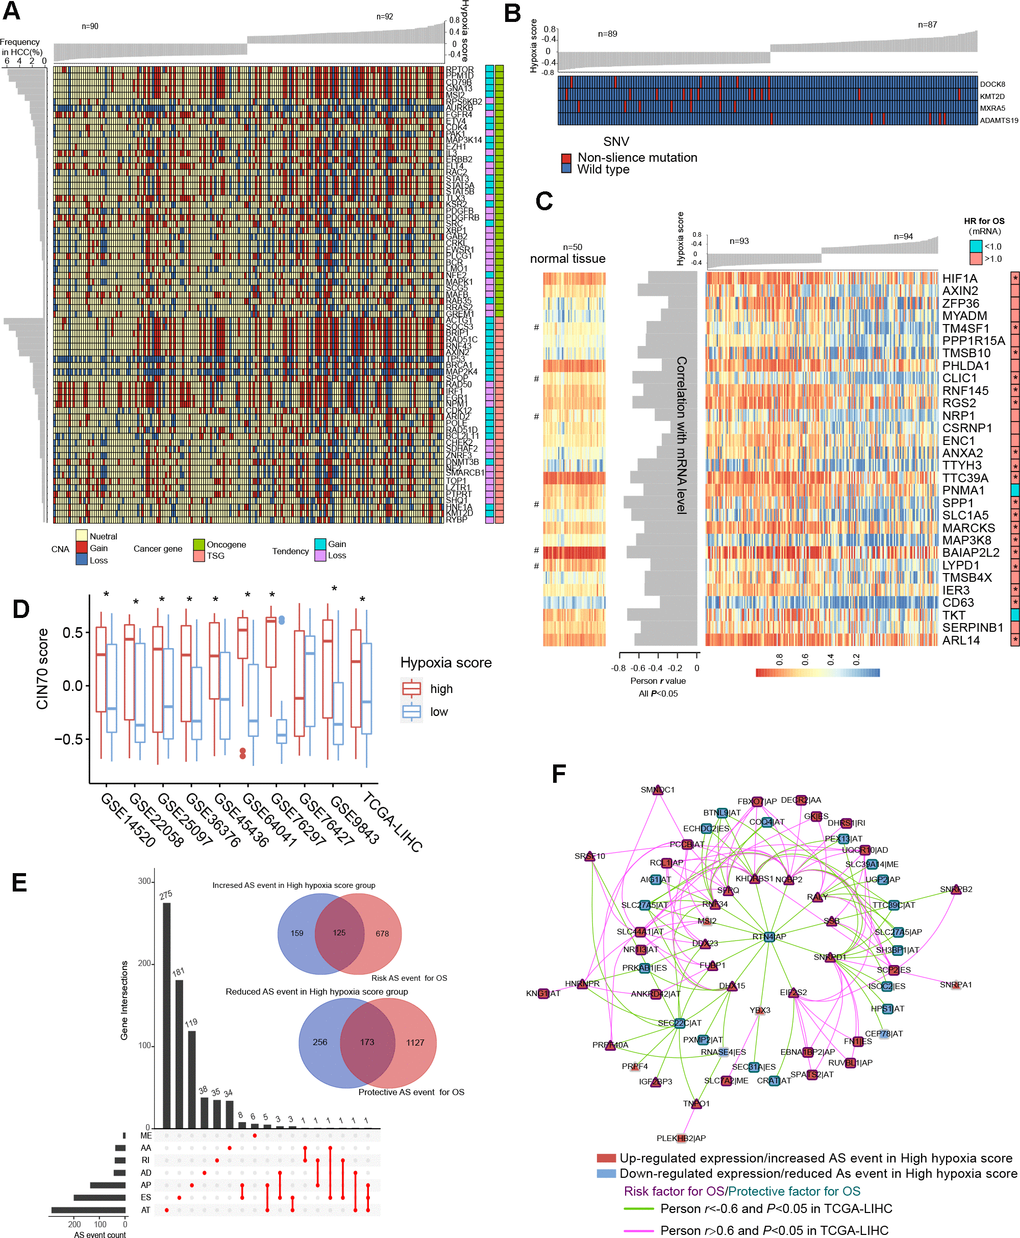
Figure 4. Differences in genomic and epigenetic alterations between groups with high hypoxia scores and low hypoxia scores. (A) The difference in the incidence of copy-number aberrations (CNAs) in 71 cancer genes between the high hypoxia score group and the low hypoxia score group. (B) The proportions of single-nucleotide variants (SNVs) in 4 genes are significantly different between the high hypoxia score group and the low hypoxia score group. (C) Reductions in the methylation levels of 30 genes are accompanied by significant increases in the corresponding mRNA levels in the high hypoxia score group. The correlation between DNA methylation and corresponding mRNA expression was obtained through Pearson correlation analysis based on TCGA-LIHC data. The hazard ratios (HR) of the corresponding mRNAs for overall survival (OS) were calculated by the logrank test for TCGA-LIHC data, and the cut-off was the median expression level. (D) 70-gene chromosome instability (CIN70) was used to assess chromosome instability in tumor tissues from 10 hepatocellular carcinomas (HCC) datasets. The CIN70 scores are significantly different between tumor tissues with high hypoxia scores and low hypoxia scores. (E) The occurrences of 713 AS events are significantly different between the high hypoxia score group and the low hypoxia score group. Some of the AS events are associated with the OS of HCC patients. (F) The expression of 30 splicing factors in the high hypoxia score group and the low hypoxia score group are different, and their expression trends are consistent in 10 datasets. These splicing factors and the AS events with different occurrences between the two groups form a network. The correlations between the nodes of the network were calculated by Pearson correlation analysis based on TCGA-LIHC data. The relationship between the nodes and the OS of HCC patients was obtained through univariate cox survival analysis.
For example, CDK4 is an oncogene, and its CNAs in the high hypoxia score group are mostly copy number gains. IRF1 is a tumor suppressor gene, and its CNAs in the high hypoxia score group were mostly copy number losses. The occurrence frequency of CNAs of some cancer genes was high in patients in the TCGA-LIHC cohort. Next, we analyzed the difference in gene-level SNVs between the two groups of patients. Unfortunately, we did not obtain much evidence that indicated a strong connection between SNVs and hypoxia score. Only 4 genes were significantly different in the incidence of SNVs between the two groups (Figure 4B). Among them, the proportion of non-silent mutations only increased in ADAMTS19 in the high hypoxia score group. Besides, we found that SNVs in 172 genes tended to be concentrated in the low hypoxia score group or the high hypoxia score group (Supplementary Figure 5B). However, because the overall mutation frequency of these genes was not high, there was no statistically significant difference in the distribution of SNVs between the two groups.
Epigenetic alterations in HCC patients with different hypoxia scores
We found that there were significant differences in the methylation levels at 464 gene loci between patients with high hypoxia scores and patients with low hypoxia scores and that the methylation levels at most loci were significantly reduced in the high hypoxia score group (Supplementary Figure 5C and Additional File 1: Supplementary Table 10). The methylation level increased at only a few loci in the high hypoxia score group. We jointly analyzed methylation levels and mRNA expression levels and found a significant increase in mRNA expression levels of 30 genes in the high hypoxia score group (data from TCGA-LIHC) and a simultaneous decrease in their methylation levels (Figure 4C). The mRNA expression levels of these genes showed a significantly negative correlation with their methylation levels, and the high mRNA expression of most of these genes is a risk factor for HCC patient survival. The methylation loci corresponding to these 30 genes and their distance from the transcription start site (TSS) are shown in Additional File 1: Supplementary Table 11. Notably, the degree of methylation of HIF-1A was also reduced in the high hypoxia score group, which provides another explanation for the increase in HIF-1A mRNA expression in the high hypoxia score group. From the comparison of DNA methylation levels of the 30 genes in normal tissues and HCC tissues, the DNA methylation levels of some genes in normal tissues were not different from those in HCC tissues with low hypoxia scores but were higher than those in HCC tissues with high hypoxia scores (such as RGS2), and the DNA methylation levels of some other genes were highest in normal tissues, followed by those in HCC tissues with low hypoxia scores, and lowest in HCC tissues with high hypoxia scores (such as CLIC1).
Chromosome instability occurs throughout the development and progression of tumors. The increase in chromosome instability will lead to HCC cell growth and enhanced invasiveness [11]. The 70-gene chromosome instability (CIN70) signature constructed by Carter et al. can effectively assess the chromosome instability of tumor cells [12]. We compared the CIN70 scores between patients with high hypoxia scores and patients with low hypoxia scores. The data showed that in 9 datasets, the CIN70 scores were significantly increased in the high hypoxia score groups (Figure 4D), suggesting that hypoxia exposure may cause chromosome instability in HCC cells.
Alternative splicing (AS) is an epigenetic feature that plays an important role in tumorigenesis and development [13]. Based on the TCGA-LIHC data, we found that the occurrences of 713 AS events (involving 681 mRNAs) differed significantly between the two groups and that most of these events were alternative terminator (AT), exon skipping (ES), and alternative promoter (AP) events (Figure 4E). In the high hypoxia score group, the percent spliced in (PSI) value of retained intron (RI) events of EPHB2 mRNA had the maximum reduction (adjusted P value < 0.001), and the AT events of GULP1 mRNA had the most increased PSI (adjusted P value < 0.01). The Cox analysis results suggested that the AS events with differences in occurrence between the two groups were related to HCC patient survival. Detailed information on these differentials AS events is provided in Additional File 1: Supplementary Table 12. The 681 mRNAs involved in differential AS events were subjected to functional enrichment analysis of biological processes and pathways. In addition to the HIF1 pathway and sugar and lipid metabolism pathways (indicating their relations to hypoxia exposure), these mRNAs are also involved in various classical pathways of tumorigenesis and development (Supplementary Figure 6A). The PPI network of these mRNA translation products is shown in Supplementary Figure 6B. In addition, we analyzed the differences in expression of 404 splicing factors (SFs) between the high hypoxia score group and the low hypoxia score group. The differences in expression of 30 SFs were relatively consistent in 10 datasets (the condition of adjusted P < 0.05 was met in 5 or more datasets). Except for NRIP2, other SFs were upregulated in the high hypoxia score group (Supplementary Figure 7A). Next, correlations among these SFs and 713 AS events were analyzed. When constructing the correlation network, we only set the thresholds at |Person r |> 0.6 and P < 0.05 and did not perform other node screening. Notably, in the obtained correlation network, each node reached logical harmony in variation trend and prognostic value (Figure 4F). For example, KHDRBS1 is an SF with elevated expression in the high hypoxia score group and is a risk factor for HCC patient survival. The occurrences of 7 AS events that were negatively correlated with KHDRBS1 were reduced in the high hypoxia score group, and these 7 AS events were protective factors for HCC patient survival. In contrast, 5 AS events that were positively correlated with KHDRBS1 increased in the high hypoxia score group, and these AS events were risk factors for HCC patient survival. Based on the evidence, we believe that AS events may be a response to hypoxia in HCC cells. Some hypoxia-induced changes in cell functions and behaviors may be achieved through the SF-AS network. The difference in AS between the high hypoxia score group and the low hypoxia score group may explain the prognosis difference between the two groups.
RNA N6-methyladenosine (m6A) modification is another important epigenetic feature of RNA [14]. The expression differences in 21 m6A regulators between the high hypoxia score group and the low hypoxia score group were analyzed. In the 10 HCC datasets, most m6A regulators showed no significant difference between the two groups (Supplementary Figure 7B), but 1 m6A writer (WTAP), 1 m6A eraser (ALKBH5), and 1 m6A reader (YTHDF2) significantly increased in the high hypoxia score groups of 4 or more datasets.