Effect of age and caloric restriction on the gut microbiome of mice
Using male mice obtained from the aging colony maintained by the NIA, we studied the microbiota composition of the cecum and colon of 9- and 24-month old male C57BL/6JN mice fed AL or CR (started at 14 weeks of age) by sequencing the V4 region of the bacterial 16S rRNA gene. These data are presented in Supplementary Tables 1, 2. Because genotype of the host can impact the microbiome, we also analyzed the microbiome of male B6D2F1 mice obtained from the NIA. Adult B6D2F1 were not available from the NIA; therefore, we were only able to measure the microbiome of the cecum and colon of 24-month-old B6D2F1 mice fed either AL or CR (Supplementary Table 3). The data in Supplementary Tables 1–3 were analyzed by principal component analysis (PCA), and the results are shown in Figure 1. For C57BL/6JN mice (Figure 1A, 1B), adult mice fed AL or CR and the old mice fed CR grouped together for both the cecum and colon. Importantly, old AL mice were clearly segregated from the other three groups for both the cecum and colon, indicating that CR attenuated the effect of age on the microbiome in the old mice. In old B6D2F1 mice (Figure 1C, 1D), we observed a clear separation in the colon microbiome for mice fed AL and CR; however, the microbiome of the cecum of the AL and CR groups overlapped primarily because of one animal (Figure 1C). Figure 1 also shows that when projecting all of the data in the same space, the old mice fed AL consistently occurred on the left side of the plots, indicating that age and CR have similar metagenomic effects in the two strains of mice in both the cecum and colon. In Figure 1E, 1F, we directly compared the microbiome data for the cecum or colon in old C57BL/6JN and B6D2F1 mice. In the cecum, there was very little separation between the four groups. In contrast, we observed a clear separation between AL and CR mice in the colon, suggesting that the effect of CR on the microbiome becomes modified as the fecal material transits to the colon. Interestingly, the C57BL/6JN and B6D2F1 mice grouped together for both AL and CR, indicating that diet was a more important variable than strain with respect to the effect of age and CR on the microbiome.
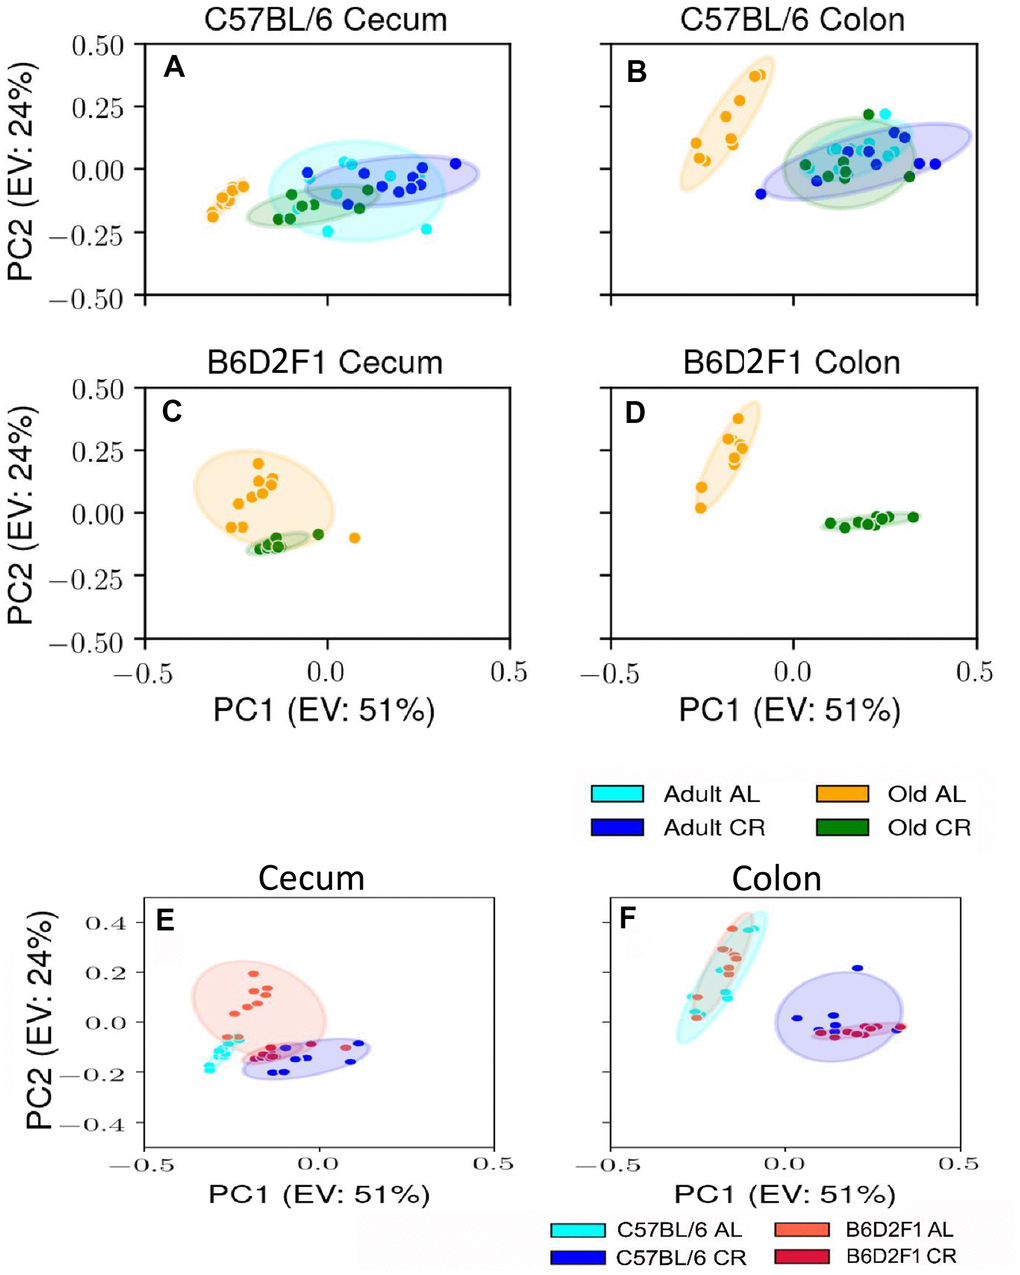
Figure 1. PCA plots showing the variance in the microbiome of mice fed AL and CR. The PCA plots are shown for the microbiome from the cecum (A) and colon (B) of adult and old C57BL/6JN mice fed AL or CR and from the cecum (C) and colon (D)of old B6D2F1 mice fed AL or CR. Panels (E, F) show PCA plots of the microbiome from the cecum and colon, respectively for old C57BL/6JN and B6D2F1 mice fed AL and CR. Ellipses are 95% confidence intervals for the group obtained using bootstrapping, and "EV: XX%" in the axis labels is the percentage of explained variance of the component.
We next studied the effect of age and CR on the diversity of the microbial species present in the microbiome because microbiota diversity is often used as a measure of the ‘health’ of the microbiome, the higher the ratio the ‘healthier’ the microbiome. The data in Figure 2A, 2B show the diversity of the microbiota from cecum and colon of C57BL/6JN mice using Shannon’s diversity index, which equally weights richness (number of different taxa) and evenness (equitability of taxa frequencies) of the microbiome [16]. The diversity of the microbiome in the cecum and colon decreased with age in C57BL/6JN mice fed AL; however, the decrease was only significant for the colon. CR had no effect on the diversity of the microbiome in adult mice; however, in old mice, CR resulted in a significant increase in the diversity of the microbiome in both the cecum and colon, which was comparable to the diversity observed in the adult mice. Figure 2C shows the diversity of the microbiota of the cecum and colon from the old B6D2F1 mice fed AL or CR. In B6D2F1 mice, CR had no significant effect on the diversity of the microbiota in the cecum; however, there was a significant increase in the diversity of the microbiota of the colon.
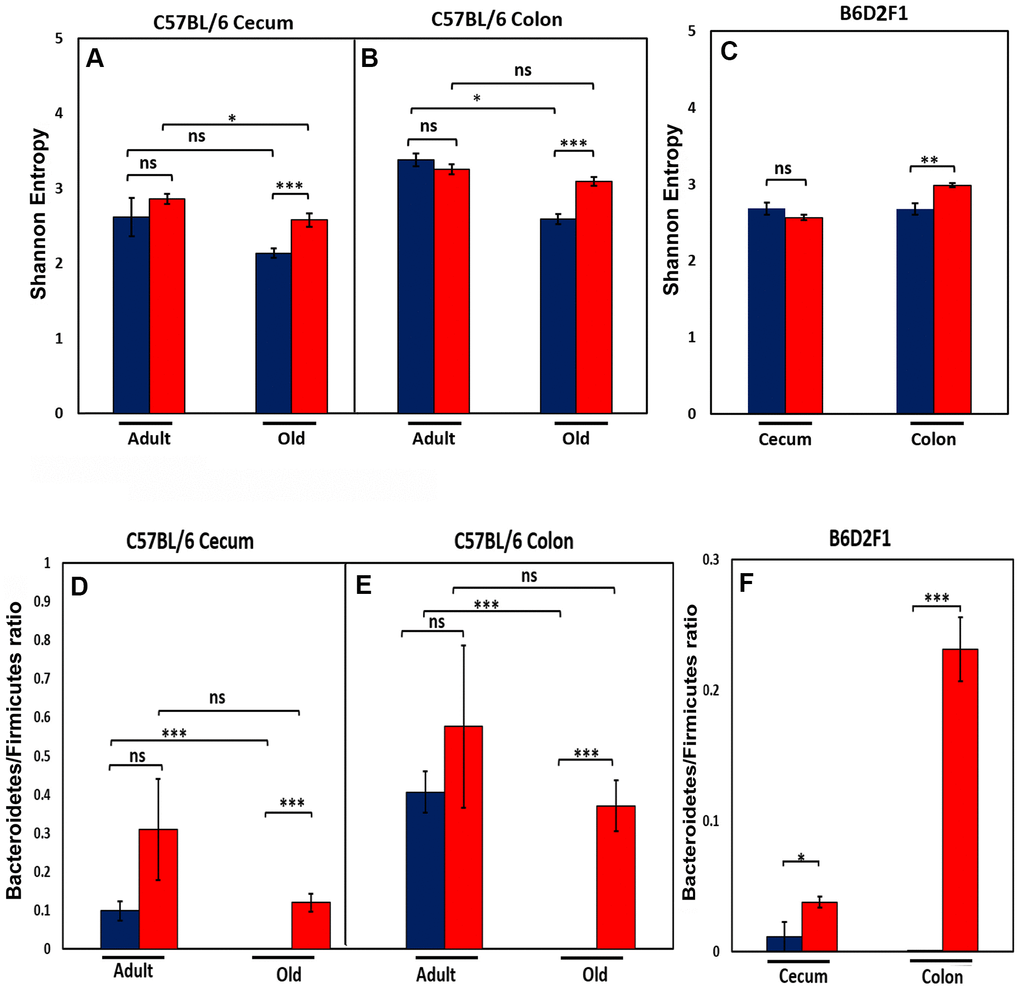
Figure 2. Effect of age and CR on microbiome. The top panel show the Shannon diversity index (Wagner et al., 2018) for the cecum (A) and colon (B) of adult and old C57BL/6JN mice and old B6D2F1 mice (C) fed AL (blue bars) or CR (red bars). The bottom panel show the ratio of Bacteroidetes to Firmicutes for the cecum (D) and colon (E) of adult and old C57BL/6JN mice and for the cecum and colon of old B6D2F1 (F) mice fed AL (blue bars) or CR (red bars). The data represent the mean and SEM for 8- 10 mice per group. *p<0.05, **p<01, ***p<0.001, ns = non-significant.
We also measured the ratio of Bacteroidetes to Firmicutes in the cecum and colon of the C57BL/6JN and B6D2F1 mice because this ratio has been correlated with various diseases and has been reported to change with age [17–20]. Figure 2D, 2E show that the ratio of Bacteroidetes to Firmicutes decreases in both the cecum and colon with age in C57BL/6JN mice, and this decrease is attenuated by CR in old mice resulting in a ratio similar to adult mice fed AL. Although CR increased the ratio of Bacteroidetes to Firmicutes in adult mice, this increase was not statistically significant. In the B6D2F1 mice (Figure 2F), the ratio of Bacteroidetes to Firmicutes was significantly higher in CR mice compared to mice fed AL especially in the colon.
The relative abundance of all the microbes found in the cecum and colon of C57BL/6JN and B6D2F1 are presented in Supplementary Figures 1, 2 respectively. Figures 3, 4 show the abundance of microbes that changed significantly with age or diet for the C57BL/6JN and B6D2F1 mice, respectively. From Figure 3, it is obvious that a major age-related change occurs in the microbiota of C57BL/6JN mice at all three taxonomical levels, and this difference is apparent in both the cecum and colon. The data in Figure 3 also show that CR had only a small effect on the microbiota in the cecum and colon of adult mice. However, CR in the old mice showed a dramatic change in the microbiota compared to old AL in both the cecum and colon, with the microbiota becoming more like the adult C57BL/6JN mice, which is consistent with the PCA data in Figure 1. At the family level, the adult AL and CR mice and old CR mice had similar microbial patterns with a greater increased abundance in the S24-7 and Rikenellaceae families. In contrast, old AL mice showed a higher abundance of the Lachnospiraceae and Ruminococcaceae families. At the genus level, the microbial pattern was quite different for the cecum and colon in contrast to the family and species levels. In the cecum, Bacteroides was the prominent genus in the adult AL and CR mice and old CR mice while Parabacteroides and Lactobacillus predominated in the old AL mice. In the colon, Oscillospira was the prominent genus in all four groups of mice. At the species level, Bacteroides acidifaciens was the most abundant microbe (>60%) in adult AL and CR mice and old CR mice, whereas Ruminococcus gnavus and Muscispirillum schaedleri were more abundant in the old AL mice in both the cecum and colon.
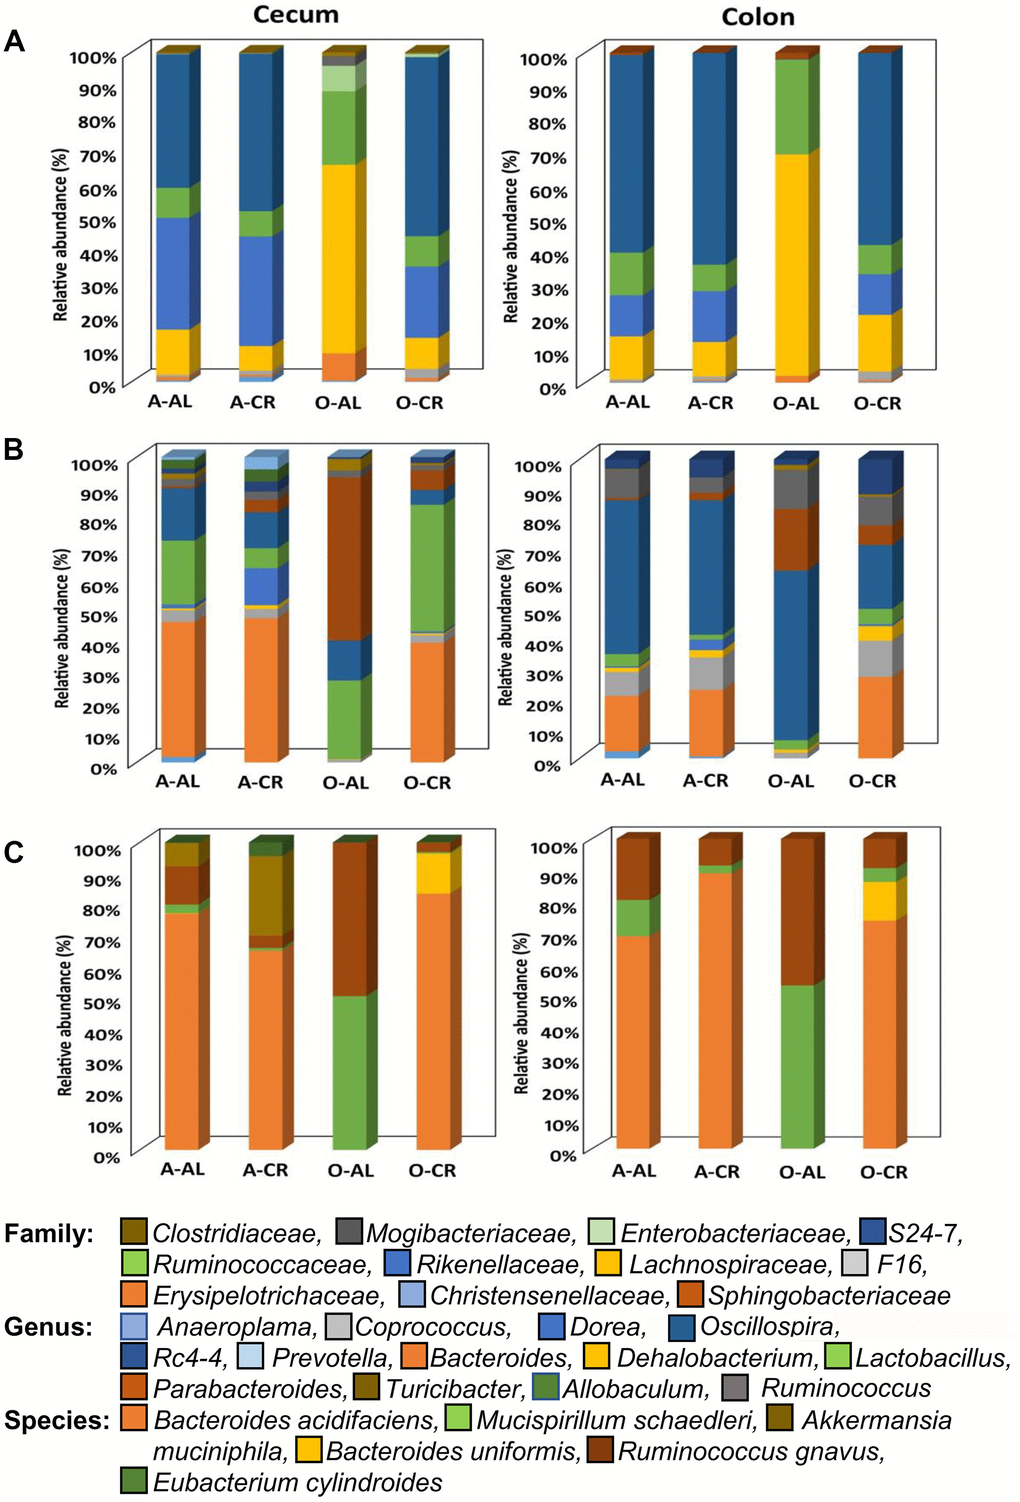
Figure 3. The abundance of microbes that changed with age or CR in C57BL/6 mice. The relative abundance of the 34 microbes that changed significantly in C57BL/6JN mice are shown for adult mice fed AL (A-AL) or CR (A-CR) and old mice fed AL (O-AL) or CR (O-CR). The microbiome data are presented on the basis of family (A), genus (B), or species (C) of the microbes found in either the cecum or colon of the mice.
Figure 4 shows the relative abundance of the microbes that changed with age or diet for old B6D2F1 mice. At the family level, the cecum and colon from old AL mice showed similar profiles with a greater abundance of Lachnospiraceae and Ruminococcaceae as was found in C57BL/6JN mice. The cecum of old CR B6D2F1 mice showed a greater abundance of S24-7 and Rickenellaceae families (which was similar to C57BL/6JN mice) whereas the colon of old CR B6D2F1 mice showed an abundance in the S24-7, Lachnospiraceae, Ruminococcaceae and Rickenellaceae families. At the genus level, the cecum and colon of the old AL B6D2F1 mice showed an increase in the abundance of the Parabacteroides, Oscillospira, Ruminococcus and Rc4-4 families. The cecum of old CR mice showed a greater abundance in Lactobacillus, Oscillospira and Bacteroides families whereas the colon of old CR mice had an increased abundance of Oscillospira (>50%). In the Cecum and colon of old B6D2F1 mice fed AL, Akkermansia municiphila was the prominent species found. In contrast, Bacteroides acidifaciens and Ruminococcus gnavus were the predominant species in the cecum and colon of old CR mice.
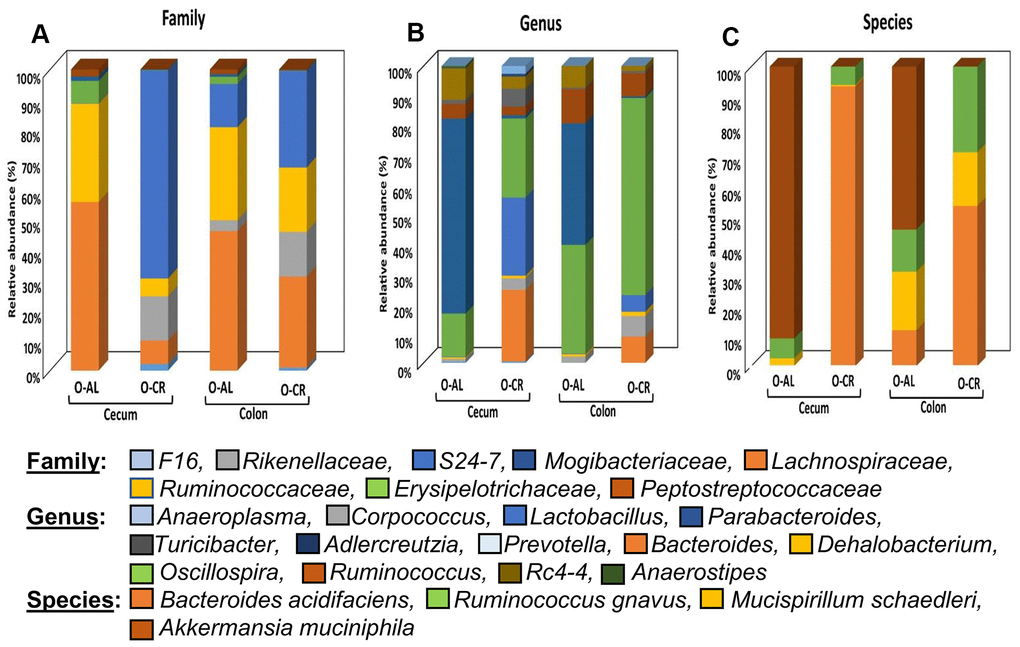
Figure 4. The abundance of microbes that changed with CR in B6D2F1 mice. The relative abundance of the 27 microbes that changed significantly in B6D2F1 mice are shown for old mice fed AL (O-AL) or CR (O-CR). The microbiome data are presented on the basis of family (A), genus (B), or species (C) of the microbes found in either the cecum or colon of the mice.
Of the 35 microbes from different taxonomic levels identified in the gut of C57BL/6JN mice (Supplementary Tables 1, 2), 15 showed a significant change with age that was attenuated by CR in old animals (Table 1). The number (8) of microbes that increased with age and were reduced by CR is similar to the number (7) of microbes that showed a decrease with age and were increased by CR. It is interesting to note, that CR significantly altered the abundance of 11 of the 35 microbes in the cecum of adult mice; 5 of the microbes were significantly altered by CR in old mice. In the colon, the abundance of only one microbe (Christenellaceae family) was significantly altered by CR in adult mice. Thirteen of the 15 microbes listed in Table 1 were also detected in B6D2F1 mice, and of these 13 microbes, over 75% (10) showed the same changes in abundance with CR as was observed in the C57BL/6JN mice. However, CR significantly altered the abundance of several microbes in the old B6D2F1 mice that were not observed in old C57BL/6JN mice. For example, CR reduced the abundance of Akkermansia muciniphila species, the rc4-4 genus, and the Erysipelotrichaceae family in the colon of the B6D2F1 mice. In the cecum of the B6D2F1 mice, CR altered the abundance of 17 of the 27 microbes identified. For both C57BL/6JN and B6D2F1 mice, CR altered significantly the abundance of more microbes in the cecum than in the colon. We further evaluated the total microbes that were altered by CR in both old C57BL/6JN and B6D2F1 (Supplementary Table 4). We observed that the abundance of 21 microbes were changed by CR in the cecum of both old C57BL/6JN and B6D2F1 mice of which 17 of it were found to be altered with age in the C57BL/6JN mice as well (Supplementary Figure 3A). And there were 4 microbes that were unchanged with age in the C57BL/6JN mice but were altered by CR in both strains of mice (Supplementary Figure 3A). Similarly, CR altered the abundance of 20 microbes in the colon of old C57BL/6JN and B6D2F1 mice (Supplementary Figure 3B). Of the 20 microbes, 16 were found altered with age in the C57BL/6JN mice as well and 4 were found altered only in the old CR C57BL/6JN and B6D2F1 mice. Bacteriodes acidifaciens, Family S24-7, Rikenellaceae and F16 in cecum and Genus Bacteriodes, Bacteriodes acidifaciens, Family Rikenellaceae and F16 in colon were the microbes that were altered by CR independent of the strain but were found to be unchanged in the old C57BL/6JN mice (Supplementary Table 4).
Table 1. Microbiota that changed with age and are reversed by caloric restriction.
| Microbiota | C57BL/6 Mice | B6D3F1 Mice |
| Cecum | Colon | Cecum | Colon |
| Bacteroides acidifaciens | ↑ | ↑ | ↑ | NC |
| Mucispirillum schaedleri | ↓ | ↓ | NC | NC |
| Genus Bacteroides | ↑ | ↑ | ↑ | ↑ |
| Genus Coprococcus | NC | ↑ | NC | NC |
| Genus Oscillospira | ↓ | ↓ | ↓ | NC |
| Genus Parabacteroides | ↓ | ↓ | ↓ | ↓ |
| Genus Ruminococcus | ↓ | ↓ | ↓ | ↓ |
| Family Christensenellaceae | NC | ↑ | ND | ND |
| Family F16 | ↑ | ↑ | ↑ | ↑ |
| Family Mogibacteriaceae | ↓ | ND | ↓ | ↓ |
| Family Rikenellaceae | ↑ | ↑ | ↑ | ↑ |
| Family S24-7 | ↑ | ↑ | ↑ | ↑ |
| Order Bacteroidales | ↑ | ND | ND | ND |
| Order Clostridiales | NC | ↓ | NC | ↑ |
| Order RF39 | ↓ | NC | NC | NC |
| The data are taken from Supplementary Tables 1–3 in the supplement. For the C57BL/6 mice: ↑indicates microbes that showed a decrease in abundance with age that was significantly increased by CR in old mice and ↓ indicates microbes that increased in abundance with age and was significantly reduced by CR in old mice. In B6D2F1 mice: ↑indicates microbes that showed significant increase in abundance by CR in old mice and ↓ indicates microbes that showed significant decrease in abundance by CR in old mice. NC = No Significant Change. ND = Not Detected. |
Figure 5 shows the effect of age and CR in C57BL/6JN mice on the abundance of the six microbes from Table 1 that were the most abundant; collectively, these microbes comprised between 5 to 50% of the microbiome. The abundance of all six microbes showed similar changes with CR in the cecum and colon. Four of microbes showed a major decrease in abundance with age (Bacteroides acidifaciens, Bacteroides, Rikenellaceae, and S24-7), which was completely reversed by CR. Two of the most abundant microbes that showed the most dramatic changes were the genus Parabacteroides and the S24-7 family. Parabacteroides increased 100-fold in the cecum from less than 1% to over 25% of the microbiota in the old AL mice. In the colon, Parabacteroides abundance increased over 30-fold in the colon making up almost 5% of the microbiota in the old AL mice. CR reduced the abundance of Parabacteroides to less than 2% in both the cecum and colon of old mice. The S24-7 family of microbes decreased from 17 to 27% in the cecum and colon, respectively, of adult mice to negligible levels (less than 0.2%) in the old AL mice. CR resulted in an increase in the abundance of the S24-7 family to over 19% in the cecum and colon.
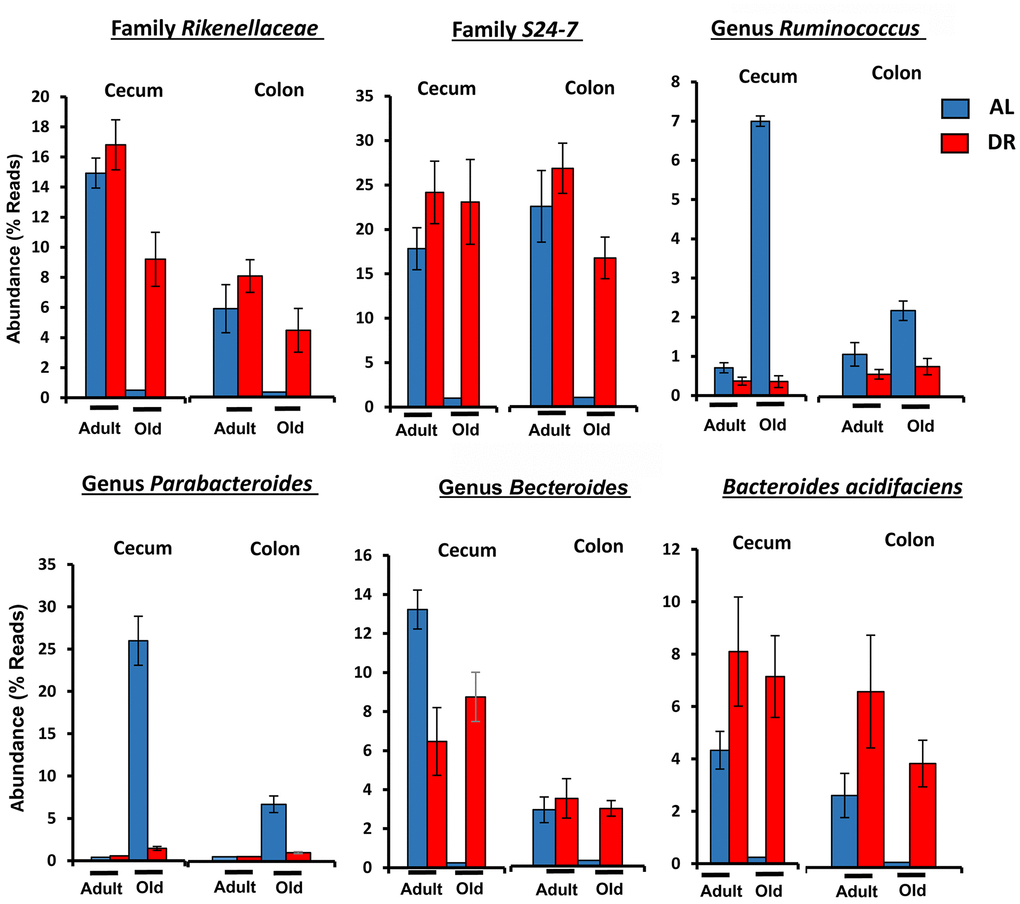
Figure 5. The effect of age and CR on the abundance of the six major microbes found in C57BL/6JN mice. The relative abundance (mean and SEM) of six microbes from Table 1 are shown for 8-10 mice per group for adult and old C57BL/6JN mice fed AL (blue bars) and CR (red bars).
We next determined the degree of association in the abundance of the four microbial classes that made up the majority of microbes that changed with age and diet. Figure 6 shows the t-statistic from the OLS model when each coefficient is plotted for each microbial class. A positive t-statistic for diet indicates that microbial abundance in that class increases with CR, and a positive t-statistic for age indicates that microbial abundance increases with age. The data in Figure 6 show a negative correlation for the phylogenetic class with CR and age, indicating that CR has opposing effects on the gut microbiome compared to age. In addition, the phylogenetic class Bacteroidia is associated with CR and youth, whereas the class Clostridia is associated with AL and age.
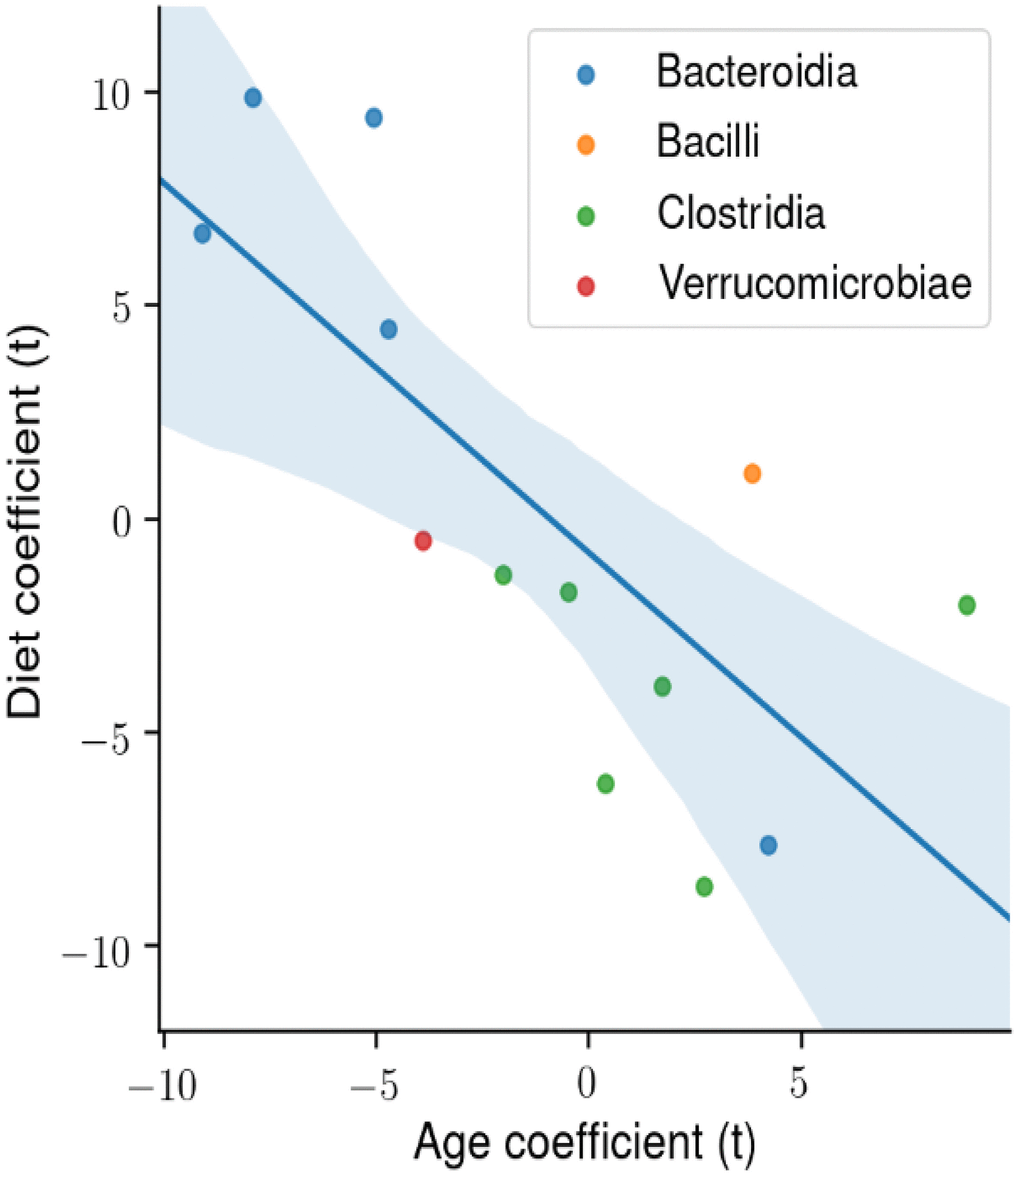
Figure 6. The degree of association between microbial taxa abundance, age, and diet. Using ordinary least squares (OLS) linear model, the t-statistic for each coefficient is plotted for the microbial phylogenetic classes: Bacteroidia, Bacilli, Clostridia, Verrucomicrobiae. There is a significant negative correlation between the age and diet t-statistic.
Effect of age and caloric restriction on the metabolite composition of the fecal material from the colon of mice
To understand how age and CR might affect the microbiome, we also measured the metabolites in the fecal pellets from the colon of the C57BL/6JN and B6D2F1 mice by targeted liquid chromatography mass spectrometry as described in the Methods. Supplementary Table 5 lists the 98 metabolites detected in the fecal samples and the levels of these metabolites in the fecal pellets obtained from the two strains of mice. We observed that the levels of 57 of the 98 metabolites exhibited a significant change with either age (old AL vs adult AL in C57BL/6JN) or CR in the C57BL/6JN (old AL vs old CR) and B6D2F1 (old AL vs old CR) mice as shown in the Venn diagram in Figure 7A. The levels of 36 metabolites changed with age in AL C57BL/6JN mice, 30 changed with CR in the old C57BL/6JN mice, and 43 changed with CR in the old B5D2F1 mice. Approximately 60% of the metabolites that changed with age were significantly attenuated by CR in the C57BL/6JN mice and two-thirds of the metabolites that changed with CR were the same for the old C57BL/6JN and B6D2F1 mice. The data in Supplementary Table 5 were analyzed by principal component analysis, and the results are shown in Figure 7B, 7C. For the C57BL/6JN mice, the adult AL and CR mice and the old CR mice overlapped; however, the old mice fed AL formed a separate cluster (Figure 7B). Figure 7C shows the PCA for old mice fed either AL or CR. While there was some overlap between old C57BL/6JN and B6D2F1 mice fed AL, the old CR C57BL/6JN or B6D2F1 mice were clearly separated from the old mice fed AL, with the B6D2F1 mice showing the greatest separation.
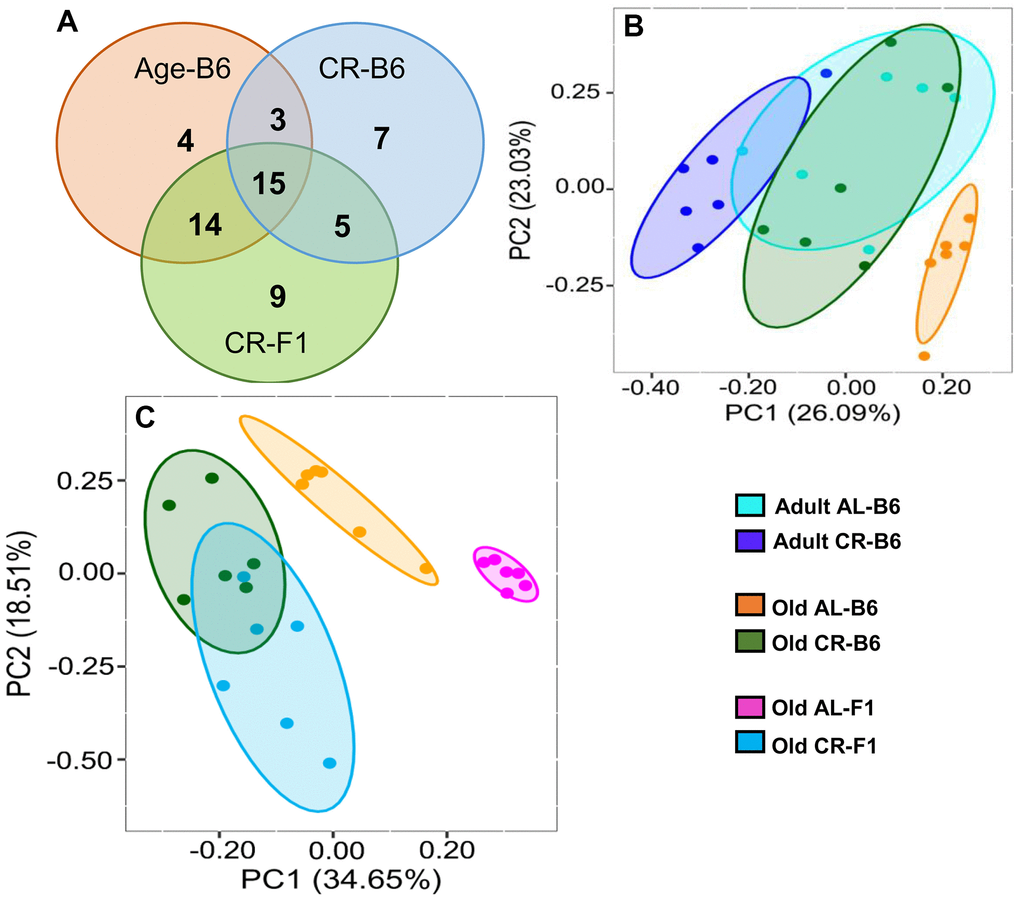
Figure 7. Effect of age and CR on the fecal metabolome. (A) Venn diagram showing the distribution of the number of metabolites that changed significantly in C57BL/6JN mice with age (orange) or with CR in old C57BL/6JN mice (blue) or changed significantly with CR in B6D2F1 mice (green). (B) PCA Analysis of fecal metabolites from adult and old C57BL/6JN mice fed AL or CR (6 mice/group). Data normalized and imputed from the 98 metabolites. (C) PCA Analysis of fecal metabolites from old AL and CR C57BL/6JN and B6D2F1 mice (6 mice/group) normalized and imputed from the 98 metabolites.
Figure 8A shows the heatmap of the 48 metabolites that changed significantly (FDR <0.05) in the C57BL/6JN mice (Old AL vs Adult AL and Old AL vs Old CR). It is evident, that the pattern of the fecal metabolites from the old AL mice was quite different from that observed for the adult AL or CR mice. The pattern of metabolites in the old CR approached a pattern more similar to that observed in the adult mice. Figure 8B shows the heatmap of the 53 metabolites that were changed significantly by CR (Old AL vs Old CR) in either old C57BL/6JN mice or old B6D2F1 mice. The pattern of fecal metabolites is quite different for the old C57BL/6JN and B6D2F1 mice fed even though their microbiome composition were similar (Figure 1F). CR resulted in a dramatic change in the pattern of metabolites in both strains of mice. Interestingly, the difference in the metabolite pattern between the C57BL/6JN and B6D2F1 mice was largely resolved by CR. CR had a greater effect on the fecal metabolome of the B6D2F1 mice than the C57BL/6JN mice.
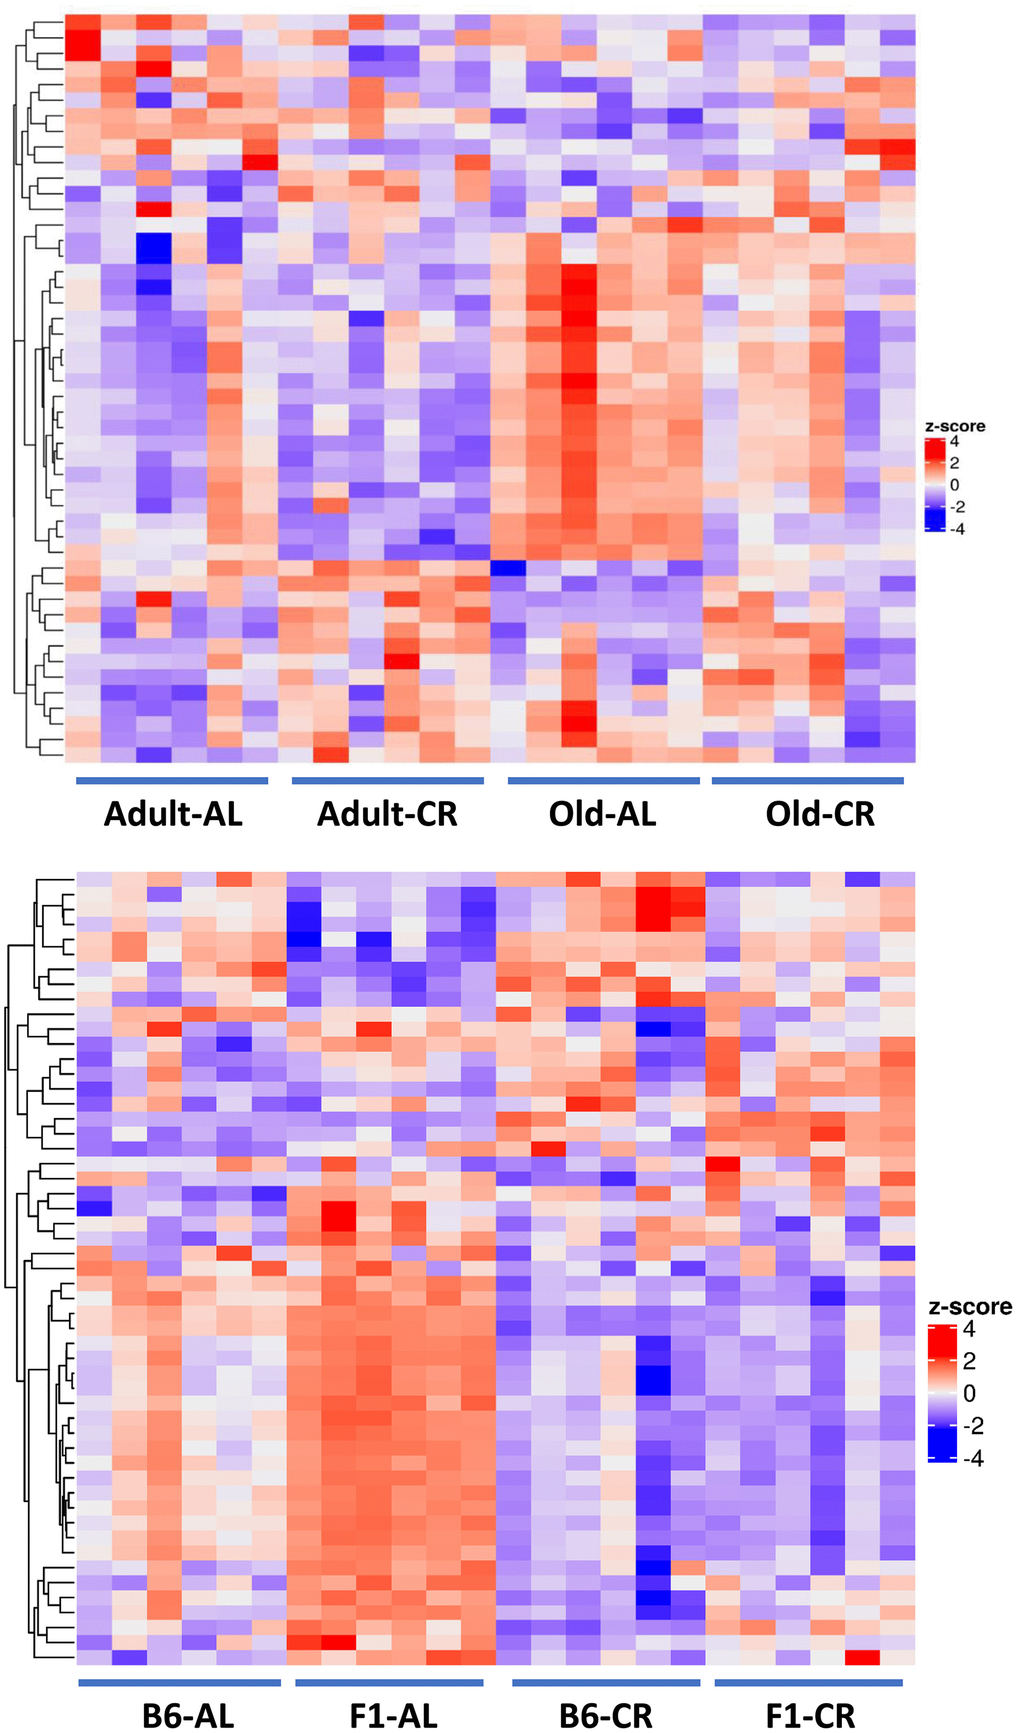
Figure 8. Heatmaps of the fecal metabolome. Top Panel: Heatmap of the 48 metabolites that changed significantly (FDR <0.05) with either Old AL vs. Adult AL or Old AL vs. Old CR comparisons in C57BL/6JN mice (6 mice per group). Bottom Panel: The heatmap shows the relative levels of the 53 metabolites that changed significantly (FDR <0.05) with CR in either old C57BL/6JN or old B6D2F1 mice (6 mice per group). In order to generate the heatmap, we computed a z-score of the log2-abundance, where we adjusted the data, by metabolites, to have a mean of zero and a standard deviation of 1. The heatmap is generated using the Complex Heatmap R package, where the metabolites were clustered via the hclust function with the “complete” agglomeration method. Distance matrix for clustering are computed using “Euclidean” distance. The resulting heatmap presents the metabolites in rows and samples in columns.
We next determined the effects of age, diet, and strain on the metabolomic profile using an OLS linear model. The coefficients of this model reflect the independent fold changes on metabolic pathways represented by the metabolites that changed with age, diet, and strain. The heatmap in Figure 9A shows the average log2FC attributable to age, diet, and strain among all the metabolites measured in the respective pathways. The data show the following: the metabolomic effects of age and CR are broadly anti-correlated and the metabolomic profile of the B6D2F1 mice is correlated with that of CR and anti-correlated with that of age, suggesting that the B6D2F1 mice have bacteria that produce metabolites that are more reflective of the bacteria in younger animals and CR mice compared to the C57BL/6JN mice. To contrast the effects of age and CR on the metabolomic profile, we again used an OLS linear model where the coefficients reflect the independent fold changes in metabolome abundance resulting from age and diet. Figure 9B shows the average log2FC attributable to age and diet among all the metabolites measured in their respective pathways. The data show that the effects of age and CR on the metabolome are broadly anti-correlated as one would predict. In addition, pathways related to amino acid metabolism broadly increase with age and decrease with CR, whereas pathways associated with nucleotide metabolism increase with CR and decrease with age.
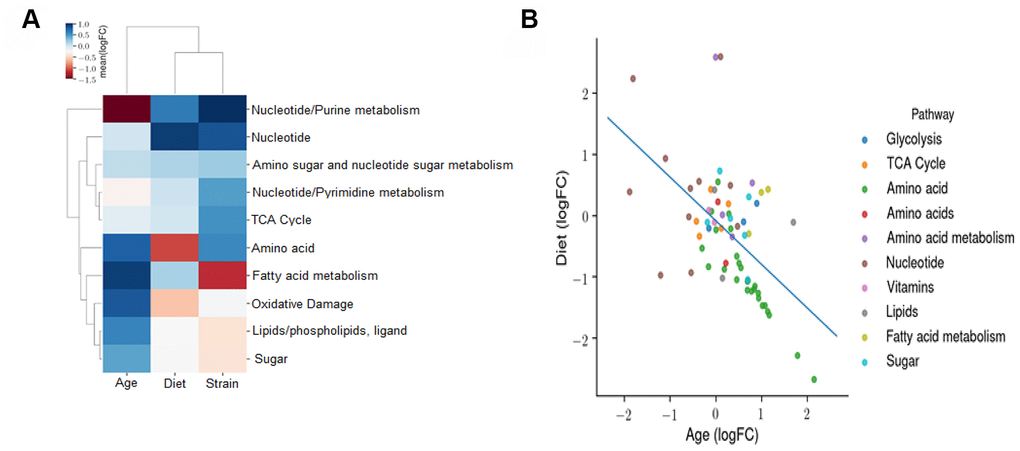
Figure 9. Effect of age, diet, and strain on the fecal metabolome. (A) An ordinary least squares (OLS) linear model with the formula *log (Abundance) ~ Age + Diet + Strain* is fitted to evaluate the effects of age, diet, and strain on the metabolomic profile. The coefficients of this model reflect the independent fold changes on metabolomic abundances caused by age, diet, and strain. This panel displays the average log2FC attributable to age, diet, and strain among all the metabolites measured in the respective pathways. A positive value for age, diet, or strain indicates that this metabolomic pathway is increased with age, DR, or B6D2F1 (versus C57BL/6JN), respectively. (B) OLS linear model coefficients reflecting the independent fold changes in metabolomic abundances caused by age and diet. The average log2FC attributable to age and diet among all the metabolites measured in the respective pathways are shown. A positive value for age or diet indicates that this metabolomic pathway is increased with age or CR, respectively.
Effect of age and caloric restriction on the transcriptome of mucosa from the colon of mice
To gain an understanding of the potential interaction between the microbiome and intestine, we studied the effect of age and CR on the transcriptome of intestinal mucosa isolated from the colon of C57BL/6JN mice used to study the microbiome and metabolome. We identified a total of 45,796 transcripts, and after filtering for low raw counts, there were 36,083 transcripts. Differential expression analysis showed that the expression of 723 mucosal genes changed significantly [P (Corr) < 0.05 and 2.0-fold] with either age (old AL vs adult AL) or CR (old CR vs old AL and adult CR vs adult AL) in C57BL/6JN mice. Of the 660 genes that changed with age (279 increased, 381 decreased), CR reversed the age-related changes in 189 of the genes (29%) in old mice. In addition, CR significantly changed the levels of 57 genes that did not change with age in old mice, i.e., approximately one-fourth of the genes that changed with CR did not change with age. Interestingly, CR resulted in significant changes in 94 of the genes in adult mice and over 50% of these genes remained changed by CR in the old mice. Supplementary Table 6 lists the top 20 genes whose expression changed the most with age and CR.
Figure 10A shows PCA analysis of differentially expressed genes [P (Corr) < 0.05 and 2.0-fold] in old CR, old AL, adult CR based on adult AL in the C57BL/6JN mice. The transcriptomes of the adult and old CR mice formed clusters that were clearly separated from each other. In contrast to what we observed for the microbiome and metabolome, both adult CR and old CR formed clusters that were clearly separate from their AL counterparts. Interestingly, adult and old CR mice formed clusters that overlapped, suggesting a similarity in the transcriptome of adult and old CR mice. Figure 10B shows the heatmap of genes that changed significantly in the C57BL/6JN mice. CR resulted in a major shift in the transcriptome pattern in both adult and old mice. These data agree with the PCA data in Figure 10A, which showed that CR altered the transcriptome in both adult mice and old mice.
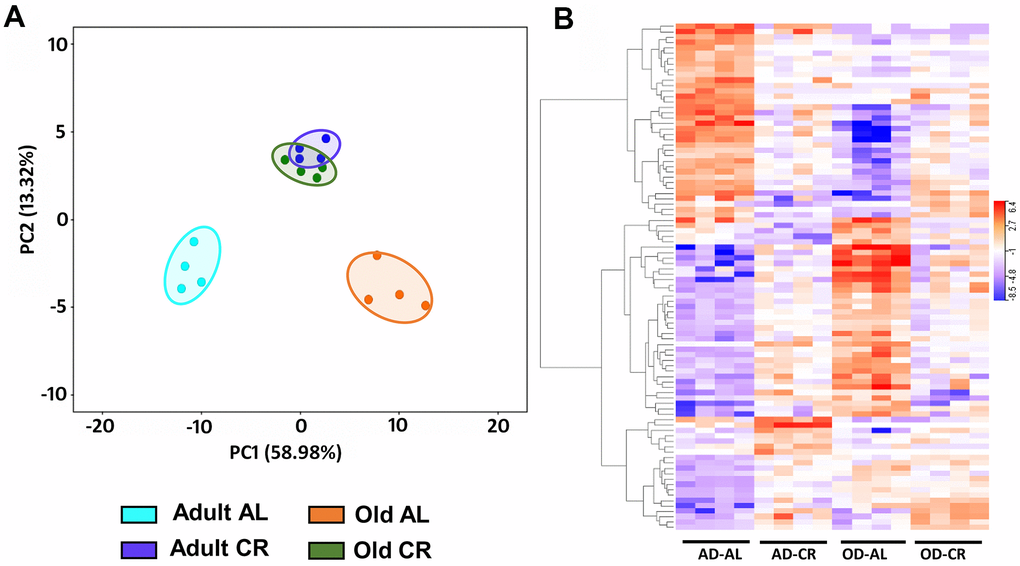
Figure 10. Analysis of colon mucosa transcriptome of C57BL/6JN mice fed AL and CR. (A) PCA analysis of transcriptome from adult and old mice fed AL or CR. (B) Heatmap of the relative levels of the transcripts that changed significantly with either age and/or CR in individual mice compared to Adult AL mice. The data were collected from 4 mice per group, and the PCA and heatmap plots show 94 transcripts that show 2-fold change in expression [P (Corr) <=0.05)].