


Introduction
Non-Mendelian Alzheimer’s disease (AD) has become the paradigm of a complex disease for which a major genetic determinant is known, the APOE locus. Three linkage studies published in 1993 pointed to the APOE region at 19q13 as a risk locus for late onset familial AD [1, 2], and even common sporadic late-onset AD (LOAD) [3]. Shortly after, researchers around the world confirmed the association of APOE gene with diverse forms of the disease and its association with other dementias.
The APOE gene encodes a lipoprotein firstly identified in the 1970s among patients with familial hypercholesterolemia type III [4, 5]. The protein has three major isoforms depending on the combination of two polymorphisms located at positions 112 (rs429358 (C > T)) and 158 (rs7412 (C > T). The most common isoform, APOE3, has a cysteine at position 112 and an arginine at position 158, whereas APOE2, the least common isoform, has a cysteine at both positions, and the AD risk allele APOE4 has an arginine at both positions [6–8]. These aminoacidic substitutions result in a conformational change that brings together the N-terminal and C-terminal domains in APOE4, which are normally separated in APOE2 and APOE3 isoforms. The consequences in downstream signaling of this conformational shift in the APOE4 isoform are still unknown. In fact, it is not even clear if the APOE4 is a gain or loss of function mutation despite extensive research in the field [9]. What is already known is that having a single APOE4 allele increases risk 2- to 4-fold and having two APOE4 alleles increases risk about 8- to 12-fold, although risk varies according to genetic background and sex [10].
In the last years, genome-wide association studies (GWAS) have contributed a number of Alzheimer’s disease associated low penetrance genes, including ABCA7, ABI3, ACE, AC074212.3, ADAM10, ADAMTS1, ADAMTS4, ALPK2, ANKDR31, APH1B, ATP5H, BIN1, BZRAP1-AS1, CASS4, CD2AP, CD33, CELF1-MADD, CLNK, CLU, CNTNAP2, CR1, DSG2, ECHDC3, EPHA1, FERMT2, HESX1, HLA-DRB5–HLA-DRB1, HS3ST1, KAT8, IQCK, INPP5D, NME8, NYAP1, MS4A gene cluster, NDUFAF6, OARD1, PICALM, PLCG2, PTK2B, SCIMP, SLC24A4, SORL1, SPI1, TREM2, WWOX, ZCWPW1 [11–14]. Some reports have performed stratified analyses based on the presence or absence of the APOE4 allele, identifying some additional genes with effect in APOE4 carriers (such as ISYNA1, CUGBP2) or in individuals lacking the E4 allele (AC099552, GPAA1, MAPT, NSF, TREM2) [15–18].
One aim of the ADAPTED consortium is to identify specific APOE signatures associated with the different APOE isoforms. We describe for the first time herewith a comprehensive integration of genomic, transcriptomic and proteomic data stratified by the three major APOE haplotypes.
Results
GWAS data: SNP-level analysis
The combined analysis of the three stages (stage I+II+III) (Figure 1 and Supplementary Tables 1–3 and Supplementary Figures 1–3), identified genome-wide significant signals (p<5x10⁻⁸) for APOE, BIN1, CLU, CNTNAP2 and PICALM in the APOE4 stratum; suggestive signals (p<10-5) in this analysis include a 1.4Mb intergenic region on 4p15. (from 33.3Mb to 34.7 Mb, hg19) with lowest p value for the SNP rs12641122 (p=6.28x10⁻⁷), a 4.5Kb intergenic region on 4q35.2 or the KCNQ3 gene among others. In the APOE3 stratum, ABCA7, BIN1 and PICALM passed the genome-wide significance threshold, with suggestive signals for the HLA-DQ/HLA-DR loci, CTNND2, FBN1, WLS or CSTF1 genes among others. By contrast, no genome wide significant SNPs were found in the APOE2 stratum, nor any known AD gene among suggestive signals.
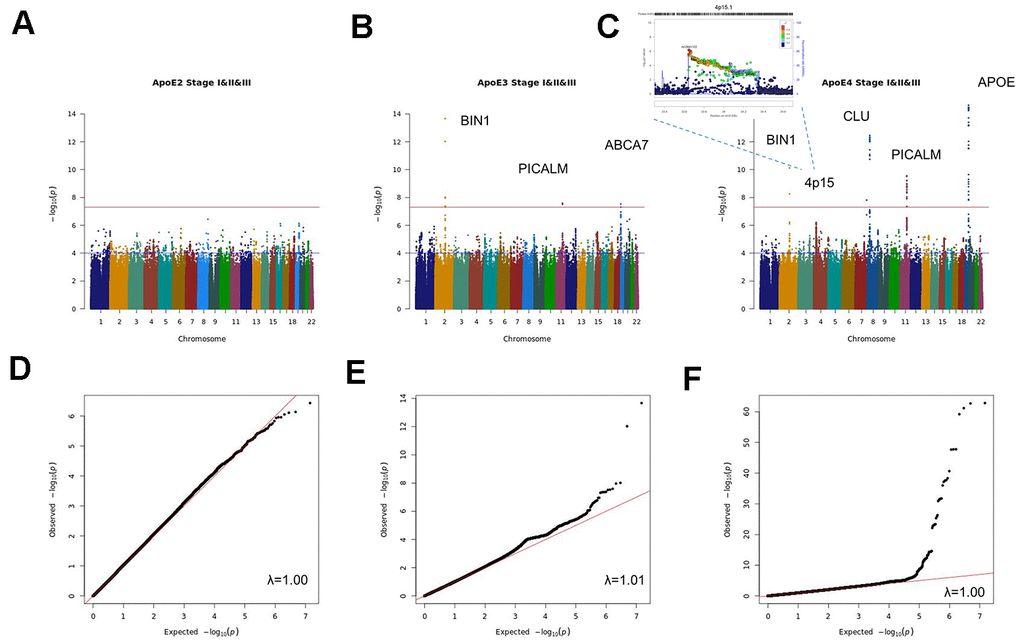
Figure 1. Manhattan and QQ plots of stage I+II+III APOE2 (A, D), APOE3 (B, E) and APOE4 (C, F) stratified meta-analysis.
An additional validation of stage I+II+III findings was performed using the EADI population (stage IV), where only the APOE locus in the APOE4 stratum reached the genome wide significance threshold (Supplementary Figure 4). In the combined analysis of Stage I+II+III and Stage IV results, ABCA7, BIN1 and PICALM in the APOE3 stratum and APOE, BIN1, CLU and PICALM in the APOE4 stratum reached genome-wide significance (Supplementary Tables 4–6 and Supplementary Figure 5).
Sex stratified meta-analysis (Supplementary Tables 7, 8 and Supplementary Figure 6) identified genome-wide significant signals for BIN1 and APOE as well as suggestive signals for PICALM, MYLK, SOX5 and SCEL in the female population. By contrast in males, only suggestive signals for BIN1, APOE, ZCCHC2, the ABI3BP/IMPG2 locus, ESRRB and the 19q13.4 leukocyte receptor cluster were identified. Stratified analysis by sex and APOE (Supplementary Tables 9–14 and Supplementary Figure 7), yielded genome-wide significant signals for APOE in the APOE4 stratum in both sexes and for a 400kb 13q31.3 intergenic region containing the Ubiquitin Specific Peptidase 7 (Herpes Virus-Associated) (USP7) pseudogene (RP11-464I4.1) for APOE3 males. Among APOE4 males, we found association with AD for a large region of 1.9Mb on 3q12.1 comprising the genes CMSS1, COL8A1, FILIP1L, MIR548G, RPL24 and, in females, a 1.5Mb region on 2q33.2 comprising the ABI3 homologue ABI2, CARF, CYP20A1, FAM117B, FZD7, ICA1L, NBEAL1, RAPH1 and WDR12 genes.
GWAS data: gene-level analysis
Genetic marker-level results were summarized into a single measure of association for each gene. Then, association results from the combined stage I, II and III meta-analysis were used to estimate gene-wide statistics for all genes in each one of the three APOE strata (Supplementary Tables 15–17). Per stratum, genes were ranked in ascending order according to lowest to highest p values derived from the mean χ2 statistics implemented in MAGMA (Table 1). Among previously reported AD genes, APOE was the highest ranked in both APOE2 and APOE4 carriers (ranks 26 and 3 respectively), whereas BIN1 was ranked first in the APOE3 stratum (Supplementary Table 18). Known AD genes were ranked worst in the APOE2 stratum than in the others, with the complement receptor 1 (CR1), ranked in position 1292, being the second most relevant of these genes among APOE2 carriers after APOE.
Table 1. GWAS analysis: gene level data (MAGMA results) by APOE stratum.
| Rank E2 | HUGO | NSNPS | NPARAM | ZSTAT | PJoint | PSNPwise (mean) | PSNPwise (top) |
| 1 | RNF152 | 609 | 65 | 4.62 | 1.90E-06 | 4.59E-07 | 4.63E-04 |
| 2 | DUOX2 | 150 | 26 | 3.97 | 3.53E-05 | 4.72E-06 | 5.12E-03 |
| 3 | METRN | 140 | 18 | 3.88 | 5.29E-05 | 2.41E-05 | 9.43E-04 |
| 4 | WDR24 | 197 | 18 | 3.83 | 6.31E-05 | 2.71E-05 | 1.21E-03 |
| 5 | FBXL16 | 196 | 18 | 3.84 | 6.03E-05 | 2.85E-05 | 1.11E-03 |
| 6 | FAM173A | 120 | 17 | 3.83 | 6.29E-05 | 2.99E-05 | 1.14E-03 |
| 7 | JMJD8 | 193 | 18 | 3.79 | 7.59E-05 | 3.34E-05 | 1.32E-03 |
| 8 | CCDC78 | 115 | 17 | 3.81 | 6.99E-05 | 3.68E-05 | 1.14E-03 |
| 9 | DUOXA2 | 145 | 23 | 3.63 | 1.41E-04 | 3.68E-05 | 6.05E-03 |
| 10 | HAGHL | 107 | 15 | 3.83 | 6.43E-05 | 3.88E-05 | 9.08E-04 |
| 11 | NARFL | 105 | 15 | 3.83 | 6.51E-05 | 4.00E-05 | 8.92E-04 |
| 12 | STUB1 | 193 | 18 | 3.72 | 1.01E-04 | 4.61E-05 | 1.56E-03 |
| 13 | ABCB4 | 344 | 35 | 3.89 | 5.11E-05 | 5.27E-05 | 5.59E-03 |
| 14 | APOC1 | 209 | 32 | 3.42 | 3.16E-04 | 5.40E-05 | 4.13E-02 |
| 15 | IRGC | 300 | 45 | 4.55 | 2.72E-06 | 5.52E-05 | 3.36E-05 |
| Rank E3 | HUGO | NSNPS | NPARAM | ZSTAT | PJoint | PSNPwise (mean) | PSNPwise (top) |
| 1 | BIN1 | 633 | 70 | 7.02 | 1.15E-12 | 8.93E-07 | 3.51E-12 |
| 2 | FBN1 | 533 | 41 | 4.71 | 1.27E-06 | 4.82E-06 | 2.76E-04 |
| 3 | WNT3 | 239 | 38 | 4.69 | 1.35E-06 | 6.85E-06 | 1.26E-04 |
| 4 | CLEC4M | 424 | 68 | 4.07 | 2.35E-05 | 1.35E-05 | 1.46E-03 |
| 5 | NSF | 144 | 22 | 4.76 | 9.48E-07 | 2.88E-05 | 3.07E-05 |
| 6 | CASS4 | 349 | 50 | 5.00 | 2.80E-07 | 3.43E-05 | 4.58E-05 |
| 7 | APP | 998 | 99 | 3.96 | 3.75E-05 | 3.91E-05 | 3.43E-03 |
| 8 | GPR27 | 306 | 47 | 3.21 | 6.62E-04 | 4.63E-05 | 6.29E-02 |
| 9 | CRHR1 | 1261 | 23 | 4.07 | 2.39E-05 | 5.46E-05 | 2.55E-03 |
| 10 | CD209 | 482 | 71 | 3.80 | 7.36E-05 | 6.93E-05 | 1.55E-03 |
| 11 | SPPL2C | 556 | 19 | 4.03 | 2.83E-05 | 7.77E-05 | 1.68E-03 |
| 12 | KANSL1 | 978 | 20 | 4.01 | 2.98E-05 | 7.79E-05 | 1.44E-03 |
| 13 | LRRC37A | 115 | 6 | 4.01 | 3.09E-05 | 7.97E-05 | 4.41E-04 |
| 14 | STH | 460 | 17 | 3.94 | 4.00E-05 | 8.35E-05 | 2.88E-03 |
| 15 | EIF4E3 | 516 | 83 | 3.01 | 1.29E-03 | 9.34E-05 | 1.41E-01 |
| Rank E4 | HUGO | NSNPS | NPARAM | ZSTAT | PJoint | PSNPwise (mean) | PSNPwise (top) |
| 1 | TOMM40 | 293 | 44 | 14.90 | 1.59E-50 | 1.50E-26 | 1.00E-50 |
| 2 | APOC1 | 247 | 38 | 15.05 | 1.71E-51 | 3.20E-26 | 1.00E-50 |
| 3 | APOE | 270 | 40 | 14.82 | 5.36E-50 | 2.83E-24 | 1.00E-50 |
| 4 | PVRL2 | 361 | 51 | 14.31 | 8.88E-47 | 1.17E-23 | 1.00E-50 |
| 5 | APOC4 | 241 | 29 | 11.30 | 6.96E-30 | 1.60E-14 | 2.52E-33 |
| 6 | APOC2 | 232 | 27 | 13.20 | 4.31E-40 | 8.54E-13 | 1.00E-50 |
| 7 | CLPTM1 | 267 | 34 | 12.78 | 1.06E-37 | 3.43E-11 | 5.65E-46 |
| 8 | CLU | 351 | 46 | 7.60 | 1.47E-14 | 5.85E-10 | 4.89E-13 |
| 9 | SCARA3 | 426 | 51 | 7.08 | 7.06E-13 | 7.15E-07 | 3.53E-13 |
| 10 | PICALM | 555 | 43 | 5.54 | 1.49E-08 | 8.39E-07 | 9.65E-08 |
| 11 | AKAP2 | 601 | 85 | 4.12 | 1.86E-05 | 2.27E-06 | 5.58E-03 |
| 12 | PALM2-AKAP2 | 1542 | 159 | 3.61 | 1.52E-04 | 3.72E-05 | 1.46E-02 |
| 13 | IL6 | 414 | 48 | 3.72 | 1.01E-04 | 4.36E-05 | 7.17E-03 |
| 14 | EPHX2 | 467 | 56 | 4.23 | 1.15E-05 | 5.26E-05 | 2.17E-04 |
| 15 | BIN1 | 635 | 70 | 5.70 | 5.95E-09 | 5.72E-05 | 1.11E-08 |
Differential expression analysis
Blood APOE stratified DE meta-analysis between AD cases and controls (Supplementary Tables 19–21) included the ADNI and ADDN datasets. In the APOE2 stratum we identified only two upregulated (ISY1 and SRF) and two downregulated (CPT1A, PLCD1) genes below the FDR <0.05 threshold, clearly differing from expression profiles in APOE3 and APOE4 carriers (Figure 2, top 100 genes from each stratum). By contrast, APOE3 and APOE4 stratified analyses identified 1,692 and 3,293 DE genes respectively. Among genes differentially expressed in APOE4 cases versus controls we observed an over-representation of mitochondrial genes, most of them involved in the oxidative phosphorylation pathway. However, several genes from this pathway were differentially expressed in all strata but with opposite expression profiles, such as the electron transport chain genes ATP5F1, UQCRB or NDUFB3 upregulated in APOE2 cases but downregulated in APOE4 cases when compared to controls of the same haplotype. APOE3 genes were mainly cytoplasmatic genes involved in RNA metabolism.
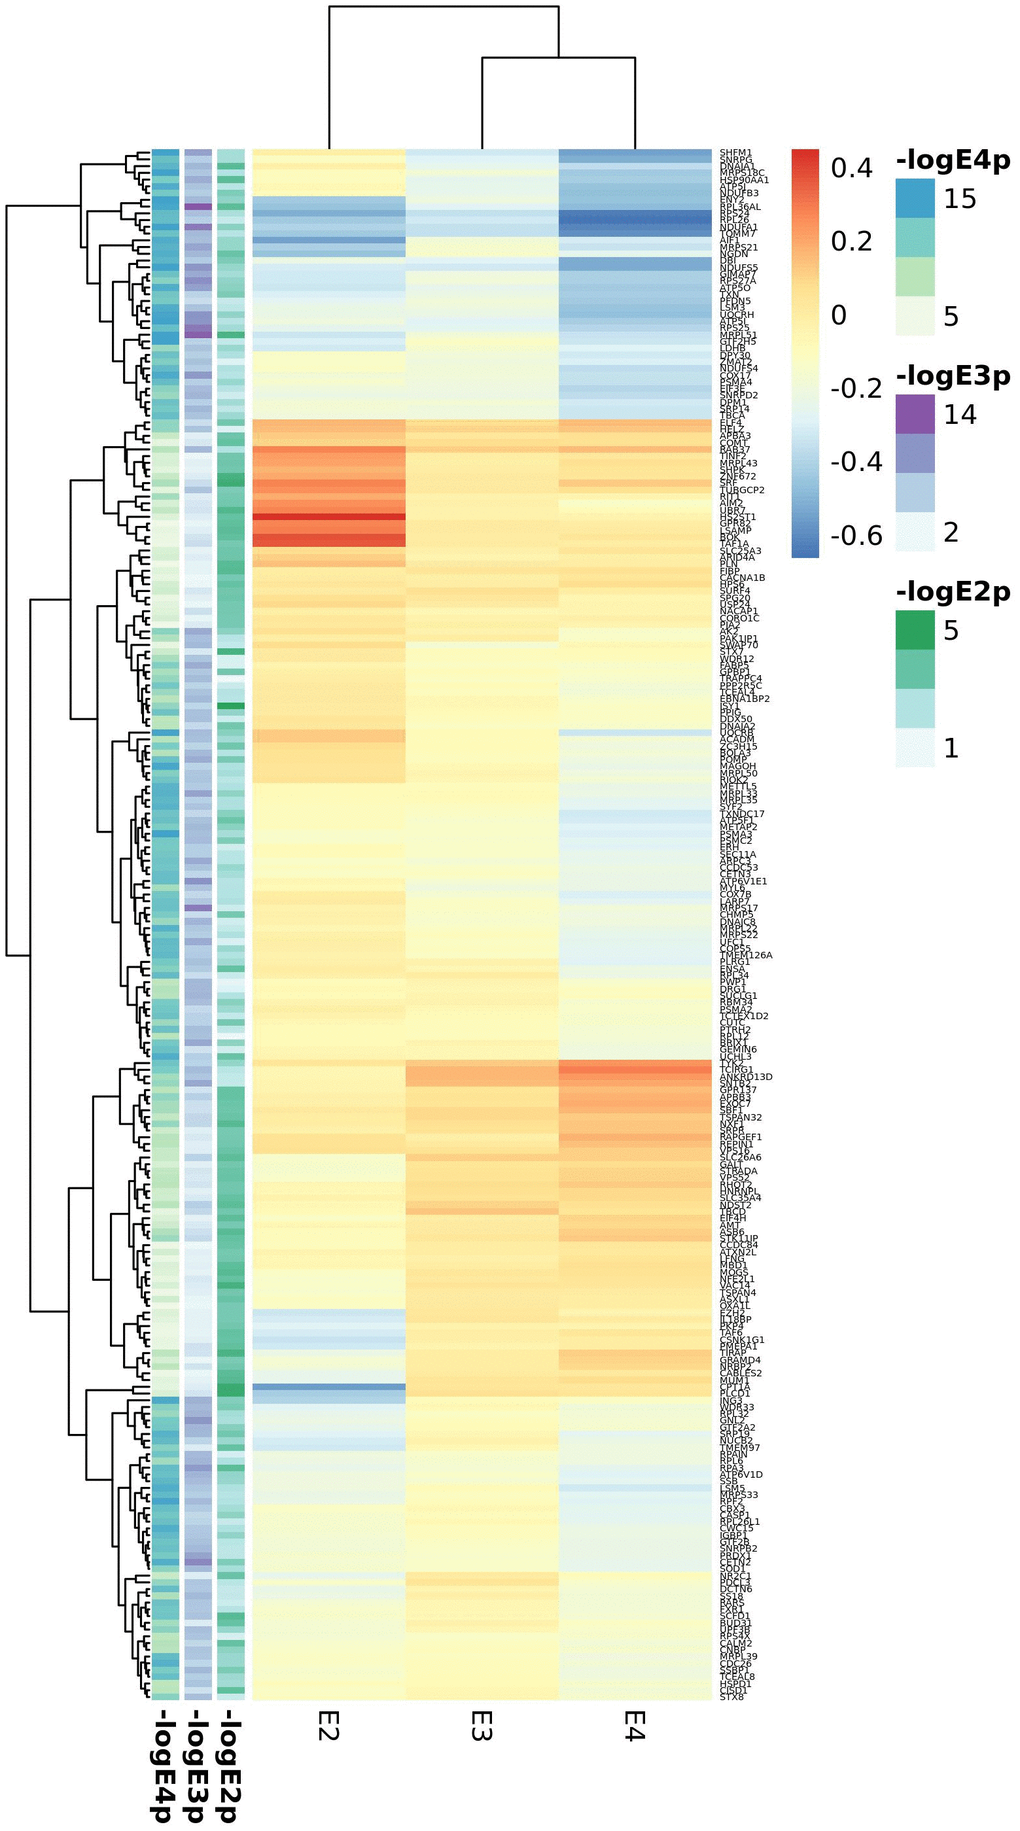
Figure 2. Top candidates from DE analysis in blood datasets.
Cortex APOE-stratified DE included the MAYO, ROSMAP, MSBB, GSE15222 and GSE48350 studies. Meta-analysis of cortex datasets resulted in 518, 7714 and 1717 statistically significant genes (FDR<0.05) for the APOE2, APOE3 and APOE4 strata respectively (Supplementary Tables 22–24). As opposed to blood analyses, the overall picture is of enhanced gene expression in AD in all strata, but more pronounced in APOE2 except for XIST, strongly downregulated in AD APOE2 subjects (Figure 3, top 100 genes from each stratum). The heparan sulfate proteoglycan CD44 and the heparan sulfate lysosomal degradation enzyme IDS encoding genes were differentially expressed in all strata, with CD44 strongly upregulated in APOE2 cases and IDS downregulated in APOE4 cases. APOE2 specific genes were mostly nuclear genes involved in primary metabolic processes, as well as some apoptosis related genes (CFLAR, ATM, MCL1, AKT3 and CTSZ), all of them downregulated in AD cases but CTSZ, with higher expression in AD cases than in controls. APOE3 and APOE4 candidate genes were mainly expressed in the cytoplasm. In all strata, we identified genes involved in neuronal development (such as GFAP, BDNF or CDC42), especially in the APOE3 stratum. For both APOE2 and APOE4 strata, genes involved in vesicle mediated transport were identified, with key genes such as PCSK1, SYTL2 or SVOP downregulated in APOE4 cases.
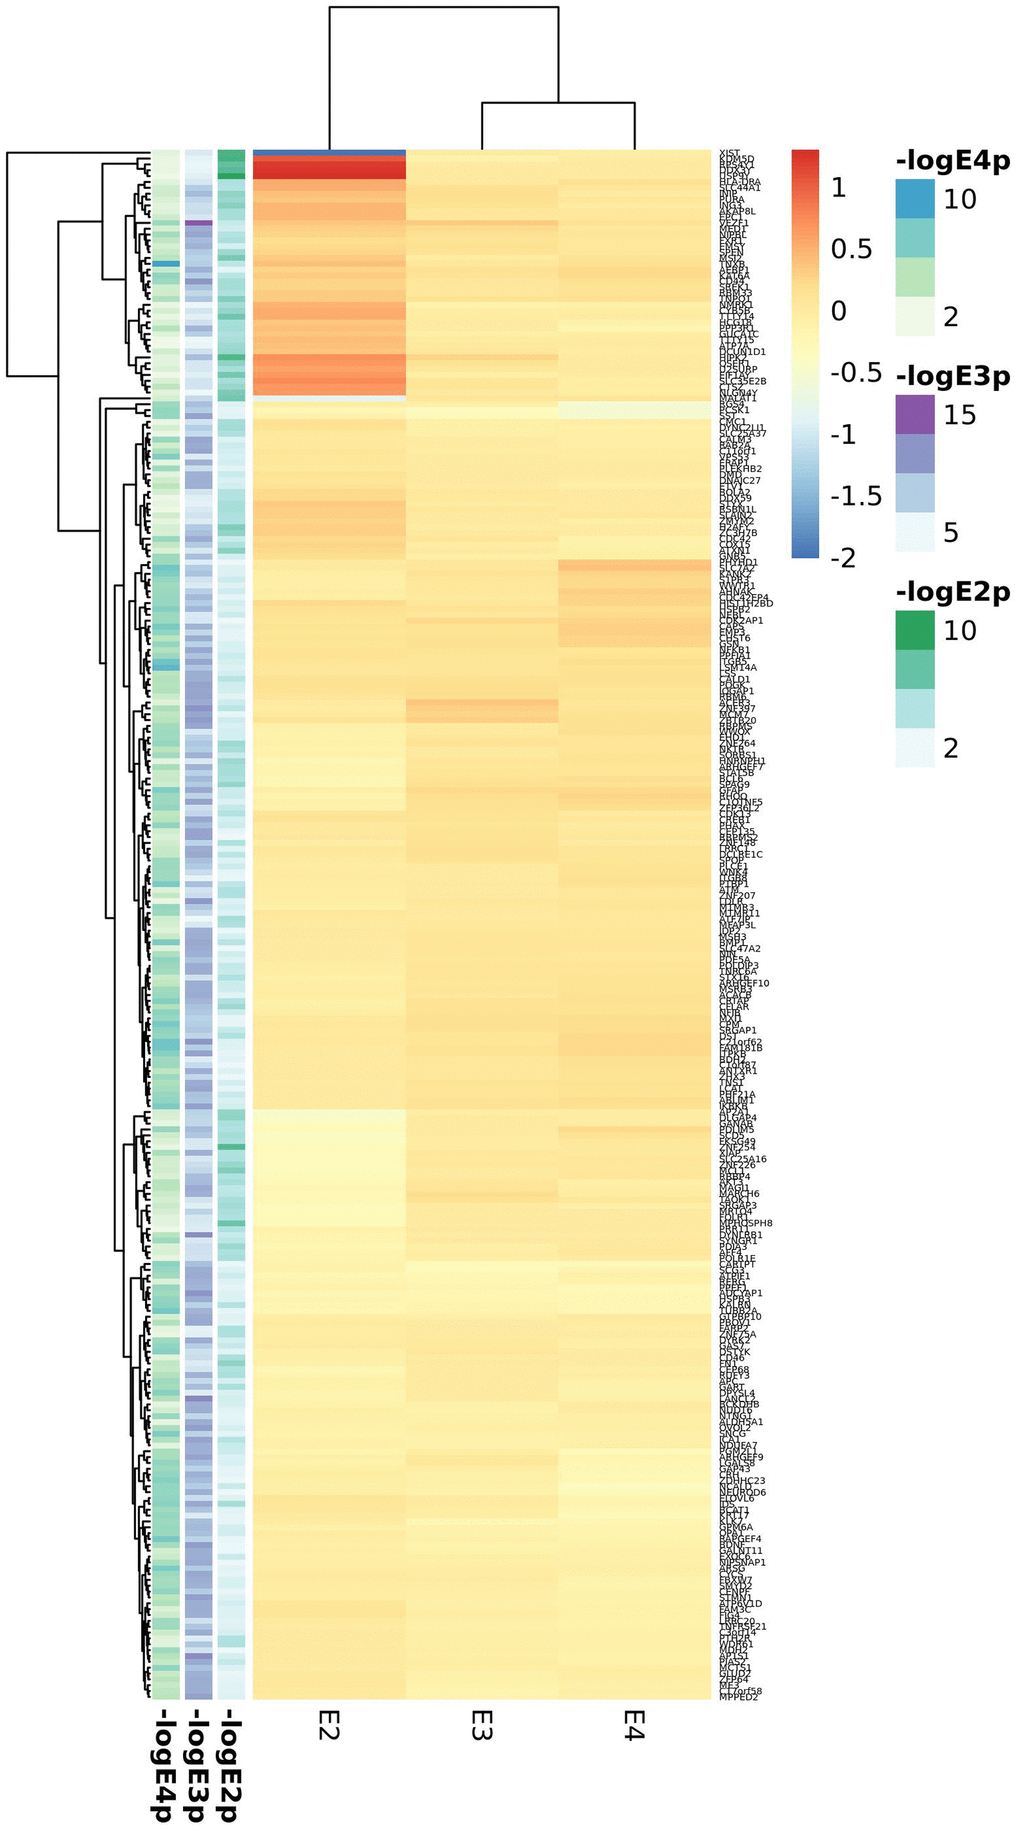
Figure 3. Top candidates from DE analysis in cortex datasets.
Robust rank aggregation analysis
Integrative analysis was performed independently to include either blood or cortex APOE-stratified DE rankings. Thus, we combined meta-GWAS stage I-III gene-level results with blood meta-GWES results (Supplementary Tables 25–27) or with cortex meta-GWES results respectively (Supplementary Tables 28–30).
In blood 275, 284 and 278 genes passed the FDR threshold in the APOE2, APOE3 and APOE4 strata respectively with 15 common genes, associated with AD irrespective of the APOE haplotype, which include APOC1, CLPTM1, DNAJA1, ING3, LARP7, NGDN, RPA3, RPL36AL, RPS24, SOD1, SRP19, and four mitochondrial proteins (ATP5F1, ATP6V1D, MRPL51 and UQCRH). The list of APOE2 specific genes is the largest one (241 genes) and include mitochondrial transporters such as SLC25A3 and SLC25A4. APOE3 specific signatures included MAPT and APP genes, along with other neuronal genes such as the cholinergic receptors CHRNA10 and CHRNA2. APOE4 specific genes included known AD genes involved in vesicle transport such as CLU and SORL1; SORL1 has been shown to regulate IL6 levels, also identified among APOE4 specific signatures. We found however a large overlap among significant genes for the APOE3 and APOE4 strata (n=51) including BIN1, MS4A4A, MS4A6A, PICALM and SLC24A4 AD genes and a good number of ribosomal and electron transport mitochondrial proteins (ATP5I, ATP5O, ATP6V1E1, COX17, MRPL27, MRPL33, MRPL35, MRPS17, MRPS21, UQCRB). APOE2 and APOE3 shared eleven genes (ACADM, AK2, ENSA, GPR132, GPR137, HSP90AA1, MCL1, NXF1, TAF1C, UBA7, ZC3H15) whereas the overlap between E2 and E4 was the smallest with eight proteins (KTN1, NDST2, POLR1D, RHOT2, STK17B, TOMM40, TSPAN32, UCHL3). At the pathway level, we observed a lower overlap between APOE strata, with only three shared mitochondrial GO categories among the three haplotypes, and little or none overlap between APOE2 and APOE3 or APOE2 and APOE4 (Supplementary Tables 31–33 and Supplementary Figure 8). In contrast, there was considerable overlap between APOE3 and APOE4 which includes mitochondria biology, secretory vesicles and antigen processing and presentation functions.
In cortex, we found 376, 399 and 366 significant genes (FDR<0.05) for the APOE2, APOE3 and APOE4 strata respectively. Seven common AD candidate genes (APOC1, APOC2, CD44, CDC42, CLPTM1, DST, PGM2L1) were significant in all three strata; of them, APOC1 and CLPTM1 were also associated in the three strata in blood. In this analysis, the shortest list of APOE-specific genes was found in the APOE4 stratum, which showed the largest overlap with the APOE3 stratum; among the 45 significant genes shared by these strata, we identified several AD genes, including BIN1, MS4A4A, MS4A6A, PICALM and RIN3 in accordance with blood results. The CR1 gene is included among the 19 top genes from the APOE2 and APOE3 strata (ATPIF1, CACNB2, CDC27, CFLAR, COX15, CR1, DCLK1, GOSR2, KANSL1, KLF12, MAPT, MCL1, NSF, POGK, RUFY3, SCD5, SORBS1, SPEN, TTN), whereas APOE, TOMM40, SLC24A4 or WWOX were included among common genes for the APOE2 and APOE4 strata (21 genes: AHNAK, APOE, ARNT, CRTAP, FBXL16, GART, KALRN, KAT6A, MTMR11, OPA1, PDLIM5, PPFIA1, PURA, RBMS2, SLC24A4, SRGAP1, TOMM40, TSPAN14, UBE2F, WWOX, ZNF264). Enrichment analysis also identified both common and exclusive pathways. Common pathways for AD irrespective of the APOE haplotype were related to adhesion, neuronal development, differentiation, and lipoprotein metabolism; diverse signals related to neuronal death are also present in all three strata. Again, we observed larger overlap between APOE3 and APOE4 pathways (glial cell differentiation and activation, immunological, lipid metabolism, cardiovascular system development and heart function) than for APOE2 and APOE3 (which includes axonogenesis) or APOE2 and APOE4 (mainly phospholipid and lipoprotein metabolism due to APOE, APOC1 and APOC2 genes). (Supplementary Tables 34–36 and Supplementary Figure 9). We observed that APOE2 exclusive pathways include chromatin regulation and telomere maintenance related processes. The APOE3 strata showed the largest number of significant enrichments, but most of them showed a similar annotation in APOE2, or, more frequently, in APOE4 strata, with the exception of antigen processing and presentation, IFNG signalling, astrocyte development and activation and myelin sheath. In APOE4 macrophage activation, fructose metabolism, vitamin D mediated inflammation, inositol phosphate metabolism and cholesterol efflux were the most relevant pathways. Clathrin vesicles, amyloid biology, inflammatory and immune response and glial cell development and differentiation appear as the most relevant categories shared by APOE3 and APOE4 strata.
To identify relevant candidate blood biomarkers tracking brain changes in AD pathology we compared blood and cortex analyses (Figure 4). We identified 68 genes in common for the APOE4 stratum, including CLU, CD2AP, IL6, MS4A2, SLC25A1 or INNPP4A (Figure 4C). In APOE3, 76 common genes were found, including APP, AQP9, ATPAF, CD209, LILRA5, NDUFB3 or PTK2B (Figure 4D). Finally, in the APOE2 stratum, we identified 84 common genes including several ABC receptors (ABCA9, ABCB1, ABCB4, ABCD4), solute carrier molecules (SLC25A3, SLC25A4, SLC35E1, SLC9A9), TLR9 or IL4I1 (Figure 4B). Overlap between APOE strata-specific pathways from blood and cortex showed 6 common pathways for APOE2 (Figure 4F), half of them related to chromatin regulation, 24 common pathways for APOE3 (secretion, regulation of supramolecular fiber organization, site of polarized growth and leukocyte activation involved in inflammatory response, Figure 4G) and 18 shared pathways for APOE4, including clathrin coated vesicles, amyloid-beta processing, mitochondrial transmembrane transport, macrophage activation and monosaccharides and fructose metabolism (Figure 4H). We followed up genes with concordant profiles in both blood and cortex (upregulated or downregulated in AD cases vs controls) and showing opposite profiles in APOE2 and APOE4, which included 34 genes with overrepresentation of the gluconeogenesis and fructose metabolic pathways (FBP1, FBP2, SLC25A1) (Figure 5A). When compared with average expression in normal brains, FBP1, FBP2, RHOH, JPH2, ERAp2 and SCLT1 were upregulated in APOE4 cases when they are usually expressed at low levels, whereas, SNX3 and SUB1, were downregulated in APOE4 cases when they are expressed at very high levels in the normal brain according to GTEx (Figure 5B).
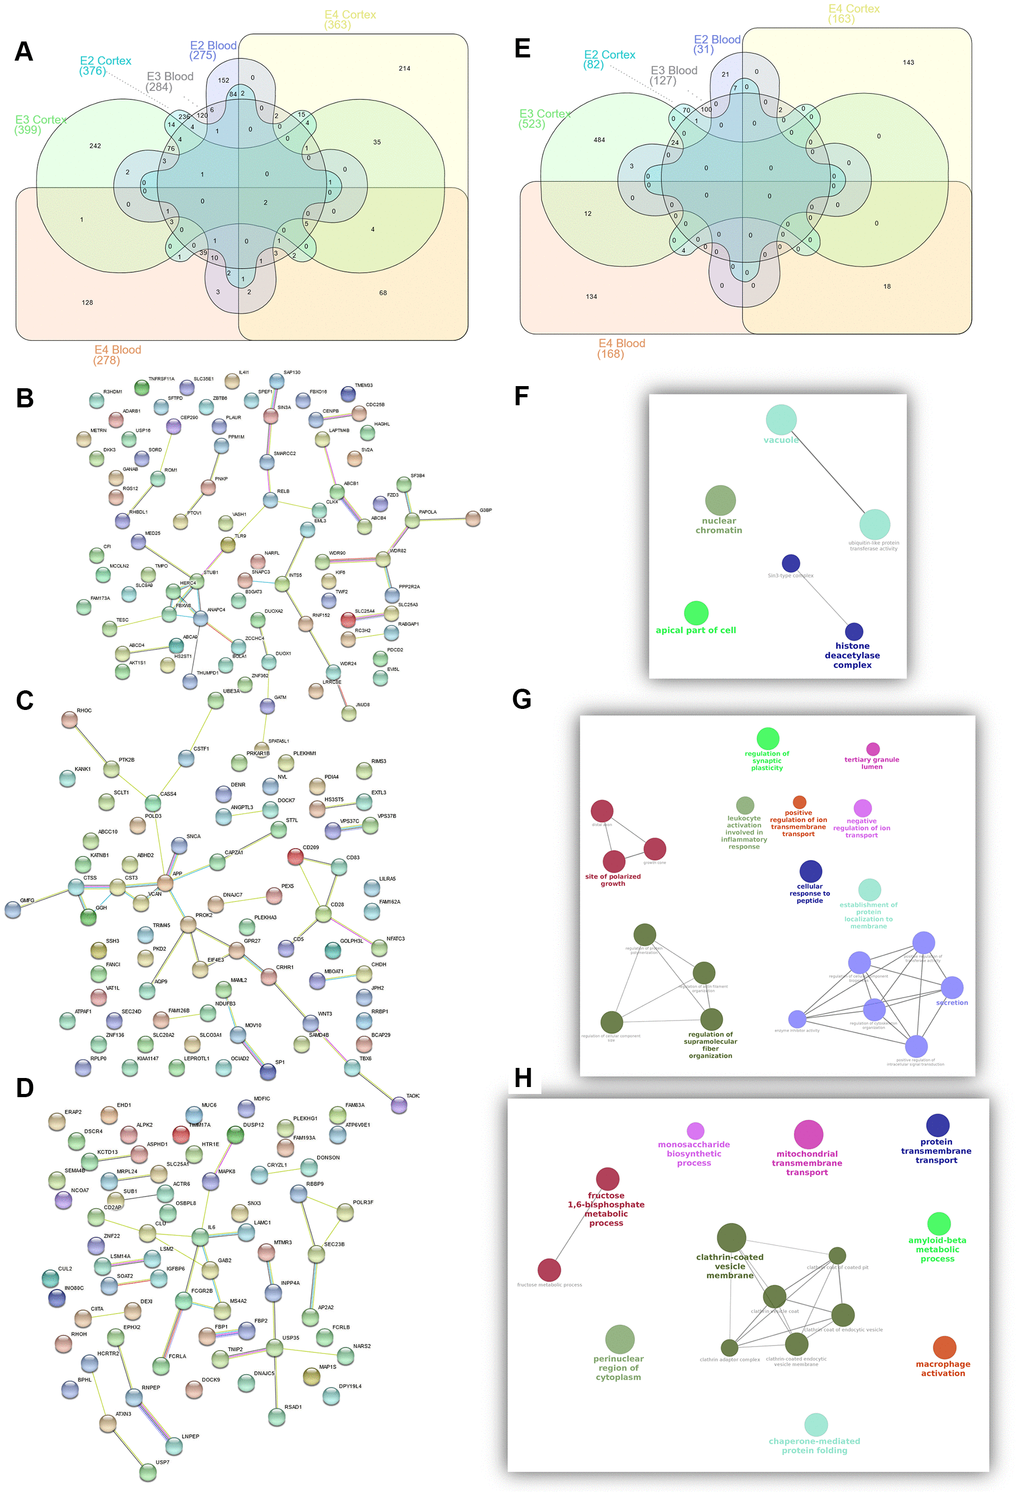
Figure 4. Summary of candidate genes (A–D) and pathways (E–H) from APOE2 (B, F), APOE3 (C, G) and APOE4 (D, H) common candidates from Blood and Cortex RRA analyses.
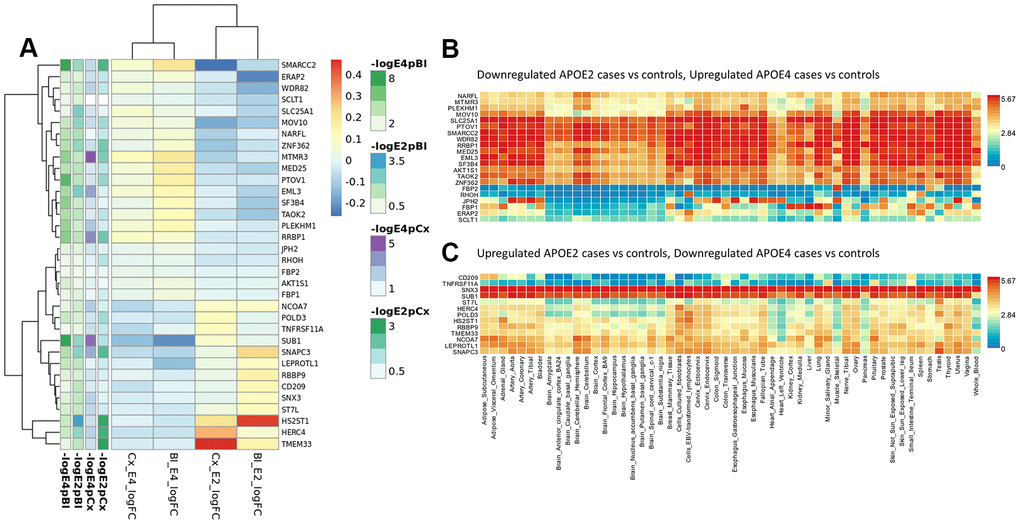
Figure 5. Blood and cortex biomarkers showing opposite profiles in APOE2 and APOE4 strata. (A) Meta-analysis logFCs from case-control DE analysis in blood and cortex (APOE2 and APOE4 strata); (B) average expression of genes downregulated in APOE2 and upregulated in APOE4 cases by normal tissue (GTEx repository); (C) average expression of genes upregulated in APOE2 and downregulated in APOE4 cases by normal tissue (GTEx repository).
Validation on proteomic datasets
We aimed at investigating if any of our candidate genes were detected and differentially expressed at the proteomic level using blood proteomics data from the ADDN study (931 proteins) and cortex proteomics from four independent datasets (BANNER, BLSA, MAYO and MSBB, 2,658 proteins).
Out of 737 RRA blood candidates, only 38 were present in the ADDN blood proteomic data (Supplementary Table 37 and Supplementary Figure 10). Among them, DE analyses between cases with controls, either overall or stratified by APOE haplotype, identified 8 differentially expressed genes in the unstratified analysis, 8 genes in the APOE4 stratum and 9 in the APOE3 stratum. We could confirm APOE allele-specific effects identified in the RRA analysis for the immune related proteins AIF1, METAP2, NCK1, PRDX1, PRKCZ, RPS27A in the APOE3 stratum, and FCGR2B and SEZ6L2 (involved in SNC development) in the APOE4 stratum. Overall, among these 38 RRA candidates, we identified a cluster of 11 overexpressed proteins in AD cases when compared to controls in the APOE3 stratum, but downregulated APOE4 AD cases including AIF1, APP, GDI2, HSP90AA1, METAP2, NACA, NCK1, PRDX1, RPS27A, SFTPD and UFC1 (Supplementary Figure 11); immunological functions associated to these proteins include leukocyte activation (APP, PRDX1, GDI2), Toll-like receptors (TLRs) cascade (APP, RPS27A, SFTPD) or phagocytosis (NCK1, HSP90AA1, SFTPD, AIF1) in line with our RRA findings.
In cortex, 234 out of 1,039 RRA candidates were present in the proteomics DE meta-analysis, 100 of them showing evidences of association (p<0.05) in at least one stratum or in the unstratified analysis (Supplementary Table 38 and Supplementary Figure 12). Of note, the largest differences between cases and controls were observed among APOE4 carriers, confirming at the proteomic level the role of APOE4 RRA candidates involved in neurogenesis (DPYSL4, EHD1, GABRB3, MAPK8, UNC13A), or more specifically, in glial cell differentiation (CLU, GAP43, GFAP, GSN). Among APOE3 candidates, we confirmed candidates involved in neurotransmission such as RPH3A PTK2B, ALDH5A1, GABRA2 and APP (the later upregulated in all strata) and genes from the electron transport chain (ALDH5A1, NDUFA7, NDUFB3). Confirmed APOE2 candidates included the choline transporter SLC44A1, involved in myelin production, and the myelin basic protein MBP; MAPT was upregulated in all strata but particularly in the APOE2 stratum. We also confirmed the role of CDC42 and DST in all the strata, but we did not observe association of CD44 and PGM2L1 with AD in this analysis.
Cell-type-specific expression profiles: cortex snRNAseq
Since the enrichment analysis showed an over-representation of neuronal development related pathways in all strata, and of cells from the glial lineage in the APOE3 and APOE4 strata, we investigated which cerebral cell types our cortex RRA candidates were mainly expressed in, and which cell types showed largest differences between cases and controls using snRNAseq from the ROSMAP study (Figure 6). We dropped pericytes and endothelial cells from the differential expression analysis because of the low number of cells (≈100 cells, <0.3%).
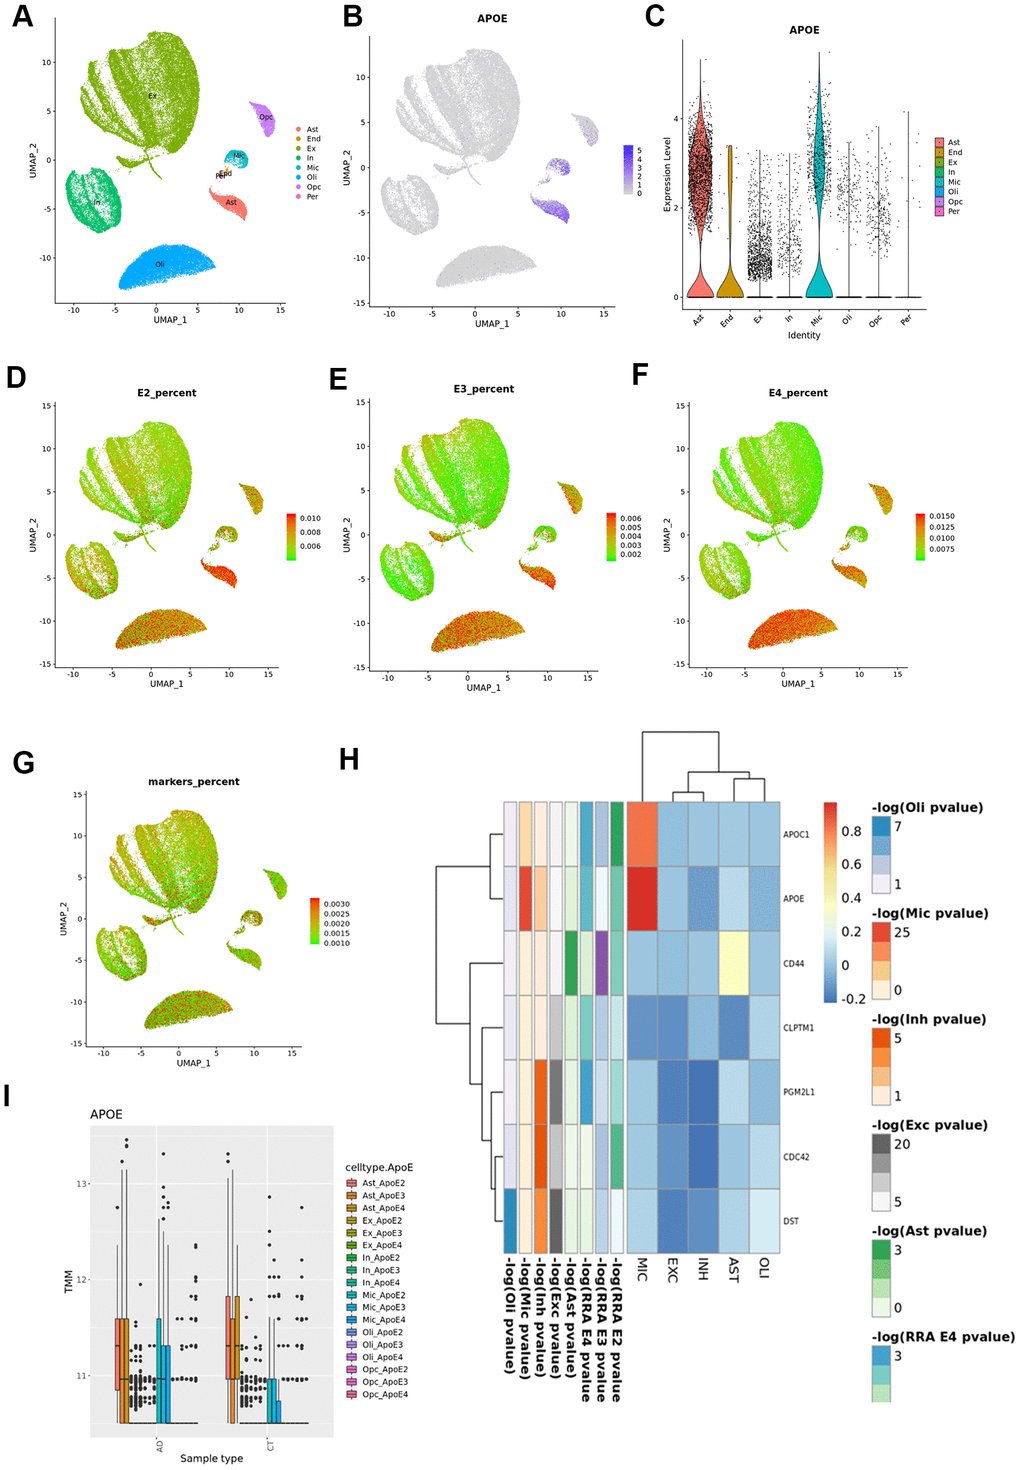
Figure 6. Cortex snRNAseq data from the ROSMAP study. (A) Cell clustering labelled by reported cell type; (B) APOE expression across cell types; (C) violin plot for APOE expression by cell type; (D) UMAP plot for average expression of cortex RRA APOE2 candidates by total gene expression; (E) UMAP plot for average expression of cortex RRA APOE3 candidates by total gene expression; (F) UMAP plot for average expression of cortex RRA APOE4 candidates by total gene expression; (G) UMAP plot for average expression of blood/cortex biomarkers by total gene expression; (H) expression by cell type of the seven genes in common in all the RRA analyses; (I) APOE expression by cell type and case status.
APOE gene was mainly expressed in astrocytes and microglia (Figure 6). According to previous results, APOE is upregulated in microglia from AD subjects when compared with controls (overall and stratified by APOE genotypes). By contrast, in astrocytes we found higher APOE expression levels in cases than controls in the APOE3 stratum (logFC=0.34, p=1.56x10⁻⁴), but significant lower expression in APOE4 cases than in controls (logFC=-0.14, p=1.83x10⁻², pinteraction<10-5).
As reported in the original article [19], most neuronal genes were strongly differently expressed in AD cases versus controls. Furthermore, our analysis found this result was consistent irrespective of the APOE haplotype. Given that glial specific signals arose from APOE3 and APOE4 strata, we therefore primarily focused on RRA cortex candidates showing evidence of association with AD in any glial cell type (astrocytes, microglia, oligodendrocytes and oligodendrocyte precursors) within the same APOE stratum (Figure 6 and Supplementary Table 39 and Supplementary Figures 13–16). In fact, RRA candidates were mainly expressed in the glial lineage, showing a lineal decrease in expression from APOE2 to APOE4 in the astrocyte and microglia populations, and an increase in expression in the oligodendrocyte subpopulation (Figure 6). The seven genes in common in all the RRA analyses, were downregulated in all cell types except for APOE and APOC1 in microglia, and CD44 in astrocytes (Figure 6). In the stratified analysis, these 7 genes were predominantly downregulated in AD APOE3 carriers and upregulated among APOE4 AD cases when compared to controls, particularly APOC1, DST and CD44 (Supplementary Figure 9). By stratum, APOE2 RRA cortex candidates were mostly upregulated in all cell types (Supplementary Figure 10), and in particular FXR1 and DNAJB1, the latter only downregulated in microglia. APOE3 RRA candidates showed the largest differences between cases and controls in microglia cells, where APOC1, ALDOA, RPLP0 and DYNLRB1 were strongly upregulated whereas ARL17B was downregulated in AD cases Supplementary Figure 11). Almost all APOE4 candidate genes were downregulated in both excitatory and inhibitory neurons and upregulated in the glial lineage, particularly TMEM163 and CPM in microglia and GFAP, PLCE1, CLU, CALN1, DLG2 and PDE5A in astrocytes Supplementary Figure 12); we also observed a strong downregulation of the Serine/Threonine Kinase 17b (STK17B), involved in apoptosis and autophagy, in microglial cells of APOE4 cases.
Discussion
The ADAPTED consortium has performed a holistic approach analyzing and integrating diverse data sets from different OMICS technologies, including genomics, transcriptomics (bulk tissue and single cell) and proteomics collected from public repositories and other consortia, resulting in nearly sixty thousand samples analyzed. The novelty of our strategy relies on the use of a stratified approach for the three major APOE haplotypes, and the integration of these signals with a ranked-based algorithm which accommodates different kind of data, resulting in replicated signals at different levels. These signals have been further explored at the single-cell level, pointing to key cellular types for AD. Previous attempts for integrating different OMICS in AD were mainly focused on the identification of quantitative trait loci (QTLs) for mRNA levels, protein levels or epigenomic signatures by means of association analyses [20–23], in some cases stratified by APOE allele [24]. Other approaches involved the independent analysis of the different OMICS and selection of concordant genes [25] or the combination of human GWAS data with mouse transcriptomics [26]. Potential limitations of our study include reduced sample size in some of the datasets, especially for the APOE2 stratum, and the use of unsigned methods (i.e. irrespective of the directionality of the expression profiles) for selecting candidate genes in expression datasets.
At the genome level, we were able to detect genome-wide significant signals for ABCA7, BIN1 and PICALM in the APOE3 stratum and for APOE, BIN1, CLU and PICALM in the APOE4 stratum. We identified a novel candidate region for APOE4 carriers on 4p15.1 (33.6Mb-34.3Mb), which, according to the GWAS catalogue (https://www.ebi.ac.uk/gwas/) has not been previously associated with AD, but with schizophrenia, total cholesterol change in response to fenofibrate in statin-treated type 2 diabetes, and PCSK9 levels, a protease that binds to lipoprotein receptors promoting their degradation; a homozygous deletion overlapping this region has been described for the offspring of a consanguineous marriage between first cousins, with cognitive impairment and autistic-like behavior [27]. Sex-stratified analysis identified genome wide significant signals for APOE and BIN1 only in females; this result is in agreement with the recent report from Fan et al., who described a genome-wide significant association for BIN1 only in females [28]. Further stratification of male and female populations by APOE haplotype identified a genome-wide significant intergenic region on 13q31.3 among APOE3 males. This region has been associated with TREM2 levels, circulating Interleukin-1-receptor antagonist levels and triglyceride change in response to fenofibrate in statin-treated type 2 diabetes. This region harbors a USP7 pseudogene (RP11-464I4.1) associated with herpesvirus. Interestingly, a potential role of herpes simplex virus infection in AD has recently been object of intense debate [29]. Despite the number of GWAS datasets collected, our study is still underpowered for detecting genuine APOE strata-specific signals with low effect sizes, but resulting gene-level statistics were instrumental to select those DE signals that better correlate with the disease at genetic level. This helps maximize high probable loci involved in the fundamental pathways involved in disease pathogenesis.
The genome-wide expression analysis was performed at two levels: blood and brain cortex. In blood, mitochondrial ribosomal genes and as well as those encoding proteins of the respiratory chain appeared downregulated in cases irrespectively of the APOE haplotype, but more pronounced among APOE4 carriers. Mitochondria are crucial players of energy metabolism but are also the main source of Reactive Oxygen Species (ROS). Mitochondrial dysfunction has been proposed as the primary process triggering all the cascade of events that lead to sporadic late-onset AD. Although this hypothesis has not been confirmed, diverse mitochondrial functions were observed altered in AD and even MCI subjects, showing a significant increase of oxidative stress markers, such as lipid peroxidation and protein oxidation products [30–32]. We did not observe mitochondrial signatures at the whole cortex level, mostly enriched in activated genes from neuronal, apoptosis, vesicle mediated transport and adhesion related pathways, maybe because mitochondrial dysfunction has been reported to be limited to certain hippocampal and temporal cortex neurons [33, 34].
Integration of genome data with expression data at blood and cortex levels through the RRA algorithm, showed a larger overlap of genes and functions in APOE3 and APOE4 carriers than in APOE2 carriers, which appears as a more distinct entity. In fact, we identified signatures for chromatin remodeling and regulation in this stratum at both brain and plasma levels, not observed in the other two strata. Common features of the disease to all three strata are related to lipid metabolism due to APOE (except for the APOE3 carriers), APOC1 and APOC2. A recent report has suggested that APOC1 gene, located in the APOE locus, is an independent risk factor for AD, and that genetic variability in the region is associated with chromatin regulation [35].
AD cases in APOE3 and APOE4 share signaling pathways and functional categories previously reported by other groups such as amyloid-beta formation (APOE, BIN1, CLU, PICALM) mitochondrial physiology (including ATP5H, NDUFS5, MRP proteins, SNCA, SOD1, SSBP1, SUCLG1 or UQCRH), vesicle mediated transport (including APOC1, APP, BIN1, C1QTNF5, CASS4, CDC42, LDLR, MAPT, PICALM or PTK2B), actin organization (ACTN1, ACTR2, AIF1, ANTXR1, CALD1, CAPZ1, CD2AP, DST, ITGB5, MACF1, MAPT, PALLD, RHOC …) or immunological functions (CCL5, CD209, CD44, CR1, IL6, LILRA5 or MS4A2 among others), but with specific gene signature (for example IL6 in the APOE4 stratum or CD209 in the APOE3 stratum). IL6 plays a critical role in inflammation as well as in neuroprotection through two different mechanisms. Anti-inflammatory effects are mediated by the classical signaling pathways, which involves the binding of IL6 to the membrane bound IL6 receptor (IL6R), whereas proinflammatory effects are mediated by soluble IL6R forms. Classical signaling occurs in microglia whereas trans-signaling is predominant in most neuronal types, astrocytes and oligodendrocytes [36]. Cross-talk between TREM2, CD33 and IL6 (among other ILs) regulating phagocytic capacity, a hallmark of AD among APOE4 carriers according to our results, has been reported in microglia cells [37]. Interestingly, IL6 is degraded by SORL1, encoded by another well-known AD gene [38]. CD209 is mainly expressed on the surface of dendritic cells, specialized antigen-presenting cells, where regulates DC adhesion, migration and triggering of immune response [39]. In conclusion, our results suggest that APOE-allele specific immunological checkpoints may exist in AD.
Although we have identified signatures of the nervous system development in all strata, they represent a largest proportion of relevant pathways in the APOE3 stratum. In this stratum, enrichment analysis of RRA cortex candidates showed an over-representation of genes involved in cardiac development and function (DLG1, JPH2 or MEF2C among others), supporting a cardiovascular etiology of dementia in this stratum. In line with this finding, we have recently reported a link between cardiac function and AD, that is mediated, at least in part, by CFLAR and caspase dependent mechanisms [40]. In fact, CFLAR and CASP8 are both RRA cortex candidates in this stratum. Another example of the nervous-cardiac connection is GFAP, which participates in the control of heart rate and vascular resistance through the sympathetic nervous system (SNS), which controls heart rate and vascular resistance. We have observed an upregulation of GFAP protein in cortex of all AD cases irrespective of the APOE carrier status. Macrophage activation and Fc gamma receptor mediated phagocytosis appeared as the most exclusive pathways in the APOE4 stratum. Phagocytosis (i.e. the engulfment and digestion of cellular debris) is critical for the degradation of infectious agents and senescent cells, playing a key role in tissue remodeling, immune response, and inflammation. Several Fc receptors (FcRs, FCGR2B, FCRLA and FCRLB) and downstream effectors receptor such as CDC42, RHOH, RHOQ and RHOT2, GTPases that regulate actin cytoskeleton, have been identified as APOE4 RRA candidates. While FcRs are constitutively active for phagocytosis, the complement receptor (CR)-mediated phagocytosis is activated in presence of additional stimuli. An additional difference between FcR- and CR-mediated phagocytosis is that he former have a higher capacity for triggering the release of inflammatory mediators [41]. In fact, an enhanced release of inflammatory molecules such as IL-6, an APOE4 RRA candidate, IL1β or TNFα has been observed in blood among APOE4 carriers [42, 43] and in blood and brain humanized APOE4 mice models [44–46] has been observed. In this study, we found that CR-related mechanisms were more relevant in APOE2 and APOE3 carriers, with CR1 and ATP5F1 as RRA candidates in both strata.
Macrophages are also involved in the development of atherosclerotic plaques through the intracellular accumulation of lipids and the formation of foam cells, a process counterbalanced by cholesterol efflux, a mechanism identified as an APOE4 specific feature in our study. A key protein in this process seems to be AIF1, a pro-inflammatory molecule expressed primarily in the monocyte/macrophage lineage, which was shown to be downregulated in APOE4 cases and upregulated in plasma samples of APOE3 cases in this study. A1F1 was originally cloned from a rat heart allograft under chronic rejection, and it is involved in several inflammatory conditions including atherosclerosis. Crossbreeding experiments A1F1 and APOE transgenic mice have shown an interaction between these genes leading to atherosclerotic vasculopathy though modulation of the incorporation of degenerated LDL by macrophages [47, 48].
In brain, the resident macrophages, microglia cells, are the specialized phagocytic cells acting through a complement dependent mechanism coupled to ATP production. The analysis of single cell cortex data points to a pivotal role of the glial lineage in the development of AD in accordance with RRA results and current knowledge. Beyond astrocytes and microglia, the main cell types in which APOE is expressed, oligodendrocytes and oligodendrocyte precursors (OPCs) also play a role; interestingly, it has been suggested that astrocytes and oligodendrocytes could also participate in phagocytosis in the brain [49]. But the main role of oligodendrocytes is the production of myelin in the central nervous system, a cholesterol dependent mechanism; oligodendrocytes are continuously generated in the healthy adult brain, being the formation of new myelinating oligodendrocytes during adult life an important mechanism for neuroplasticity [50]. Astrocytes were shown to facilitate all steps of myelination, promoting OPC proliferation through PDGF and FGF2, or inhibiting the differentiation of OPCs into myelin-forming cells through the CD44 receptor. Furthermore, CD44 is a top candidate from cortex RRA analysis upregulated in astrocytic cells of AD cases of all APOE strata, particularly in APOE4, while downregulated in the other cell types including OPCs, illustrating the complexity of AD related mechanism at the cellular level. Myeloid basic protein encoding gene (MBP) is one of the top RRA candidates from the APOE2 stratum, also reinforcing the relevance of myelination in AD in agreement with recent research in the field [51, 52]. In fact, evidence from multiple sclerosis- lesions suggests that Fc receptors and complement have relevant roles in myelin phagocytosis, while in-vitro blockade of Fc or CRs reduced myelin phagocytosis [53].
In summary, through the integration of multi-OMICS datasets we have identified both common and APOE specific signatures of AD. The ADAPTED consortium has generated isogenic hiPSC derived macrophages, neurons, astrocytes, and microglia carrying the different APOE haplotypes to further explore presented findings in human samples, in a cell-type specific manner. This will support the further elucidation of APOE dependent pathways that drive the AD risk and potentially support developing a therapy for AD patients.
Materials and Methods
Table 2 summarizes the datasets and number of individuals by APOE stratum included at each analysis stage (total number of processed samples: 50,737). A flow chart of the analyses performed in this report is shown in Figure 7. Additional information about study datasets is provided as Supplementary Note.
Table 2. Study datasets.
| ApoE2 | ApoE3 | ApoE4 | ||||||
| Controls | Cases | Controls | Cases | Controls | Cases | |||
| GWAS Stage I | ||||||||
| ADGC | 191 | 113 | 810 | 1070 | 329 | 2063 | ||
| ADDN | 22 | 10 | 126 | 104 | 50 | 140 | ||
| ADNI | 40 | 10 | 161 | 153 | 67 | 303 | ||
| GNADA | 92 | 35 | 487 | 252 | 164 | 467 | ||
| NXC | 78 | 21 | 510 | 150 | 128 | 150 | ||
| MAYO | 147 | 24 | 657 | 233 | 286 | 478 | ||
| NIA | 68 | 9 | 353 | 94 | 374 | 297 | ||
| ROSMAP | 51 | 62 | 153 | 353 | 23 | 200 | ||
| TGEN | 71 | 25 | 281 | 261 | 89 | 420 | ||
| Total Stage I | 760 | 309 | 3538 | 2670 | 1510 | 4518 | ||
| GWAS Stage II | ||||||||
| FACE | 330 | 123 | 2220 | 1314 | 639 | 1115 | ||
| GERAD | 780 | 145 | 3572 | 1090 | 1574 | 1634 | ||
| Total Stage II | 1110 | 268 | 5792 | 2404 | 2213 | 2749 | ||
| GWAS Stage III | ||||||||
| ARIC | 1001 | 144 | 4479 | 688 | 1666 | 567 | ||
| CHS | 243 | 44 | 1058 | 240 | 302 | 133 | ||
| FHS | 474 | 27 | 2346 | 180 | 687 | 88 | ||
| RS | 667 | 102 | 2770 | 548 | 1001 | 435 | ||
| Total Stage III | 2385 | 317 | 10653 | 1656 | 3656 | 1223 | ||
| GWAS Stage IV | ||||||||
| EADI | 819 | 124 | 4317 | 993 | 1188 | 1135 | ||
| Total Stage IV | 819 | 124 | 4317 | 993 | 1188 | 1135 | ||
| TOTAL GWAS | 5074 | 1018 | 24300 | 7723 | 8567 | 9625 | ||
| Blood GWES | ||||||||
| ADDN | 14 | 11 | 92 | 79 | 37 | 107 | ||
| ADNI | 27 | 3 | 118 | 71 | 48 | 127 | ||
| TOTAL Blood GWES | 41 | 14 | 210 | 150 | 85 | 234 | ||
| Cortex GWES | ||||||||
| MAYO (TCX) | 27 | 5 | 112 | 71 | 43 | 118 | ||
| ROSMAP (DLPFC) | 28 | 26 | 85 | 147 | 13 | 92 | ||
| MSBB FP | 2 | 1 | 10 | 16 | 3 | 18 | ||
| MSBB OVC | 1 | 3 | 8 | 16 | 4 | 7 | ||
| MSBB DLPF | 2 | 0 | 9 | 12 | 5 | 16 | ||
| MSBB PCG | 0 | 3 | 5 | 14 | 0 | 14 | ||
| MSBB PFC | 1 | 1 | 9 | 15 | 1 | 17 | ||
| GSE15222 | 26 | 3 | 114 | 48 | 37 | 108 | ||
| GSE48350 SFG | 9 | 1 | 23 | 8 | 16 | 10 | ||
| GSE48350 EC | 8 | 1 | 16 | 5 | 15 | 8 | ||
| GSE48350 PG | 10 | 1 | 21 | 8 | 13 | 14 | ||
| TOTAL Cortex GWES | 114 | 45 | 412 | 360 | 150 | 422 | ||
| Blood Proteomics | ||||||||
| ADDN | 12 | 10 | 46 | 76 | 28 | 110 | ||
| TOTAL Blood Proteomics | 12 | 10 | 46 | 76 | 28 | 110 | ||
| Brain proteomics | ||||||||
| BANNER | 6 | 6 | 29 | 35 | 6 | 57 | ||
| BLSA | 5 | 3 | 7 | 10 | 1 | 7 | ||
| MAYO | 3 | 4 | 23 | 37 | 4 | 43 | ||
| MSBB | 6 | 10 | 15 | 88 | 7 | 44 | ||
| TOTAL Cortex Proteomics | 20 | 23 | 74 | 170 | 18 | 151 | ||
| Brain snRNAseq | ||||||||
| ROSMAP | 4 | 2 | 7 | 7 | 2 | 9 | ||
| Total snRNAseq | 4 | 2 | 7 | 7 | 2 | 9 | ||
| TOTAL | 5265 | 1112 | 25049 | 8486 | 8850 | 10551 | ||
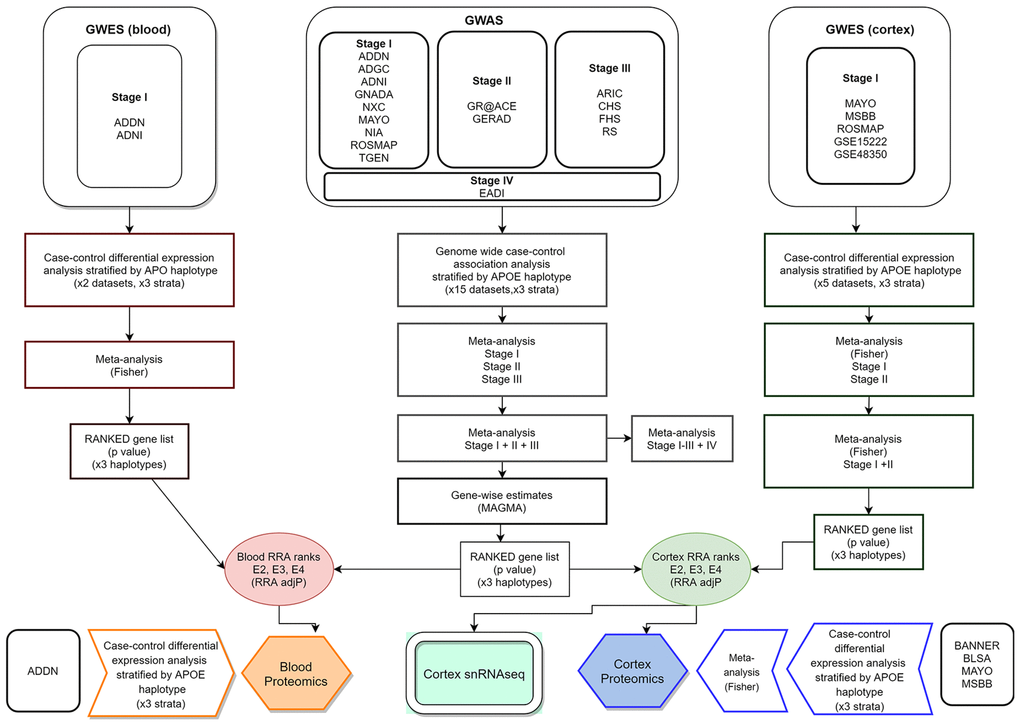
Figure 7. Integrative analysis workflow.
GWAS data
Study cohorts
Stage I GWAS meta-analysis comprised 13,305 subjects from nine datasets, including the Alzheimer's Disease Neuroimaging Initiative (ADNI), the AddNeuroMed study, the Alzheimer’s Disease Genetics Consortium (ADGC), the Multi-Site Collaborative Study for Genotype-Phenotype Associations in Alzheimer’s Disease (GenADA), the Mayo Clinic Alzheimer's Disease Genetic Study, the Neocodex-Murcia study, the National Institute on Aging (NIA) - Late Onset Alzheimer's Disease Family Study, the Religious Orders Study and the Rush Memory and Aging Project (ROSMAP) study and the TGEN study. Stage II meta-analysis (N=14,536 individuals) included the Genome Research at Fundació ACE (GR@ACE) study stage I and the Genetic and Environmental Risk in Alzheimer’s Disease (GERAD) study. The Cohorts for Heart and Ageing Research in Genomic Epidemiology (CHARGE) consortium contributed the Atherosclerosis Risk in Communities (ARIC) study, Cardiovascular Heart Study (CHS), the Framingham study (FS) and the Rotterdam study (RS) for Stage III GWAS meta-analysis (N=11,345 subjects). Additional validation (stage IV) of stage I-III meta-analysis was performed on the European Alzheimer’s Disease Initiative (EADI) dataset (N=8,576 samples). Estimated power for the stage I+II+III meta-analysis was 65.9%, 99.9% and 99.8% for a SNP with MAF=0.2 and OR=1.2 in the E2, E3 and E4 strata respectively, dropping to 28.3%,86.5% and 76.4% for a variant showing MAF=0.2 and OR=1.1.
Whenever possible, clinical information was reviewed to exclude: i) cases not classified as confirmed or probable AD ii) controls with amyloid pathology or history of altered cognition tests.
Quality control (QC) and imputation
A standard QC was applied to all datasets, including removal of individuals with more than 3% missing genotypes, with excess autosomal heterozygosity (>0.35 or more than 3 standard deviations (SD) from population mean), those showing a discrepancy between genotypic and reported sex, as well as individuals of non-European ancestry based on SMARTPCA principal component (PC) analyses (exclusion of subjects more than 6 SDs away from the population mean) [54]. Duplicated and related individuals were identified and removed by means of IBS estimates (IBS>0.1875) both within and across studies. At the genotype level, we removed SNPs with missing genotype rate > 5%, not in Hardy-Weinberg equilibrium (HWE) (p<10-6 in controls) and SNPs with minor allele frequency (MAF) < 1%. When necessary, datasets were updated to genome build GRCh37/hg19.
Genotype imputation was performed at the University of Michigan server using the minimac3 algorithm and the SHAPEIT tool for haplotype phasing with the Haplotype Reference Consortium (HRC) cohort as reference panel [55]. After imputation, only SNPs with an R2 quality estimate higher than 0.3 and MAF >1% were kept for association analysis.
APOE stratified association analysis
Association analysis was performed within each dataset in three independent groups: ε2 stratum (including subjects with APOE genotypes ε2/ε2 and ε2/ε3), ε3 stratum (ε3/ε3 individuals) and ε4 stratum (ε3/ε4 and ε4/ ε4 carriers). The ε2/ε4 genotype was excluded because of the combination of both the protective and deleterious alleles. Association of genotype dosages with the AD case-control status was explored through regression models adjusted by age, sex and the first four PC vectors as covariates using PLINK software [56].
Sex and APOE stratified association analysis
We also explored the effect of both APOE and sex on susceptibility to AD using two approaches. We first performed a sex stratified analysis using logistic regression models adjusted by age, the first four PC vectors and APOE genotype as a quantitative trait, assigning each allele E2 a value of -1, each E3 allele a value of 0 and each E4 allele a value of +1 (full range: from -2 to 2). Additionally, we performed an association analysis stratified by both APOE and sex. For these analyses, eight datasets from Stage I (ADDN, ADGC, ADNI, GNADA, MAYO, NIA, NXC, ROSMAP, N=12,158 individuals) and Stage II (GR@ACE, 5,741 subjects) were used.
Meta-analysis (meta-GWAS)
Within each stage and stratum, association results were combined by meta-analysis using the inverse variance method implemented in METAL [57] or PLINK software programs. SNPs with MAF >1% that were available in at least 60% of the datasets at each stage were included in the meta-analysis. Genomic inflation lambda (λ) was calculated using the GenABEL package [58]. Manhattans and QQ plots were generated with the qqman R package [59].
Gene-level analysis
Gene level analysis was performed using MAGMA software, which compute gene-wise statistics taking into account physical distance and linkage disequilibrium (LD) between markers [60]. All SNPs with MAF above 5% were used in these analyses, setting a distance threshold of 50kb. At each stratum, genes were ranked according to the global p mean value.
Genome-wide expression analysis (GWES) and meta-analysis
Study cohorts
Whole blood expression profiles for meta-analysis were obtained from ADNI and AddNeuroMed studies (N=734). The cortex gene-expression meta-analysis included Mount Sinai Brain Bank (MSBB) dataset (frontal pole, occipital visual cortex, dorsolateral prefrontal cortex, precentral gyrus, prefrontal cortex), ROSMAP (dorsolateral prefrontal cortex) and MAYO (temporal cortex) studies and GSE15222 [61] and GSE48350 [62] (entorhinal cortex, superior frontal cortex, post-central gyrus) datasets from the GEO repository (N=1,503).
QC
For these analyses, we used background corrected and normalized intensity values from expression microarrays distributed by the dataset providers, except for GSE48350. For this GEO dataset, raw. CEL files we downloaded and processed using the Robust Multi-array Average (RMA) algorithm integrated in the affy R package for background correction and normalization [63]. Diagnostic plots included Residuals vs Fitted, Residual vs Leverage, Scale Location, PCA and QQ plots; outlier values identified in these analyses were disregarded. For those datasets provided in different experimental batches, the ComBat function from the sva R package [64] was used to minimize batch effects. A multivariate regression model was fitted to adjust intensity values for covariates, including pH, post-mortem interval (PMI), RNA integrity numbers (RIN), age of death, sex, race and use of lipid lowering medication when available.
Differential expression analysis
As for GWAS data, differential expression (DE) analysis between cases and controls was performed independently in the three APOE subgroups using R package limma [65] by dataset and brain region when available. Limma results were adjusted for multiple testing using the Benjamin and Hochberg’s (BH) method. Volcano plots and heatmaps were produced to assess these results. Probes were annotated to gene symbols using appropriate specific libraries, keeping the most differentially expressed mRNA isoform for those genes showing alternative splicing.
Differential expression meta-analysis (meta-GWES)
Independent APOE stratified meta-analyses were performed for combining DE results from the different datasets into single ranked gene lists for both blood and cortex. For cortex, only genes present in at least a 70% of the datasets were considered for meta-analysis. Individual logFCs were combined using the Random Effect Model (REM). Given that the analysis included data from different brain regions, genes were ranked according to the Fisher statistics to avoid making assumptions about the directionality of the effect, aimed at identifying candidate markers differentially expressed in the “majority” of studies, where Fisher methods has been described to outperform other methods in terms of power detection, biological association, stability and robustness [66]. All the analyses were performed with the metaDE R tool. Heatmap graphs were generated with the Pheatmap R package.
Integrative analysis
In order to obtain per-gene single estimates GWAS and GWES data were combined using the Robust Rank Aggregation (RRA) method [67]. The algorithm, integrated in the RobustRankAggreg R package, uses a probabilistic model for aggregation that is robust to noise and also facilitates the calculation of significance probabilities for all the elements in the final ranking. Two independent runs of the RRA algorithm were performed. In all of them we combined stage I+II+III GWAS meta-analysis plus blood or cortex GWES metanalyses (Figure 7). Final gene ranks for blood and cortex were generated according to ascending order of the exact p values generated by the RRA algorithm.
Proteomic data analysis
Proteomic data from blood (ADDN study) and brain (BANNER, BLSA, MAYO and MSBB studies) were collected. Histograms and boxplots were generated to assess the distribution of normalized intensity protein expression values distributed by data providers. Differential protein expression analyses by study and APOE stratum were performed using limma, with PMI, age, sex and, when available, lipid lowering medication as covariates. Meta-analysis of the diverse brain datasets was performed as described for GWES datasets.
Single nuclei RNAseq (snRNAseq) data analysis
Additionally, we explored snRNAseq cortex data from the ROSMAP study [19]. Count matrix provided by ROSMAP study was processed using Seurat package [68]. After QC (filtering out cells that have unique feature counts over 2,500 or less than 200 and cells with >5% mitochondrial counts), data were normalized and scaled. Prior to clustering the cells, we applied the Uniform Manifold Approximation and Projection (UMAP) dimensional reduction technique. Finally, a differential expression analysis between AD cases and controls was performed by each cell type using the edgeR package [69].
Enrichment analysis
Enrichment analysis of RRA results was performed using four different tools: WebGestaltR [70, 71], FUMA [72] and gPROFILER [73], for genes passing the multiple testing correction threshold (p=0.05), and GSEA [74] for full gene ranked lists. The databases being interrogated include GO, KEGG, WikiPathways, and Reactome. Only pathways and GO categories selected by at least two enrichment tools with adjusted p<0.05 and a minimum of three overlapping genes were selected for further exploring.
Data availability statement
Summary statistics are included as Supplementary Tables and will be made available through Synapse repository (https://www.synapse.org/) upon publication.
Most data used in this article are publicly available (see acknowledgement section).
Code availability statement
Code used for this article will be made publicly available through a public Jupyter server (Madrid L, Rubio-Escudero C, Pontes B, González-Pérez A, Riquelme JA, Sáez ME. MOMIC: A Multi-Omics Pipeline for data analysis, integration and interpretation (manuscript in preparation))
Supplementary Materials
Author Contributions
Coordination: M.E.S., A.Ruiz; Data Analyses: L.M.M, A.G.P, P.V.M.A., L.K., M.E.S.; CHARGE analysis and coordination: R.X., Q.Y., J.C.B., X.J., S.A., C.V.D., A.D.S, M.F., M.A.I., C.L.S., E.B., S.S.; EADI analysis and coordination: V.D,. C.B., B.G.-B., P.A., J.C.L.; GERAD analysis and coordination: A.Ramirez; R.S., J.W.; GR@ACE/DEGESCO analysis and coordination: S.M.G., I.R., P.G.G., A.O., A.Ruiz; Core writing group: A.C.S, L.M.M., M.E.S., A.Ruiz. All other authors contributed data and all authors critically reviewed the paper.
Acknowledgments
Funding support for the Alzheimer’s Disease Genetics Consortium (ADGC) was provided through the NIA Division of Neuroscience (U01-AG032984). This study was downloaded from NIH dbGaP repository (phs000372.v1).
The AddNeuroMed study is a public-private partnership supported by EFPIA companies and SMEs as part of InnoMed (Innovative Medicines in Europe), an Integrated Project funded by the European Union of the Sixth Framework program priority FP6-2004-LIFESCIHEALTH-5. Clinical leads responsible for data collection are Iwona Kłoszewska (Lodz), Simon Lovestone (London), Patrizia Mecocci (Perugia), Hilkka Soininen (Kuopio), Magda Tsolaki (Thessaloniki), and Bruno Vellas (Toulouse), imaging leads are Andy Simmons (London), Lars-Olad Wahlund (Stockholm) and Christian Spenger (Zurich) and bioinformatics leads are Richard Dobson (London) and Stephen Newhouse (London). This dataset was downloaded from Synapse (doi:10.7303/syn2790911).
Data collection and sharing for this project was partially funded by the Alzheimer's Disease Neuroimaging Initiative (ADNI) (National Institutes of Health Grant U01 AG024904) and DOD ADNI (Department of Defense award number W81XWH-12-2-0012). ADNI is funded by the National Institute on Aging, the National Institute of Biomedical Imaging and Bioengineering, and through generous contributions from the following: AbbVie, Alzheimer’s Association; Alzheimer’s Drug Discovery Foundation; Araclon Biotech; BioClinica, Inc.; Biogen; Bristol-Myers Squibb Company; CereSpir, Inc.; Cogstate; Eisai Inc.; Elan Pharmaceuticals, Inc.; Eli Lilly and Company; EuroImmun; F. Hoffmann-La Roche Ltd and its affiliated company Genentech, Inc.; Fujirebio; GE Healthcare; IXICO Ltd.; Janssen Alzheimer Immunotherapy Research and Development, LLC.; Johnson and Johnson Pharmaceutical Research and Development LLC.; Lumosity; Lundbeck; Merck & Co., Inc.; Meso Scale Diagnostics, LLC.; NeuroRx Research; Neurotrack Technologies; Novartis Pharmaceuticals Corporation; Pfizer Inc.; Piramal Imaging; Servier; Takeda Pharmaceutical Company; and Transition Therapeutics. The Canadian Institutes of Health Research is providing funds to support ADNI clinical sites in Canada. Private sector contributions are facilitated by the Foundation for the National Institutes of Health (https://www.fnih.org/). The grantee organization is the Northern California Institute for Research and Education, and the study is coordinated by the Alzheimer’s Therapeutic Research Institute at the University of Southern California. ADNI data are disseminated by the Laboratory for Neuro Imaging at the University of Southern California.
The Atherosclerosis Risk in Communities (ARIC) study is carried out as a collaborative study supported by the National Heart, Lung, and Blood Institute (NHLBI) contracts (HHSN268201100005C, HHSN268201100006C, HHSN268201100007C, HHSN268201100008C, HHSN268201100009C, HHSN268201100010C, HHSN268201100011C, and HHSN268201100012C). The authors thank the staff and participants of the ARIC study for their important contributions. Funding support for “Building on GWAS for NHLBI-diseases: the U.S. CHARGE consortium” was provided by the NIH through the American Recovery and Reinvestment Act of 2009 (ARRA) (5RC2HL102419). This project was also funded from R01-NS087541.
The Banner Sun Health Research Institute (BANNER) data were provided by Dr. Levey from Emory University. A portion of these data were generated from samples collected through the Sun Health Research Institute Brain and Body Donation Program of Sun City, Arizona. The Brain and Body Donation Program is supported by the National Institute of Neurological Disorders and Stroke (U24 NS072026 National Brain and Tissue Resource for Parkinson’s Disease and Related Disorders), the National Institute on Aging (P30 AG19610 Arizona Alzheimer’s Disease Core Center), the Arizona Department of Health Services (contract 211002, Arizona Alzheimer’s Research Center), the Arizona Biomedical Research Commission (contracts 4001, 0011, 05-901 and 1001 to the Arizona Parkinson's Disease Consortium) and the Michael J. Fox Foundation for Parkinson's Research. This study was downloaded from Synapse (10.7303/syn7170616).
The Baltimore Longitudinal Study on Aging (BLSA) study data were generated from postmortem brain tissue collected through The National Institute on Aging’s Baltimore Longitudinal Study of Aging and provided by Dr. Levey from Emory University. This study was downloaded from Synapse (10.7303/syn3606086).
Infrastructure for the Cohorts for Heart and Aging Research in Genomic Epidemiology (CHARGE) Consortium is supported in part by the National Heart, Lung, and Blood Institute grant HL105756 and for the neuroCHARGE phenotype working group through the National Institute on Aging grants R01 AG033193, RF1 AG059421, U01 AG049505 and AG052409.
The Cardiovascular Health Study (CHS) research was supported by NHLBI contracts HHSN268201200036C, HHSN268200800007C, HHSN268201800001C, N01HC55222, N01HC85079, N01HC85080, N01HC85081, N01HC85082, N01HC85083, N01HC85086, N01HC15103, HHSN268200960009C; and NHLBI grants U01HL080295, R01HL087652, R01HL105756, R01HL103612, R01HL120393, and U01HL130114 with additional contribution from the National Institute of Neurological Disorders and Stroke (NINDS). Additional support was provided through R01AG023629, and R01AG033193 from the National Institute on Aging (NIA). A full list of principal CHS investigators and institutions can be found at CHS-NHLBI.org. The provision of genotyping data was supported in part by the National Center for Advancing Translational Sciences, CTSI grant UL1TR001881, and the National Institute of Diabetes and Digestive and Kidney Disease Diabetes Research Center (DRC) grant DK063491 to the Southern California Diabetes Endocrinology Research Center. The content is solely the responsibility of the authors and does not necessarily represent the official views of the National Institutes of Health.
The EADI study has been developed and supported by the LABEX (laboratory of excellence program investment for the future) DISTALZ grant (Development of Innovative Strategies for a Transdisciplinary approach to ALZheimer’s disease) including funding from MEL (Metropole européenne de Lille), ERDF (European Regional Development Fund) and Conseil Régional Nord Pas de Calais. This work was supported by INSERM, the National Foundation for Alzheimer’s disease and related disorders, the Institut Pasteur de Lille and the Centre National de Recherche en Génomique Humaine, CEA, the JPND PERADES, the Laboratory of Excellence GENMED (Medical Genomics) grant no. ANR-10-LABX-0013 managed by the National Research Agency (ANR) part of the Investment for the Future program, and the FP7 AgedBrainSysBio. The Three-City Study was performed as part of collaboration between the Institut National de la Santé et de la Recherche Médicale (Inserm), the Victor Segalen Bordeaux II University and Sanofi-Synthélabo. The Fondation pour la Recherche Médicale funded the preparation and initiation of the study. The 3C Study was also funded by the Caisse Nationale Maladie des Travailleurs Salariés, Direction Générale de la Santé, MGEN, Institut de la Longévité, Agence Française de Sécurité Sanitaire des Produits de Santé, the Aquitaine and Bourgogne Regional Councils, Agence Nationale de la Recherche, ANR supported the COGINUT and COVADIS projects. Fondation de France and the joint French Ministry of Research/INSERM “Cohortes et collections de données biologiques” programme. Lille Génopôle received an unconditional grant from Eisai. The Three-city biological bank was developed and maintained by the laboratory for genomic analysis LAG-BRC - Institut Pasteur de Lille. This work was further supported by the CoSTREAM project (http://www.costream.eu/) and funding from the European Union's Horizon 2020 research and innovation program under grant agreement 667375. Pascual Sanchez Juan was supported by grants from, IDIVAL, Instituto de Salud Carlos III (Fondo de Investigacion Sanitario, PI08/0139, PI12/02288, PI16/01652, JPND (DEMTEST PI11/03028) and the CIBERNED program. Belgium samples: Research at the Antwerp site is funded in part by the Belgian Science Policy Office Interuniversity Attraction Poles program, the Belgian Alzheimer Research Foundation, the Flemish government-initiated Flanders Impulse Program on Networks for Dementia Research (VIND) and the Methusalem excellence program, the Research Foundation Flanders (FWO), and the University of Antwerp Research Fund, Belgium. The Antwerp site authors thank the personnel of the VIB Neuromics Support Facility, the Biobank of the Institute Born-Bunge and neurology departments at the contributing hospitals. The authors acknowledge the members of the BELNEU consortium for their contributions to the clinical and pathological characterization of Belgium patients and the personnel of the Diagnostic Service Facility for the genetic testing. Finish sample collection: Financial support for this project was provided by Academy of Finland (grant number 307866), Sigrid Jusélius Foundation and the Strategic Neuroscience Funding of the University of Eastern Finland Swedish sample collection: Financially supported in part by the Swedish Brain Power network, the Marianne and Marcus Wallenberg Foundation, the Swedish Research Council (521-2010- 3134, 2015-02926), the King Gustaf V and Queen Victoria’s Foundation of Freemasons, the Regional Agreement on Medical Training and Clinical Research (ALF) between Stockholm County Council and the Karolinska Institutet, the Swedish Brain Foundation and the Swedish Alzheimer Foundation”.
This work has been partly supported by the National Heart, Lung and Blood Institute's Framingham Heart Study (Contract No. N01-HC-25195 and No. HHSN268201500001I) and its contract with Affymetrix, Inc. for genotyping services (Contract No. N02-HL-6-4278). A portion of this research utilized the Linux Cluster for Genetic Analysis (LinGA-II) funded by the Robert Dawson Evans Endowment of the Department of Medicine at Boston University School of Medicine and Boston Medical Center. This study was also supported by grants from the National Institute of Aging (R01s AG033040, AG033193, AG054076, AG049607, AG008122, AG016495; and U01-AG049505) and the National Institute of Neurological Disorders and Stroke (R01-NS017950). We would like to thank the dedication of the Framingham Study participants, as well as the Framingham Study team, especially investigators and staff from the Neurology group, for their contributions to data collection. Dr. DeCarli is supported by the Alzheimer’s Disease Center (P30 AG 010129). The views expressed in this manuscript are those of the authors and do not necessarily represent the views of the National Heart, Lung, and Blood Institute; the National Institutes of Health; or the U.S. Department of Health and Human Services.
The genotypic and associated phenotypic data used in the study, Multi-Site Collaborative Study for Genotype-Phenotype Associations in Alzheimer’s Disease (GenADA) study was contributed by Luis Fornazzari. Memory Clinic, St. Michaels Hospital, Toronto, Serge Gauthier. McGill Centre for Studies in Aging, Alzheimer's Disease Research Unit, Verdun, Quebec, Peter H. St. George-Hyslop. University of Toronto, Center for Research in Neurodegenerative Diseases, Toronto, Ontario, Howard Feldman. Vancouver Hospital and Health Sciences Centre, Vancouver, British Columbia, Anthony Guzman. Clinical Trial Unit, SCO Health Service, Ottawa, Ontario, Michael Borrie. Parkwood Hospital, London, Ontario, Andrew Kertesz. St. Joseph's Hospital, London, Ontario, Richard Delisle. Clinique de Neurologie, Trois-Riviéres, Quebec. The study was funded by GlaxoSmithKline, Inc.. Translational Medicine and Genetics, Clinical Imaging Center, R&D Alliances, and Worldwide Epidemiology. The dataset used for analyses described in this manuscript were obtained from NIH dbGaP repository (phs000219.v1.p1).
Data used in the preparation of this article was obtained from the Genetic and Environmental Risk for Alzheimer’s disease (GERAD1) Consortium (Harold et al. 2009). Cardiff University was supported by the Wellcome Trust, Medical Research Council (MRC), Alzheimer’s Research UK (ARUK) and the Welsh Assembly Government. Cambridge University and Kings College London acknowledge support from the MRC. ARUK supported sample collections at the South West Dementia Bank and the Universities of Nottingham, Manchester and Belfast. The Belfast group acknowledges support from the Alzheimer's Society, Ulster Garden Villages, N.Ireland R&D Office and the Royal College of Physicians/Dunhill Medical Trust. The MRC and Mercer’s Institute for Research on Ageing supported the Trinity College group. The South West Dementia Brain Bank acknowledges support from Bristol Research into Alzheimer's and Care of the Elderly. The Charles Wolfson Charitable Trust supported the OPTIMA group. Washington University was funded by NIH grants, Barnes Jewish Foundation and the Charles and Joanne Knight Alzheimer's Research Initiative. Patient recruitment for the MRC Prion Unit/UCL Department of Neurodegenerative Disease collection was supported by the UCLH/UCL Biomedical Centre and NIHR Queen Square Dementia Biomedical Research Unit. LASER-AD was funded by Lundbeck SA. The Bonn group was supported by the German Federal Ministry of Education and Research (BMBF), Competence Network Dementia and Competence Network Degenerative Dementia, and by the Alfried Krupp von Bohlen und Halbach-Stiftung. The GERAD1 Consortium also used samples ascertained by the NIMH AD Genetics Initiative.
The Genome Research @ Fundació ACE project (GR@ACE) is supported by Grifols SA, Fundación bancaria ‘La Caixa’, Fundació ACE, and CIBERNED. A.R. receive support from the European Union/EFPIA Innovative Medicines Initiative Joint undertaking ADAPTED and MOPEAD projects (grant numbers 115975 and 115985, respectively) and by national grants PI19/01301, PI16/01861, PI17/01474 and PI19/01240. Acción Estratégica en Salud is integrated into the Spanish National R + D + I Plan and funded by ISCIII (Instituto de Salud Carlos III)–Subdirección General de Evaluación and the Fondo Europeo de Desarrollo Regional (FEDER–‘Una manera de hacer Europa’). Some control samples and data from patients included in this study were provided in part by the National DNA Bank Carlos III (http://www.bancoadn.org, University of Salamanca, Spain) and Hospital Universitario Virgen de Valme (Sevilla, Spain); they were processed following standard operating procedures with the appropriate approval of the Ethical and Scientific Committee.
The Mayo Clinic Alzheimer's Disease Genetic Studies, led by Dr. Nilüfer Ertekin-Taner and Dr. Steven G. Younkin, Mayo Clinic, Jacksonville, FL using samples from the Mayo Clinic Study of Aging, the Mayo Clinic Alzheimer's Disease Research Center, and the Mayo Clinic Brain Bank. Data collection was supported through funding by NIA grants P50 AG016574, R01 AG032990, U01 AG046139, R01 AG018023, U01 AG006576, U01 AG006786, R01 AG025711, R01 AG017216, R01 AG003949, NINDS grant R01 NS080820, CurePSP Foundation, and support from Mayo Foundation. This dataset was downloaded from Synapse (doi:10.7303/syn5550404).
The Mount Sinai Brain Bank (MSBB) study data were provided by Dr. Levey from Emory University based on postmortem brain tissue collected through the Mount Sinai VA Medical Center Brain Bank provided by Dr. Eric Schadt from Mount Sinai School of Medicine. This dataset was downloaded from Synapse (10.7303/syn3159438).
The Neocodex-Murcia study was funded by the Fundación Alzheimur (Murcia), the Ministerio de Educación y Ciencia (Gobierno de España), Corporación Tecnológica de Andalucía and Agencia IDEA (Consejería de Innovación, Junta de Andalucía). The Diabetes Research Laboratory, Biomedical Research Foundation. University Hospital Clínico San Carlos has been supported by CIBER de Diabetes y Enfermedades Metabólicas Asociadas (CIBERDEM); CIBERDEM is an ISCIII Project.
The National Institute on Aging (NIA) - Late Onset Alzheimer's Disease Family Study data were provided by Richard Mayeux, MD, MSc. Columbia University, New York, NY, USA andTatiana Foroud, PhD. National Cell Repository for Alzheimer's Disease and Indiana University, Indianapolis, IN, USA. This study has received funding from HHSN268200782096C. "NIH contract High throughput genotyping for studying the genetic contributions to human disease”. National Institutes of Health, Bethesda, MD, USA. The study was downloaded from dbGap (phs000168p2v2).
The ROS/MAP study data were provided by the Rush Alzheimer’s Disease Center, Rush University Medical Center, Chicago. Data collection was supported through funding by NIA grants P30AG10161 (ROS), R01AG15819 (ROSMAP; genomics and RNAseq), R01AG17917 (MAP), R01AG30146, R01AG36042 (5hC methylation, ATACseq), RC2AG036547 (H3K9Ac), R01AG36836 (RNAseq), R01AG48015 (monocyte RNAseq) RF1AG57473 (single nucleus RNAseq), U01AG32984 (genomic and whole exome sequencing), U01AG46152 (ROSMAP AMP-AD, targeted proteomics), U01AG46161(TMT proteomics), U01AG61356 (whole genome sequencing, targeted proteomics, ROSMAP AMP-AD), the Illinois Department of Public Health (ROSMAP), and the Translational Genomics Research Institute (genomic). Additional phenotypic data can be requested at https://www.radc.rush.edu. This dataset was downloaded from Synapse (doi:10.7303/syn3219045).
The Rotterdam Study (RS) is funded by Erasmus Medical Center and Erasmus University, Rotterdam, Netherlands Organization for the Health Research and Development (ZonMw), the Research Institute for Diseases in the Elderly (RIDE), the Ministry of Education, Culture and Science, the Ministry for Health, Welfare and Sports, the European Commission (DG XII), and the Municipality of Rotterdam. The authors are grateful to the study participants, the staff from the Rotterdam Study and the participating general practitioners and pharmacists. The generation and management of GWAS genotype data for the Rotterdam Study (RS I, RS II, RS III) were executed by the Human Genotyping Facility of the Genetic Laboratory of the Department of Internal Medicine, Erasmus MC, Rotterdam, The Netherlands. The GWAS datasets are supported by the Netherlands Organisation of Scientific Research NWO Investments (nr. 175.010.2005.011, 911-03-012), the Genetic Laboratory of the Department of Internal Medicine, Erasmus MC, the Research Institute for Diseases in the Elderly (014-93-015; RIDE2), the Netherlands Genomics Initiative (NGI)/Netherlands Organisation for Scientific Research (NWO) Netherlands Consortium for Healthy Aging (NCHA), project nr. 050-060-810. We thank Pascal Arp, Mila Jhamai, Marijn Verkerk, Lizbeth Herrera and Marjolein Peters, and Carolina Medina-Gomez, for their help in creating the GWAS database, and Karol Estrada, Yurii Aulchenko, and Carolina Medina-Gomez, for the creation and analysis of imputed data. This work has been performed as part of the CoSTREAM project (http://www.costream.eu) and ORACLE project, and has received funding from the European Union's Horizon 2020 research and innovation programme under grant agreement No 667375 and No 678543. HHHA was supported by ZonMW grant number 916.19.151.
The TGEN study was supported by Kronos Life Sciences Laboratories, the National Institute on Aging (Arizona Alzheimer’s Disease Center P30 AG19610, RO1 AG023193, Mayo Clinic Alzheimer’s Disease Center P50 AG16574, and Intramural Research Program), the National Alzheimer’s Coordinating Center (U01 AG016976), and the state of Arizona. TGEN investigators provided free access to genotype data to other researchers via Coriell Biorepositories (http://www.coriell.org).
We thank Dr Beatriz Pontes, Dr Cristina Rubio-Escudero and Dr José C. Riquelme for providing support for the implementation and distribution of analysis code as Jupyter notebooks.
The results published here are in part based on data obtained from the AMP-AD Knowledge Portal (https://adknowledgeportal.synapse.org/).
Conflicts of Interest
This study was sponsored by AbbVie Deutschland GmbH & Co. KG. AbbVie contributed to the study design, research, and interpretation of data, writing, reviewing, and approving the abstract. Some authors are currently employed by AbbVie and may own AbbVie stock. Alfredo Cabrera-Socorro is full-time employee of Janssen Pharmaceutical NV, Turnhoutseweg 30, 2340 Beerse, Belgium.
Funding
This work has been supported by the ADAPTED consortium, which has received funding from the Innovative Medicines Initiative 2 Joint Undertaking under grant agreement No 115975. This Joint Undertaking receives support from the European Union’s Horizon 2020 research and innovation program and the European Federation of Pharmaceutical Industries and Associations.
References
- 1. Strittmatter WJ, Saunders AM, Schmechel D, Pericak-Vance M, Enghild J, Salvesen GS, Roses AD. Apolipoprotein E: high-avidity binding to beta-amyloid and increased frequency of type 4 allele in late-onset familial Alzheimer disease. Proc Natl Acad Sci USA. 1993; 90:1977–81. https://doi.org/10.1073/pnas.90.5.1977 [PubMed]
- 2. Corder EH, Saunders AM, Strittmatter WJ, Schmechel DE, Gaskell PC, Small GW, Roses AD, Haines JL, Pericak-Vance MA. Gene dose of apolipoprotein E type 4 allele and the risk of Alzheimer’s disease in late onset families. Science. 1993; 261:921–23. https://doi.org/10.1126/science.8346443 [PubMed]
- 3. Saunders AM, Strittmatter WJ, Schmechel D, George-Hyslop PH, Pericak-Vance MA, Joo SH, Rosi BL, Gusella JF, Crapper-MacLachlan DR, Alberts MJ. Association of apolipoprotein E allele epsilon 4 with late-onset familial and sporadic Alzheimer’s disease. Neurology. 1993; 43:1467–72. https://doi.org/10.1212/WNL.43.8.1467 [PubMed]
- 4. Havel RJ, Kane JP. Primary dysbetalipoproteinemia: predominance of a specific apoprotein species in triglyceride-rich lipoproteins. Proc Natl Acad Sci USA. 1973; 70:2015–19. https://doi.org/10.1073/pnas.70.7.2015 [PubMed]
- 5. Utermann G, Jaeschke M, Menzel J. Familial hyperlipoproteinemia type III: deficiency of a specific apolipoprotein (apo E-III) in the very-low-density lipoproteins. FEBS Lett. 1975; 56:352–55. https://doi.org/10.1016/0014-5793(75)81125-2 [PubMed]
- 6. Weisgraber KH, Rall SC
Jr , Mahley RW. Human E apoprotein heterogeneity. Cysteine-arginine interchanges in the amino acid sequence of the apo-E isoforms. J Biol Chem. 1981; 256:9077–83. [PubMed] - 7. Rall SC
Jr , Weisgraber KH, Mahley RW. Human apolipoprotein E. The complete amino acid sequence. J Biol Chem. 1982; 257:4171–78. [PubMed] - 8. Zannis VI, Breslow JL, Utermann G, Mahley RW, Weisgraber KH, Havel RJ, Goldstein JL, Brown MS, Schonfeld G, Hazzard WR, Blum C. Proposed nomenclature of apoE isoproteins, apoE genotypes, and phenotypes. J Lipid Res. 1982; 23:911–14. [PubMed]
- 9. Belloy ME, Napolioni V, Greicius MD. A Quarter Century of APOE and Alzheimer’s Disease: Progress to Date and the Path Forward. Neuron. 2019; 101:820–38. https://doi.org/10.1016/j.neuron.2019.01.056 [PubMed]
- 10. Farrer LA, Cupples LA, Haines JL, Hyman B, Kukull WA, Mayeux R, Myers RH, Pericak-Vance MA, Risch N, van Duijn CM. Effects of age, sex, and ethnicity on the association between apolipoprotein E genotype and Alzheimer disease. A meta-analysis. APOE and Alzheimer Disease Meta Analysis Consortium. JAMA. 1997; 278:1349–56. [PubMed]
- 11. Kunkle BW, Grenier-Boley B, Sims R, Bis JC, Damotte V, Naj AC, Boland A, Vronskaya M, van der Lee SJ, Amlie-Wolf A, Bellenguez C, Frizatti A, Chouraki V, et al, and Alzheimer Disease Genetics Consortium (ADGC), and European Alzheimer’s Disease Initiative (EADI), and Cohorts for Heart and Aging Research in Genomic Epidemiology Consortium (CHARGE), and Genetic and Environmental Risk in AD/Defining Genetic, and Polygenic and Environmental Risk for Alzheimer’s Disease Consortium (GERAD/PERADES). Genetic meta-analysis of diagnosed Alzheimer's disease identifies new risk loci and implicates Aβ, tau, immunity and lipid processing. Nat Genet. 2019; 51:414–30. https://doi.org/10.1038/s41588-019-0358-2 [PubMed]
- 12. Jansen IE, Savage JE, Watanabe K, Bryois J, Williams DM, Steinberg S, Sealock J, Karlsson IK, Hägg S, Athanasiu L, Voyle N, Proitsi P, Witoelar A, et al. Genome-wide meta-analysis identifies new loci and functional pathways influencing Alzheimer’s disease risk. Nat Genet. 2019; 51:404–13. https://doi.org/10.1038/s41588-018-0311-9 [PubMed]
- 13. de Rojas I, Moreno-Grau S, Tesi N, Grenier-Boley B, Andrade V, Jansen I, Pedersen NL, Stringa N, Zettergren A, Hernández I, Montrreal L, Antúnez C, Antonell A, et al. Common variants in Alzheimer’s disease: Novel association of six genetic variants with AD and risk stratification by polygenic risk scores. 2020. https://www.medrxiv.org/content/101101/19012021v3 https://doi.org/10.1101/19012021
- 14. Sims R, Hill M, Williams J. The multiplex model of the genetics of Alzheimer’s disease. Nat Neurosci. 2020; 23:311–22. https://doi.org/10.1038/s41593-020-0599-5 [PubMed]
- 15. Jun G, Ibrahim-Verbaas CA, Vronskaya M, Lambert JC, Chung J, Naj AC, Kunkle BW, Wang LS, Bis JC, Bellenguez C, Harold D, Lunetta KL, Destefano AL, et al, and IGAP Consortium. A novel Alzheimer disease locus located near the gene encoding tau protein. Mol Psychiatry. 2016; 21:108–17. https://doi.org/10.1038/mp.2015.23 [PubMed]
- 16. Ma Y, Jun GR, Zhang X, Chung J, Naj AC, Chen Y, Bellenguez C, Hamilton-Nelson K, Martin ER, Kunkle BW, Bis JC, Debette S, DeStefano AL, et al, and Alzheimer’s Disease Sequencing Project and Alzheimer’s Disease Exome Sequencing–France Project. Analysis of Whole-Exome Sequencing Data for Alzheimer Disease Stratified by APOE Genotype. JAMA Neurol. 2019; 76:1099–108. https://doi.org/10.1001/jamaneurol.2019.1456 [PubMed]
- 17. van der Harst P, van Setten J, Verweij N, Vogler G, Franke L, Maurano MT, Wang X, Mateo Leach I, Eijgelsheim M, Sotoodehnia N, Hayward C, Sorice R, Meirelles O, et al. 52 Genetic Loci Influencing Myocardial Mass. J Am Coll Cardiol. 2016; 68:1435–48. https://doi.org/10.1016/j.jacc.2016.07.729 [PubMed]
- 18. Wijsman EM, Pankratz ND, Choi Y, Rothstein JH, Faber KM, Cheng R, Lee JH, Bird TD, Bennett DA, Diaz-Arrastia R, Goate AM, Farlow M, Ghetti B, et al, and NIA-LOAD/NCRAD Family Study Group. Genome-wide association of familial late-onset Alzheimer’s disease replicates BIN1 and CLU and nominates CUGBP2 in interaction with APOE. PLoS Genet. 2011; 7:e1001308. https://doi.org/10.1371/journal.pgen.1001308 [PubMed]
- 19. Mathys H, Davila-Velderrain J, Peng Z, Gao F, Mohammadi S, Young JZ, Menon M, He L, Abdurrob F, Jiang X, Martorell AJ, Ransohoff RM, Hafler BP, et al. Author Correction: Single-cell transcriptomic analysis of Alzheimer's disease. Nature. 2019; 571:E1. https://doi.org/10.1038/s41586-019-1329-6 [PubMed]
- 20. Hatcher C, Relton CL, Gaunt TR, Richardson TG. Leveraging brain cortex-derived molecular data to elucidate epigenetic and transcriptomic drivers of complex traits and disease. Transl Psychiatry. 2019; 9:105. https://doi.org/10.1038/s41398-019-0437-2 [PubMed]
- 21. Raj T, Li YI, Wong G, Humphrey J, Wang M, Ramdhani S, Wang YC, Ng B, Gupta I, Haroutunian V, Schadt EE, Young-Pearse T, Mostafavi S, et al. Integrative transcriptome analyses of the aging brain implicate altered splicing in Alzheimer’s disease susceptibility. Nat Genet. 2018; 50:1584–92. https://doi.org/10.1038/s41588-018-0238-1 [PubMed]
- 22. Traylor M, Adib-Samii P, Harold D, Dichgans M, Williams J, Lewis CM, Markus HS, and Alzheimer's Disease Neuroimaging Initiative, and International Stroke Genetics Consortium (ISGC), and UK Young Lacunar Stroke DNA resource, and METASTROKE, and International Genomics of Alzheimer's Project (IGAP), and investigators. Shared genetic contribution to Ischaemic Stroke and Alzheimer's Disease. Ann Neurol. 2016; 79:739–47. https://doi.org/10.1002/ana.24621 [PubMed]
- 23. Bihlmeyer NA, Merrill E, Lambert Y, Srivastava GP, Clark TW, Hyman BT, Das S. Novel methods for integration and visualization of genomics and genetics data in Alzheimer’s disease. Alzheimers Dement. 2019; 15:788–98. https://doi.org/10.1016/j.jalz.2019.01.011 [PubMed]
- 24. Rao S, Ghani M, Guo Z, Deming Y, Wang K, Sims R, Mao C, Yao Y, Cruchaga C, Stephan DA, Rogaeva E. An APOE-independent cis-eSNP on chromosome 19q13.32 influences tau levels and late-onset Alzheimer’s disease risk. Neurobiol Aging. 2018; 66:178.e1–8. https://doi.org/10.1016/j.neurobiolaging.2017.12.027 [PubMed]
- 25. Jiang S, Zhang CY, Tang L, Zhao LX, Chen HZ, Qiu Y. Integrated Genomic Analysis Revealed Associated Genes for Alzheimer’s Disease in APOE4 Non-Carriers. Curr Alzheimer Res. 2019; 16:753–63. https://doi.org/10.2174/1567205016666190823124724 [PubMed]
- 26. Yamaguchi-Kabata Y, Morihara T, Ohara T, Ninomiya T, Takahashi A, Akatsu H, Hashizume Y, Hayashi N, Shigemizu D, Boroevich KA, Ikeda M, Kubo M, Takeda M, Tsunoda T. Integrated analysis of human genetic association study and mouse transcriptome suggests LBH and SHF genes as novel susceptible genes for amyloid-β accumulation in Alzheimer’s disease. Hum Genet. 2018; 137:521–33. https://doi.org/10.1007/s00439-018-1906-z [PubMed]
- 27. Makrythanasis P, Gimelli S, Béna F, Dahoun S, Morris MA, Antonarakis SE, Bottani A. Homozygous deletion of a gene-free region of 4p15 in a child with multiple anomalies: could biallelic loss of conserved, non-coding elements lead to a phenotype? Eur J Med Genet. 2012; 55:63–66. https://doi.org/10.1016/j.ejmg.2011.11.001 [PubMed]
- 28. Fan CC, Banks SJ, Thompson WK, Chen CH, McEvoy LK, Tan CH, Kukull W, Bennett DA, Farrer LA, Mayeux R, Schellenberg GD, Andreassen OA, Desikan R, Dale AM. Sex-dependent autosomal effects on clinical progression of Alzheimer’s disease. Brain. 2020; 143:2272–80. https://doi.org/10.1093/brain/awaa164 [PubMed]
- 29. Balin BJ, Hudson AP. Herpes viruses and Alzheimer’s disease: new evidence in the debate. Lancet Neurol. 2018; 17:839–41. https://doi.org/10.1016/S1474-4422(18)30316-8 [PubMed]
- 30. Ansari MA, Scheff SW. Oxidative stress in the progression of Alzheimer disease in the frontal cortex. J Neuropathol Exp Neurol. 2010; 69:155–67. https://doi.org/10.1097/NEN.0b013e3181cb5af4 [PubMed]
- 31. Rinaldi P, Polidori MC, Metastasio A, Mariani E, Mattioli P, Cherubini A, Catani M, Cecchetti R, Senin U, Mecocci P. Plasma antioxidants are similarly depleted in mild cognitive impairment and in Alzheimer’s disease. Neurobiol Aging. 2003; 24:915–19. https://doi.org/10.1016/S0197-4580(03)00031-9 [PubMed]
- 32. Praticò D, Clark CM, Liun F, Rokach J, Lee VY, Trojanowski JQ. Increase of brain oxidative stress in mild cognitive impairment: a possible predictor of Alzheimer disease. Arch Neurol. 2002; 59:972–76. https://doi.org/10.1001/archneur.59.6.972 [PubMed]
- 33. de la Monte SM, Luong T, Neely TR, Robinson D, Wands JR. Mitochondrial DNA damage as a mechanism of cell loss in Alzheimer’s disease. Lab Invest. 2000; 80:1323–35. https://doi.org/10.1038/labinvest.3780140 [PubMed]
- 34. Song XN, Zhang LQ, Liu DG, Lin J, Zheng JD, Dai DP, Hei AL, Hayakawa H, Sekiguchi M, Cai JP. Oxidative damage to RNA and expression patterns of MTH1 in the hippocampi of senescence-accelerated SAMP8 mice and Alzheimer’s disease patients. Neurochem Res. 2011; 36:1558–65. https://doi.org/10.1007/s11064-011-0484-4 [PubMed]
- 35. Zhou X, Chen Y, Mok KY, Kwok TC, Mok VC, Guo Q, Ip FC, Chen Y, Mullapudi N, Giusti-Rodríguez P, Sullivan PF, Hardy J, Fu AK, et al, and Alzheimer’s Disease Neuroimaging Initiative. Non-coding variability at the APOE locus contributes to the Alzheimer’s risk. Nat Commun. 2019; 10:3310. https://doi.org/10.1038/s41467-019-10945-z [PubMed]
- 36. Rothaug M, Becker-Pauly C, Rose-John S. The role of interleukin-6 signaling in nervous tissue. Biochim Biophys Acta. 2016; 1863:1218–27. https://doi.org/10.1016/j.bbamcr.2016.03.018 [PubMed]
- 37. Griciuc A, Patel S, Federico AN, Choi SH, Innes BJ, Oram MK, Cereghetti G, McGinty D, Anselmo A, Sadreyev RI, Hickman SE, El Khoury J, Colonna M, Tanzi RE. TREM2 Acts Downstream of CD33 in Modulating Microglial Pathology in Alzheimer’s Disease. Neuron. 2019; 103:820–35.e7. https://doi.org/10.1016/j.neuron.2019.06.010 [PubMed]
- 38. Larsen JV, Petersen CM. SorLA in Interleukin-6 Signaling and Turnover. Mol Cell Biol. 2017; 37:e00641–16. https://doi.org/10.1128/MCB.00641-16 [PubMed]
- 39. Zhou T, Chen Y, Hao L, Zhang Y. DC-SIGN and immunoregulation. Cell Mol Immunol. 2006; 3:279–83. [PubMed]
- 40. Sáez ME, González-Pérez A, Hernández-Olasagarre B, Beà A, Moreno-Grau S, de Rojas I, Monté-Rubio G, Orellana A, Valero S, Comella JX, Sanchís D, Ruiz A. Genome Wide Meta-Analysis identifies common genetic signatures shared by heart function and Alzheimer's disease. Sci Rep. 2019; 9:16665. https://doi.org/10.1038/s41598-019-52724-2 [PubMed]
- 41. Aderem A, Underhill DM. Mechanisms of phagocytosis in macrophages. Annu Rev Immunol. 1999; 17:593–623. https://doi.org/10.1146/annurev.immunol.17.1.593 [PubMed]
- 42. Fan YY, Cai QL, Gao ZY, Lin X, Huang Q, Tang W, Liu JH. APOE ε4 allele elevates the expressions of inflammatory factors and promotes Alzheimer’s disease progression: A comparative study based on Han and She populations in the Wenzhou area. Brain Res Bull. 2017; 132:39–43. https://doi.org/10.1016/j.brainresbull.2017.04.017 [PubMed]
- 43. Gale SC, Gao L, Mikacenic C, Coyle SM, Rafaels N, Murray Dudenkov T, Madenspacher JH, Draper DW, Ge W, Aloor JJ, Azzam KM, Lai L, Blackshear PJ, et al. APOε4 is associated with enhanced in vivo innate immune responses in human subjects. J Allergy Clin Immunol. 2014; 134:127–34. https://doi.org/10.1016/j.jaci.2014.01.032 [PubMed]
- 44. Zhu Y, Nwabuisi-Heath E, Dumanis SB, Tai LM, Yu C, Rebeck GW, LaDu MJ. APOE genotype alters glial activation and loss of synaptic markers in mice. Glia. 2012; 60:559–69. https://doi.org/10.1002/glia.22289 [PubMed]
- 45. Vitek MP, Brown CM, Colton CA. APOE genotype-specific differences in the innate immune response. Neurobiol Aging. 2009; 30:1350–60. https://doi.org/10.1016/j.neurobiolaging.2007.11.014 [PubMed]
- 46. Lynch JR, Tang W, Wang H, Vitek MP, Bennett ER, Sullivan PM, Warner DS, Laskowitz DT. APOE genotype and an ApoE-mimetic peptide modify the systemic and central nervous system inflammatory response. J Biol Chem. 2003; 278:48529–33. https://doi.org/10.1074/jbc.M306923200 [PubMed]
- 47. Mishima T, Iwabuchi K, Fujii S, Tanaka SY, Ogura H, Watano-Miyata K, Ishimori N, Andoh Y, Nakai Y, Iwabuchi C, Ato M, Kitabatake A, Tsutsui H, Onoé K. Allograft inflammatory factor-1 augments macrophage phagocytotic activity and accelerates the progression of atherosclerosis in ApoE-/- mice. Int J Mol Med. 2008; 21:181–87. [PubMed]
- 48. Egaña-Gorroño L, Chinnasamy P, Casimiro I, Almonte VM, Parikh D, Oliveira-Paula GH, Jayakumar S, Law C, Riascos-Bernal DF, Sibinga NE. Allograft inflammatory factor-1 supports macrophage survival and efferocytosis and limits necrosis in atherosclerotic plaques. Atherosclerosis. 2019; 289:184–94. https://doi.org/10.1016/j.atherosclerosis.2019.07.022 [PubMed]
- 49. Watabe K, Osborne D, Kim SU. Phagocytic activity of human adult astrocytes and oligodendrocytes in culture. J Neuropathol Exp Neurol. 1989; 48:499–506. https://doi.org/10.1097/00005072-198909000-00001 [PubMed]
- 50. McKenzie IA, Ohayon D, Li H, de Faria JP, Emery B, Tohyama K, Richardson WD. Motor skill learning requires active central myelination. Science. 2014; 346:318–22. https://doi.org/10.1126/science.1254960 [PubMed]
- 51. Nasrabady SE, Rizvi B, Goldman JE, Brickman AM. White matter changes in Alzheimer’s disease: a focus on myelin and oligodendrocytes. Acta Neuropathol Commun. 2018; 6:22. https://doi.org/10.1186/s40478-018-0515-3 [PubMed]
- 52. Wang SS, Zhang Z, Zhu TB, Chu SF, He WB, Chen NH. Myelin injury in the central nervous system and Alzheimer’s disease. Brain Res Bull. 2018; 140:162–68. https://doi.org/10.1016/j.brainresbull.2018.05.003 [PubMed]
- 53. Galloway DA, Phillips AEM, Owen DRJ, Moore CS. Corrigendum: Phagocytosis in the Brain: Homeostasis and Disease. Front Immunol. 2019; 10:1575. https://doi.org/10.3389/fimmu.2019.01575 [PubMed]
- 54. Patterson N, Price AL, Reich D. Population structure and eigenanalysis. PLoS Genet. 2006; 2:e190. https://doi.org/10.1371/journal.pgen.0020190 [PubMed]
- 55. McCarthy S, Das S, Kretzschmar W, Delaneau O, Wood AR, Teumer A, Kang HM, Fuchsberger C, Danecek P, Sharp K, Luo Y, Sidore C, Kwong A, et al, and Haplotype Reference Consortium. A reference panel of 64,976 haplotypes for genotype imputation. Nat Genet. 2016; 48:1279–83. https://doi.org/10.1038/ng.3643 [PubMed]
- 56. Purcell S, Neale B, Todd-Brown K, Thomas L, Ferreira MA, Bender D, Maller J, Sklar P, de Bakker PI, Daly MJ, Sham PC. PLINK: a tool set for whole-genome association and population-based linkage analyses. Am J Hum Genet. 2007; 81:559–75. https://doi.org/10.1086/519795 [PubMed]
- 57. Willer CJ, Li Y, Abecasis GR. METAL: fast and efficient meta-analysis of genomewide association scans. Bioinformatics. 2010; 26:2190–91. https://doi.org/10.1093/bioinformatics/btq340 [PubMed]
- 58. Aulchenko YS, Ripke S, Isaacs A, van Duijn CM. GenABEL: an R library for genome-wide association analysis. Bioinformatics. 2007; 23:1294–96. https://doi.org/10.1093/bioinformatics/btm108 [PubMed]
- 59. Turner SD. qqman: an R package for visualizing GWAS results using Q-Q and manhattan plots. J Open Source Softw. 2018; 3:731. https://doi.org/10.21105/joss.00731
- 60. de Leeuw CA, Mooij JM, Heskes T, Posthuma D. MAGMA: generalized gene-set analysis of GWAS data. PLoS Comput Biol. 2015; 11:e1004219. https://doi.org/10.1371/journal.pcbi.1004219 [PubMed]
- 61. Webster JA, Gibbs JR, Clarke J, Ray M, Zhang W, Holmans P, Rohrer K, Zhao A, Marlowe L, Kaleem M, McCorquodale DS 3rd, Cuello C, Leung D, et al, and NACC-Neuropathology Group. Genetic control of human brain transcript expression in Alzheimer disease. Am J Hum Genet. 2009; 84:445–58. https://doi.org/10.1016/j.ajhg.2009.03.011 [PubMed]
- 62. Berchtold NC, Cribbs DH, Coleman PD, Rogers J, Head E, Kim R, Beach T, Miller C, Troncoso J, Trojanowski JQ, Zielke HR, Cotman CW. Gene expression changes in the course of normal brain aging are sexually dimorphic. Proc Natl Acad Sci USA. 2008; 105:15605–10. https://doi.org/10.1073/pnas.0806883105 [PubMed]
- 63. Gautier L, Cope L, Bolstad BM, Irizarry RA. affy--analysis of Affymetrix GeneChip data at the probe level. Bioinformatics. 2004; 20:307–15. https://doi.org/10.1093/bioinformatics/btg405 [PubMed]
- 64. Leek JT, Johnson WE, Parker HS, Jaffe AE, Storey JD. The sva package for removing batch effects and other unwanted variation in high-throughput experiments. Bioinformatics. 2012; 28:882–83. https://doi.org/10.1093/bioinformatics/bts034 [PubMed]
- 65. Ritchie ME, Phipson B, Wu D, Hu Y, Law CW, Shi W, Smyth GK. limma powers differential expression analyses for RNA-sequencing and microarray studies. Nucleic Acids Res. 2015; 43:e47. https://doi.org/10.1093/nar/gkv007 [PubMed]
- 66. Chang LC, Lin HM, Sibille E, Tseng GC. Meta-analysis methods for combining multiple expression profiles: comparisons, statistical characterization and an application guideline. BMC Bioinformatics. 2013; 14:368. https://doi.org/10.1186/1471-2105-14-368 [PubMed]
- 67. Kolde R, Laur S, Adler P, Vilo J. Robust rank aggregation for gene list integration and meta-analysis. Bioinformatics. 2012; 28:573–80. https://doi.org/10.1093/bioinformatics/btr709 [PubMed]
- 68. Butler A, Hoffman P, Smibert P, Papalexi E, Satija R. Integrating single-cell transcriptomic data across different conditions, technologies, and species. Nat Biotechnol. 2018; 36:411–20. https://doi.org/10.1038/nbt.4096 [PubMed]
- 69. Robinson MD, McCarthy DJ, Smyth GK. edgeR: a Bioconductor package for differential expression analysis of digital gene expression data. Bioinformatics. 2010; 26:139–40. https://doi.org/10.1093/bioinformatics/btp616 [PubMed]
- 70. Liao Y, Wang J, Jaehnig EJ, Shi Z, Zhang B. WebGestalt 2019: gene set analysis toolkit with revamped UIs and APIs. Nucleic Acids Res. 2019; 47:W199–205. https://doi.org/10.1093/nar/gkz401 [PubMed]
- 71. Zhang B, Kirov S, Snoddy J. WebGestalt: an integrated system for exploring gene sets in various biological contexts. Nucleic Acids Res. 2005; 33:W741–48. https://doi.org/10.1093/nar/gki475 [PubMed]
- 72. Watanabe K, Taskesen E, van Bochoven A, Posthuma D. Functional mapping and annotation of genetic associations with FUMA. Nat Commun. 2017; 8:1826. https://doi.org/10.1038/s41467-017-01261-5 [PubMed]
- 73. Raudvere U, Kolberg L, Kuzmin I, Arak T, Adler P, Peterson H, Vilo J. g:Profiler: a web server for functional enrichment analysis and conversions of gene lists (2019 update). Nucleic Acids Res. 2019; 47:W191–98. https://doi.org/10.1093/nar/gkz369 [PubMed]
- 74. Subramanian A, Tamayo P, Mootha VK, Mukherjee S, Ebert BL, Gillette MA, Paulovich A, Pomeroy SL, Golub TR, Lander ES, Mesirov JP. Gene set enrichment analysis: a knowledge-based approach for interpreting genome-wide expression profiles. Proc Natl Acad Sci USA. 2005; 102:15545–50. https://doi.org/10.1073/pnas.0506580102 [PubMed]