Irradiation at P3
In the control P4 (P3+1C, i.e., 1 day after pseudo radiation exposure on P3), P10 (P3+7C, i.e., 7 days after pseudo radiation exposure on P3), P120-C (i.e., 120 days after pseudo radiation exposure on P3) mice without radiation exposure, very few γH2AX foci could be observed in different brain regions (Figures 1A–1D, 2A–2D, 3A, 3A’, Figure 4A, Figure 5) (Table 1). However, acute irradiation with 5Gy at P3 induced significant γH2AX expression in the entire brain 1 day after radiation exposure. γH2AX foci could be observed in almost all parts of brain region. It included dorsal pallium(DPall) /isocortex (from the outer pia mater, all layers of the grey matter, white matter to the subventricular zone), medial pallium (MPall) (hippocampal allocortex including the hilus, strata granulosum and moleculare of the dentate gyrus, strata laculosum moleculare, radiatum, pyramidale, oriens of CA1-3 areas), central subpallium/classic basal ganglia (CSPall), alar plate of evaginated telencephalic vesicle (TelA); prosomere 1-3 (Figure 1A’–1D’, 1A”–1D”, Figure 2A’–2D’, 2A”–2D”, Figure 3B, 3C) (refer to “The Allen Developing Mouse Brain Atlas, P4”, website: https://atlas.brain-map.org/atlas?atlas=181276162#atlas=181276162&plate=100711203&structure=15818&x=3841&y=3440&zoom=-3&resolution=7.92&z=7). γH2AX foci were demonstrated in almost all types of brain cells including epithelial cells in pia mater (Figure 1A’, 1A’’), different cells (neurons and glial cells) in the cortex (Figures 1B’, 1B”, 1C’, 1C”, 2A’–2D’’, 2A’–2D’), glial cells in the white matter (Figure 1D’, 1D”) and cells in the blood vessel (Figure 3B’, 3C’).
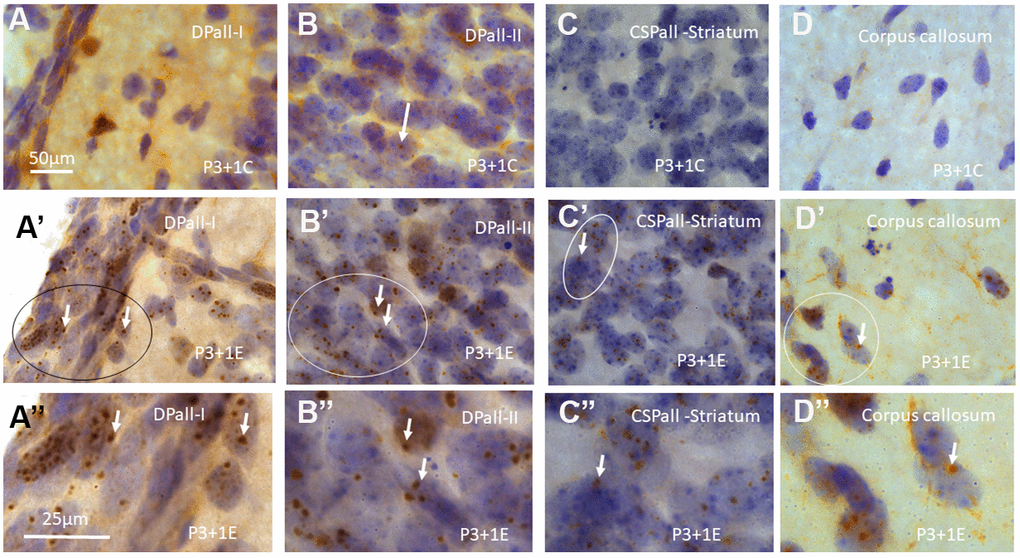
Figure 1. γH2AX immunostaining counterstained with hematoxylin shows very few γH2AX foci in different brain regions of postnatal day 4 (P4) mice without irradiation including dorsal pallium(DPall) /isocortex layer I (DPall-I) and pia mater (A), DPall –II (B, arrow), central subpallium/classic basal ganglia (CSPall) striatum (C) and corpus callosum (D). However, acute irradiation with 5Gy at P3 induced very significant γH2AX expression in the entire brain 1 day after radiation exposure or P4 mice. γH2AX foci could be observed in almost all brain regions at 1 day after irradiation at P3, including DPall-I (A’, A” is magnified from the ellipse in A’), DPall-II to DPall-VI of the grey mater (B’, B”, DPall-II, B” is magnified from the ellipse in B’), CSPall striatum (C’, C” is magnified from the ellipse in C’) and corpus callosum (D’, D” is magnified from the ellipse in D’) at 1 day after irradiation at P3. Scan bar=50μm in (A) applies to (B–D) (A’–D’) Scan bar=25μm in (A”) applies to (B” –D”).
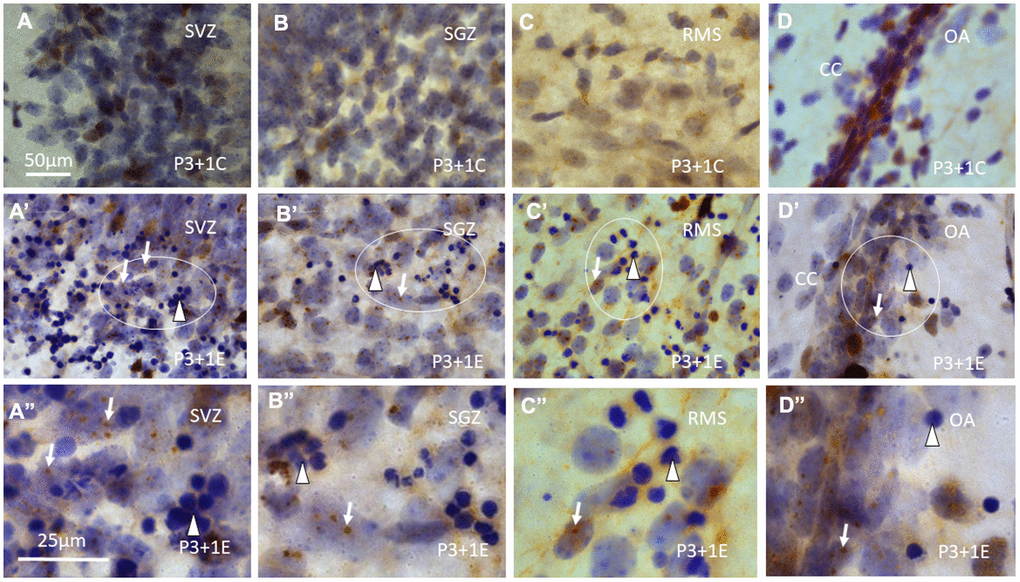
Figure 2. γH2AX immunostaining counterstained with hematoxylin shows that γH2AX foci are almost undetectable in the subventricular zone (SVZ) (A) of the lateral ventricle, subgranular zone (SGZ) (B), rostral migratory stream (RMS) (C) and the border between dorsal hippocampus (O/A: border between stratum oriens and alveus) and corpus callosum (CC) (D) of P4 mice without irradiation. Irradiation with 5Gy induced obvious γH2AX foci (arrows) in SVZ (A’, A” is magnified from the ellipse in A’), SGZ (B’, B” is magnified from the ellipse in B’), RMS (C’, C” is magnified from the ellipse in C’) and the border between O/A and CC (D’, D” is magnified from the ellipse in D’). Furthermore, many apoptotic bodies (arrowheads) appear in SVZ (A’, A”), SGZ (B’, B”), RMS (C’, C”) and the border between O/A and CC (D’, D”) at 1 day after irradiation at P3. Scan bar=50μm in (A) applies to (B–D) (A’–D’) Scan bar=25μm in (A”) applies to (B”–D”).
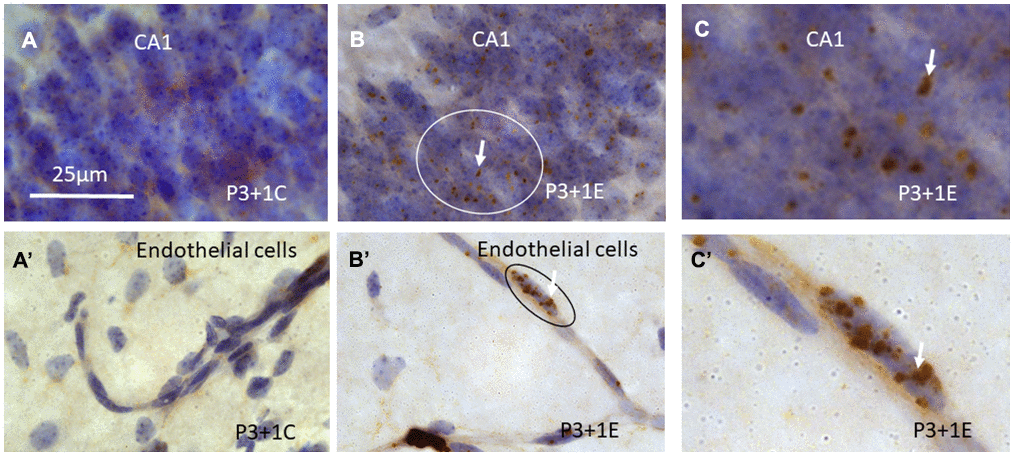
Figure 3. γH2AX immunostaining counterstained with hematoxylin shows that γH2AX foci are almost undetectable in the stratum pyramidale of CA1 area of the hippocampus (A) of P4 mice without irradiation. Irradiation with 5Gy induced obvious γH2AX foci (arrows) in the stratum pyramidale of CA1 area (B, C is magnified from the ellipse in B) at 1 day after irradiation at P3. Similarly, γH2AX foci are undetectable in the blood vessel of the hippocampus (A’) of P4 mice without irradiation. Irradiation induced obvious γH2AX foci (arrows) in the hippocampal blood vessel (B’, C’ is magnified from the ellipse in B’) at 1 day after irradiation at P3. Scan bar=25μm in (A) applies to (B–C) (A’–C’).
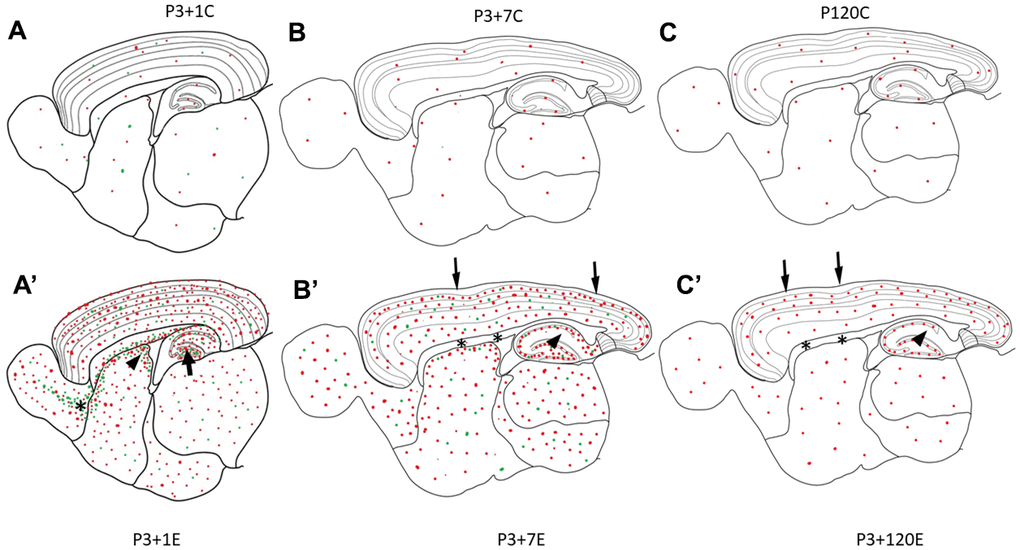
Figure 4. Diagrams (A–C) show γH2AX foci (red dots) in the brain of the control animal without irradiation. In P3+1C or P4 mouse brain, a few apoptotic bodies (green dots) randomly appear in different brain regions (A). One day after irradiation at P3, γH2AX foci (red dots) and apoptotic bodies (green dots) increase obviously in all brain regions (A’). Drastic increase of apoptotic bodies (green dots) appear in the hilus of the dentate gyrus (arrow), in the subventricular zone of the lateral ventricle (arrowhead) and in the rostral migratory stream (asterisk) (A’). Seven days after irradiation at P3, many γH2AX foci (red dots) and apoptotic bodies (green dots) still exist in all brain regions (B’). However, there was no obvious change of γH2AX foci in the pia mater (arrow), white matter (corpus callosum, asterisks), the strata laculosum moleculare, radiatum (arrow), oriens of CA1-3 areas, the stratum moleculare of the dentate gyrus (B’). One hundred-twenty days after irradiation at P3, there are still some γH2AX foci (red dots) still exist in all brain regions (C’) although the number of γH2AX foci is reduced obviously.
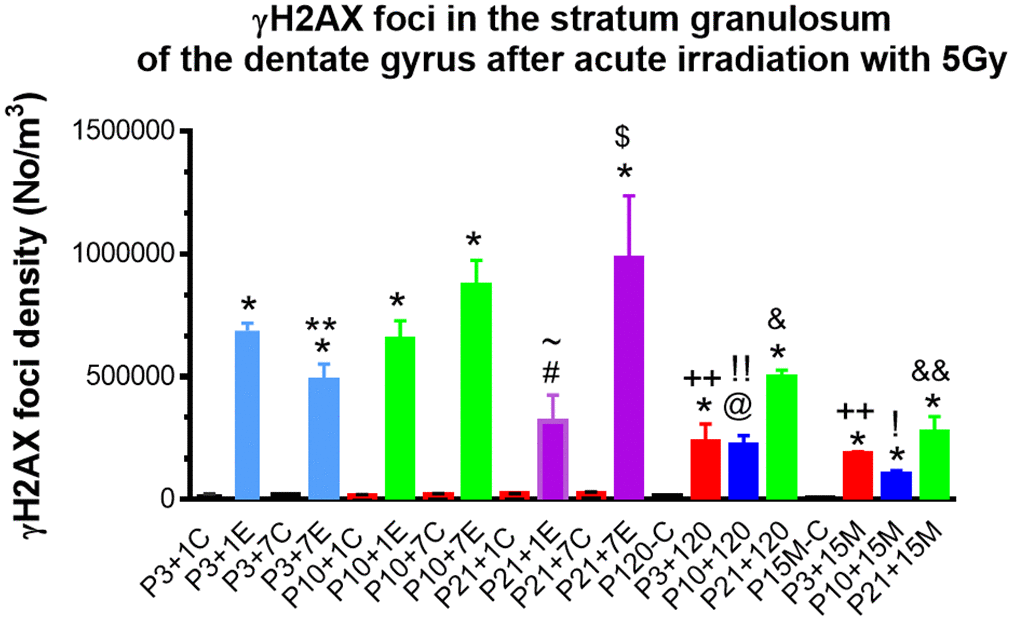
Figure 5. Quantitative analysis of γH2AX foci in the stratum granulosum of the dentate gyrus among experimental mice 1day, 7, 120 days and 15 months after irradiation with 5Gy at P3, P10 and P21 respectively. *P<0.001; @P<0.01 #P<0.05 compared to the age-matched control, &P<0.01 compared to P3+120 or P10+120; $P<0.05 compared to P21+1E; ~ P<0.05 compared to P3+1E, P10+1E; **P<0.05 compared to P3+1E and P3+7E; ++P<0.001 compared to P3+1E; !!P=0.001 compared to P10+1E; !P<0.01 compared to P10+1E; &&P< 0.05 compared to P21+120. C: Control, E: Experimental.
Table 1. γ-H2AX foci in the mouse brain at 1, 7, 120 days and 15 months after the acute irradiation at P3, P10 and P21.
| γ-H2AX | Neurogenesis and migration | Hippocampus | Cortex | Stri | Thal | BV | CC/EC |
| SVZ | RMS | OB | Hilus | Dentate gyrus (DG) | CA1-3 | I | II-IV | V-VI |
| SG | SM | SO | SP | SR-SLM |
| P3+1 C | +/- | +/- | +/- | +/- | +/- | +/- | +/- | +/- | +/- | +/- | +/- | +/- | +/- | +/- | +/- | +/- |
| P3+1 E | +++ | +++ | +++ | +++ | +++ | +++ | +++ | +++ | +++ | +++ | +++ | +++ | +++ | +++ | +++ | +++ |
| P3+7 C | +/- | +/- | +/- | +/- | +/- | +/- | +/- | +/- | +/- | +/- | +/- | +/- | +/- | +/- | +/- | +/- |
| P3+7 E | +++ | +++ | +++ | +++ | +++ | +/- | +/- | +++ | +/- | +++ | +++ | +++ | +++ | +++ | +/- | +/- |
| P10+1 C | +/- | +/- | +/- | +/- | +/- | +/- | +/- | +/- | +/- | +/- | +/- | +/- | +/- | +/- | +/- | +/- |
| P10+1 E | +++ | + | +++ | +++ | +++ | +/- | +/- | +++ | +/- | +/- | +++ | +++ | +++ | +++ | +/- | +/- |
| P10+7 C | +/- | +/- | +/- | +/- | +/- | +/- | +/- | +/- | +/- | +/- | +/- | +/- | +/- | +/- | +/- | +/- |
| P10+7 E | ++ | +/- | +++ | +++ | +++ | +/- | +/- | +++ | +/- | +/- | +++ | +++ | +++ | +++ | +/- | +/- |
| P21+1 C | +/- | +/- | +/- | +/- | +/- | +/- | +/- | +/- | +/- | +/- | +/- | +/- | +/- | +/- | +/- | +/- |
| P21+1 E | + | + | +++ | ++ | +++ | +/- | +/- | +++ | +/- | +/- | +++ | + | +++ | +++ | +/- | +/- |
| P21+7 C | +/- | +/- | +/- | +/- | +/- | +/- | +/- | +/- | +/- | +/- | +/- | +/- | +/- | +/- | +/- | +/- |
| P21+7 E | + | + | +++ | +++ | +++ | +/- | +/- | +++ | +/- | +/- | +++ | +++ | +++ | +++ | +/- | +/- |
| P+120C | +/- | +/- | +/- | +/- | +/- | +/- | +/- | +/- | +/- | +/- | +/- | +/- | +/- | +/- | +/- | +/- |
| P3+120 | + | + | + | +/- | +++ | +/- | +/- | +++ | +/- | +/- | ++ | + | +++ | + | +/- | +/- |
| P10+120 | + | + | + | +/- | +++ | +/- | +/- | +++ | +/- | +/- | ++ | ++ | +++ | + | +/- | +/- |
| P21+120 | + | + | + | +/- | +++ | +/- | +/- | +++ | +/- | +/- | ++ | ++ | +++ | + | +/- | +/- |
| MRI-P15M-C | +/- | +/- | +/- | +/- | +/- | +/- | +/- | +/- | +/- | +/- | +/- | +/- | +/- | +/- | +/- | +/- |
| MRI-P3+15M | + | + | + | +/- | ++ | +/- | +/- | + | +/- | +/- | + | + | + | + | +/- | +/- |
| MRI-10+15M | + | + | + | +/- | ++ | +/- | +/- | ++ | +/- | +/- | ++ | ++ | ++ | ++ | +/- | +/- |
| MRI-21+15M | + | +++ | +++ | +/- | +++ | +/- | +/- | +++ | +/- | +/- | +++ | +++ | +++ | +++ | +/- | +/- |
| BV: Blood Vessel; CC: corpus callosum; EC: Ependymal cells; OB: olfactory bulb; RMS: rostral migratory stream; SM: Stratum moleculare; SG: stratum granulosum; SP: stratum pyramidale; SR-SLM: Stratum radiatum and stratum laculosum moleculare; Stri: striatum; SVZ: subventricular zone; Thal: Thalamus; Per screen size under 400x for counting γ-H2AX foci: 310μm x 230μm; per screen foci: +++: > 10 foci; ++: 5-10 foci; +: 2-5 foci; +/-: 0<γ-H2AX<2. C: Control, E: Experimental. |
In the subventricular zone (SVZ), rostral migratory stream (RMS) and temporal migratory stream (TMS) (Figures 2A’, 2C’, 2A”, 2C”) and olfactory bulb (OB), the subgranular zone (SGZ) of the dentate gyrus (Figure 2B’, 2B”), in the principal neurons in the strata pyramidale (Figure 3B, 3C) and granulosum and interneurons in other layers of the hippocampus, at the border between dorsal hippocampus and corpus callosum (Figure 2D’, 2D”), many γH2AX foci were also found. Hematoxylin-stained apoptotic bodies or pyknotic nuclei were observed in different brain regions, in particular, in those parts that are involved in neurogenesis and neuronal migration, i.e., SVZ, SGZ, OB, RMS and TMS (Figure 2A’–2D’, Figure 2A”–2D”).
Seven days (P3+7) after irradiation with 5 Gy at P3, many γH2AX foci still existed in the most of the brain regions. However, no γH2AX foci appeared in the pia mater, white matter, the stratum moleculare of the dentate gyrus, strata laculosum moleculare, radiatum, oriens of CA1-3 areas of the hippocampus and cerebrovascular system (Table 1).
Irradiation at P10 or P21
One day after irradiation at P10 or P21, many γH2AX foci were observed in the layers II to VI of the DPall, in the stratum pyramidale of CA1-3 areas and stratum granulosum of the dentate gyrus in MPall (Table 1). They were also found in the brain regions involved in neurogenesis and neuronal migration, i.e., SVZ, SGZ, olfactory bulb (OB), rostral migratory stream (RMS) and temporal migratory stream (TMS) (TelA) and CSPall. Increased γH2AX foci were also demonstrated in the striatum and thalamus. However, there was no obvious change of γH2AX foci in the pia mater, white matter, the stratum moleculare of the dentate gyrus, strata laculosum moleculare, radiatum, oriens of CA1-3 areas of the hippocampus in MPall and in the cerebrovascular system (Table 1). These changes were similar to those occurred at 7 days after irradiation at P3. At 7 days after irradiation at P10, there was similar patterns of γH2AX foci distribution to 1 day after irradiation.
Four months (120 days) after irradiation with 5 Gy at P3, P10 and P21, some γH2AX foci or PDDF could still be observed in the layers II-III of cortex (Figure 6A), the stratum granulosum of the dentate gyrus (Figure 6B), and the stratum pyramidale of CA1-3 areas of the hippocampus (Figure 6C). γH2AX foci were almost undetectable in the corpus callosum although these foci still existed in the striatum (Figure 6E), thalamus (Figure 6F), olfactory bulb (Figure 6G) and subventricular zone of the lateral ventricle (Figure 4, Figure 6H) (Table 1) although the number of γH2AX foci was decreased when compared to those at 1 and 7 days after radiation exposure.
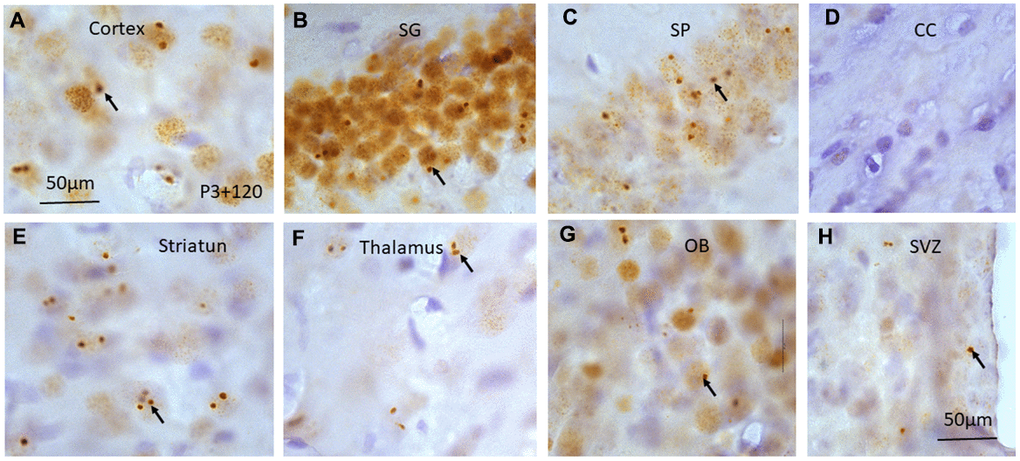
Figure 6. γH2AX immunostaining counterstained with hematoxylin shows irradiation-induced γH2AX foci (arrows) in different brain regions including cortex (A), stratum granulosum of the dentate gyrus (B), stratum pyramidale of CA1 area of the hippocampus (C), corpus callosum (CC) (D), striatum (E), thalamus (F), olfactory bulb (G) and subventricular zone of the lateral ventricle (H) at 120 days after irradiation at P3. Scan bar=50μm in (A) applies to (B–H).
Fifteen months (15M) after irradiation at P3, P10 and P21, similar γ-H2AX foci or PDDF could be observed as those at 120 days in the layers II-III of cortex (Figure 7A). They were also noted in the stratum granulosum of the dentate gyrus (Figure 7B), and the stratum pyramidale of CA1-3 areas of the hippocampus (Figure 7C), in the striatum (Figure 7D), thalamus (Figure 7E), olfactory bulb (Figure 7F) (Table 1). It suggested that γ-H2AX foci might be localized in those neurons involved in major brain activities such as sensation, locomotor, and learning and memory.
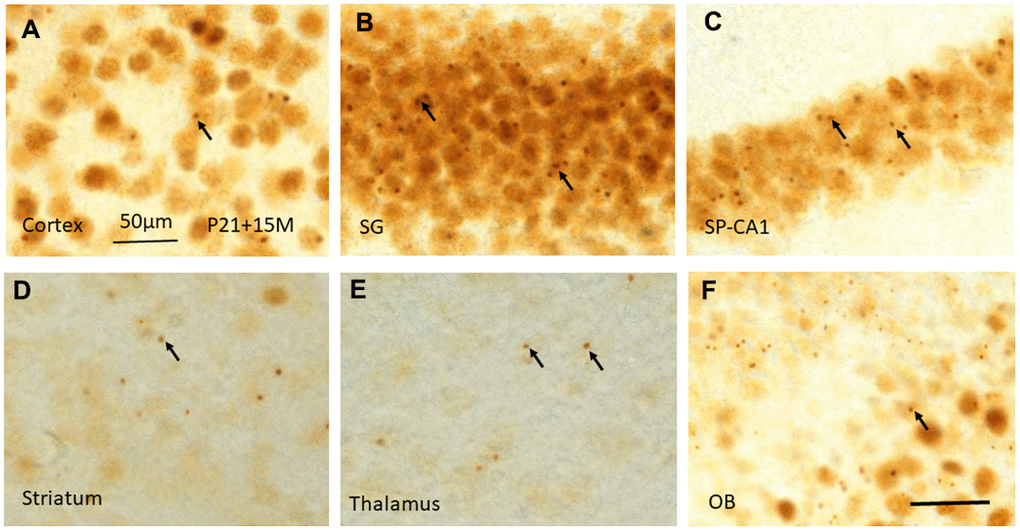
Figure 7. γH2AX immunostaining shows irradiation-induced γH2AX foci (arrows) in different brain regions including cortex (A), stratum granulosum of the dentate gyrus (B), stratum pyramidale of CA1 area of the hippocampus (C), striatum (D), thalamus (E), and olfactory bulb (F) at 15 months after irradiation at P21. Scan bar=50μm in (A) applies to (B–F).
γH2AX foci in the stratum granulosum of the dentate gyrus
Quantitative study of γH2AX foci in the stratum granulosum of the dentate gyrus among experimental mice 1 day, 7, 120 days and 15 months after irradiation with 5Gy at P3 indicated a significant change of the number of γH2AX foci (P<0.001 by One-way analysis of variance (ANOVA)). Student’s t-test showed a significant reduction of γH2AX foci from 1 day, 7 days to 120 days (P<0.05, by a Student’s t-test). However, no significant change in the number of γH2AX foci was observed from 120 day to 15 months after irradiation (P>0.05) (Figure 5).
The number of γH2AX foci in the stratum granulosum of the dentate gyrus among experimental mice 1 day, 7, 120 days and 15 months after irradiation with 5Gy at P10 was also changed significantly (P<0.01 by One-way ANOVA). Student’s t-test showed no significant difference in the number of γ-H2AX foci between 1 day and 7 days after irradiation at P10 (P>0.05), the number of γ-H2AX foci decreased significantly at 120 days after irradiation at P10 when compared to those at P1 and P7 day(s) after irradiation (P<0.01). From 120 days to 15 months after irradiation, the number of γ-H2AX foci in the stratum granulosum did not change significantly. There was also a significant change in the number of γ-H2AX foci in the stratum granulosum of the dentate gyrus among experimental mice 1 day, 7, 120 days and 15 months after irradiation with 5Gy at P21 (P<0.05 by One-way ANOVA). From 1 day to 7 days after irradiation at P21, the number of γ-H2AX foci increased significantly (P<0.5%). However, no difference in the number of γ-H2AX foci in the stratum granulosum at 120 days after irradiation at P21 when compared to those at P1 and P7 day(s) (P>0.05). A significant reduction of γ-H2AX foci in the stratum granulosum from 120 days to 15 months occurred (P<0.05) (Figure 5).
The number of γ-H2AX foci in the stratum granulosum of the dentate gyrus among experimental mice 1 day after irradiation with 5 Gy at P3, P10 and p21 was also changed significantly (P<0.01by One-way ANOVA). Student’s t-test showed no significant difference in the number of γ-H2AX foci at 1 day after irradiation at P3 and P10 (P>0.05). However, a significant reduction of the number of γ-H2AX foci occurred at 1 day after irradiation at P21 when compared to those at P3 and P10 respectively (P<0.05) (Figure 5).
From 120 days to 15M after irradiation at P3 and P10, no significant change of γ-H2AX foci in the stratum granulosum of the dentate gyrus was observed (P>0.05). However, a significant reduction of γ-H2AX foci from 120 days to 15M was found after irradiation at P21 (P<0.05) (Figure 5).