


Introduction
Bladder cancer is the 2nd most common tumor in urinary system. There are 549,000 new cases of bladder cancer in the world, and 200,000 people die from this disease each year [1]. About 30% of patients are initially diagnosed with muscle-invasive bladder cancer (MIBC) [2]. Radical cystectomy complemented with chemotherapy is the main treatment option for MIBC, particularly for high-risk patients. The adjuvant chemotherapy can effectively repress the growth and prevent the recurrence of tumor [3, 4]. Cisplatin (DDP) and gemcitabine (GEM) chemotherapy (GC chemotherapy) is used as the first-line treatment for patients with advanced MIBC. However, the response rate to platinum-based regimens does not exceed 50% [3]. Multi-drug resistance (MDR) is the main cause of the failure in cancer chemotherapy and is essential for cancer metastasis and recurrence [5–8]. The potential mechanisms of MDR currently consists of the ABC transporter family, miRNA regulation, cancer stem cell initiation and so on [9]. Intracellular drug transport, as the primary mechanism of MDR in cancer cells, is mediated by MDR related genes, like P-glycoprotein (P-GP) and MDR-associated protein 1 (MRP1) [10, 11]. However, the molecular mechanism underpinning the modulation of MDR related genes is still largely unclear.
MiRNAs are non-coding ~22 nucleotide RNAs that regulate genes expression at post-transcriptional level. As another important mechanism of MDR, miRNAs take part in MDR regulation by modulating target genes [9]. For instance, miR-19a/b is upregulated in gastric cancer and regulated MDR by inhibiting PTEN [12]. Ectopic miR-153 in colorectal cancer mediated drug resistance by targeting forkhead box O3a (FOXO3a) [13]. Hence, the role of miRNA regulation in MDR, especially in MDR related genes, deserves to be further explored.
B-cell specific Moloney murine leukemia virus integration region 1 (BMI1) is the main component of the polycomb group complex 1 (PRC1), which functions as an important epigenetic inhibitor of various regulatory genes associated with chemoresistance, embryogenesis, self-renewal, senescence and so on [14–18]. BMI1 is an oncogene and its aberrant expression is associated with numerous cancers and resistance to certain chemotherapies, which confers poor prognosis [19–21]. Many studies have demonstrated that BMI1 can stimulate cancer initiation [22], cell transformation [23] as well as induce epithelial–mesenchymal transition [24–26]. Inhibiting BMI1 can make cancer cells sensitive to chemotherapy through induction of AKT-mediated apoptosis pathway [27–29]. In bladder cancer, BMI1 reduction inhibits cell proliferation, migration, invasion [30, 31], stemness properties and tumorigenicity [32, 33]. In our previous research, elevated BMI1 expression in bladder cancer was correlated with poor overall survival [34]. Further biological analyses of The Cancer Genome Atlas (TCGA) database revealed BMI1 was increased in bladder cancer patients resistant to chemotherapy, which confers tumor relapse and progression. The oncogenic role of BMI1 in chemoresistance of bladder cancer deserves to be further characterized.
This research investigated the oncogenic roles of BMI1 in GC-chemoresistant bladder cancer and potential functions of miRNAs in BMI1-mediated activation of P-GP in chemoresistant bladder cancer.
Materials and Methods
Cell culture and establishment of resistant cell line
T24 and BIU-87 cells were purchased from American Type Culture Collection (ATCC) and were cultured base on the instructions. T24 cells were grown in McCoy's 5A modified medium (Gibco, Grand Island, NY, USA, Cat. No. 16600082) and BIU-87 cells were grown in RPMI-1640 (Gibco, Cat. No. 22400071) with of 10% fetal bovine serum added (FBS, Biofluids, Camarillo, CA, USA). All bladder cancer cells were cultured in the atmosphere of 5% carbon dioxide at 37° C.
To isolate cisplatin- and gemcitabine-resistant T24 cells, 2 × 10⁷ cells were seeded in medium supplemented with cisplatin (DDP) at 0.05 μg/ml and incubated for 24h. The residual living cells were expanded over 3 days without DDP followed by treatment with gemcitabine (GEM) at 0.2 μg/ml for 24h. The residual viable cells were expanded over 3 days in normal medium. A second and third round of selection was performed in a similar manner with increasing concentration of DDP and GEM. Finally, the resistant cells could be stably cultured in medium with DDP at 0.5 μg/ml or GEM at 2.5 μg/ml.
Clinical tissues and patient information
240 paraffin sections of bladder cancer tissues and 8 fresh bladder cancer specimens were collected at Sun Yat-Sen University Cancer Center from 2000 to 2010. The clinical data of these specimens are shown in Table 1. Prior informed consents were obtained from patients and the approvals by the Institutional Research Ethics Committee were gained.
Table 1. Correlation between BMI1 expression and clinicopathological characteristics of 240 bladder cancer specimens.
| Characteristics | BMI1 | P-value | ||
| Higher expression | Lower expression | |||
| BMI expression | - | 118 | 122 | - |
| Gender | male | 80 | 87 | 0.55 |
| female | 38 | 35 | ||
| Age (years) | ≤ 65 | 55 | 59 | 0.76 |
| > 65 | 63 | 63 | ||
| No. of tumors | single | 90 | 92 | 0.87 |
| multiple | 28 | 30 | ||
| Stage | T2 | 5 | 12 | < 0.001 |
| T3 | 45 | 67 | ||
| T4 | 68 | 33 | ||
| Grade | low | 41 | 80 | < 0.001 |
| high | 77 | 42 | ||
| Lymph node | positive | 61 | 43 | 0.005 |
| negative | 40 | 70 | ||
| not available | 17 | 19 | ||
Immunohistochemistry
Immunohistochemical analysis (IHC) was carried out in 240 human bladder cancer tissues using an anti-BMI1 (Abcam, Cat. No. ab126783) and anti-P-GP (Abcam, Cat. No. ab170904) as described previously [35, 36]. The immunostaining degree of paraffin sections was evaluated and averaged by two independent researchers, who were not informed of histopathological characteristics and patients’ information. The positive degree of staining was assessed: 0 (no positive tumor cells (PTCs)), 1 (<10% PTCs), 2 (10-50% PTCs), and 3 (>50% PTCs). The intensive degree of staining was estimated: 0 (no staining), 1 (weak, light yellow), 2 (moderate, yellowish brown), and 3 (strong, brown). The staining index (SI) was calculated: staining index = staining intensity × proportion of positive tumors staining. According to the heterogeneity measurement of relapse-free survival rate by log-rank test statistics, the cut-off value was selected to define the high or low expression of BMI1. An optimal cut-off value was determined. The SI ≥ 6 was defined as high-expressing tumours, and the SI < 6 was defined as low-expressing tumours.
Cell proliferation/cytotoxicity test
Cells were treated with/without DDP or GEM at indicated concentration for 48 hours. At the end of drug exposure, 10 μl Cell Counting Kit-8 (BS350A, Biosharp, Hefei, Anhui, China) solutions were supplemented to each well including 100 μl medium. After 1.5-hour incubation absorbance was measured at 450 nm.
Cell cycle assay
Wash cells twice by ice-cold phosphate buffer saline and fix them overnight with cold 70% ethanol. And then the cells were mixed with 100 μg/ml propidium iodide (PI) and incubated in dark for 30 minutes. Upon addition with 400 μl phosphate buffer saline, cells were analyzed by flow cytometry for cycle detection.
Dye efflux test
The cells in six-well plates were washed twice by phosphate buffer saline. Then cells were incubated with 2 μg/ml rhodamine 123 (Sigma-Aldrich, Cat. No. R8004) in the dark for 30 minutes. After that, cells were visualized by inverted fluorescence microscope every 10 min or analyzed by flow cytometry for detection of fluorescence levels of rhodamine 123. The experiments were carried out in triplicate. The experimental results were consistent and considered to be statistically significant.
Annexin V apoptosis assay
The apoptosis detecting kits (KeyGEN Biotech, Nanjing, China) were applied to detect tumor cell apoptosis. In short, cells were implanted in a six-well plate, cultured for 24 h and supplemented with at 5 μg/ml or GEM at 25 μg/ml. The cells were added with 5 μl Annexin V-FITC, and then treated with 5 μl PI reagents. Upon addition of 400 μl phosphate buffer saline, the cells were examined by flow cytometry to detect apoptosis cells. Annexin V-FITC-positive but PI-negative cells were regarded as apoptosis cells.
Real-time quantitative reverse transcription (qRT-PCR)
Extract RNA from cells or bladder cancer tissues using TRIzol reagent (Invitrogen). Transcribe reversely RNA with a miRNA 1st-Strand Synthesis Kit (TaKaRa, Cat.NO.638313) for miRNA detection. The qRT-PCR for miRNA was carried out on an Mx3005P thermal cycler using a PCR kit (TaKaRa, Cat. NO. RR820A). Sample intensities were normalized to RNU6B snRNA abundance. Data were analyzed using Applied Mx3005P Software and using the relative cycles to threshold method. The primer used for detecting miR-3682-3p expression was listed as follows: TGATGATACAGGTGGAGGTAGGT.
Western blotting (WB) analysis
WB was carried out base on the standard protocol, as mentioned earlier [37]. The primary antibodies were applied as followed: anti-BMI1 (Abcam, Cat. No. ab126783), anti-P-GP (Abcam, Cat. No. ab170904) and anti-p53 (Abcam, Cat. No. ab1101). Glyceraldehyde-3-phosphate dehydrogenase (GAPDH, Proteintech, Cat. No. 60004-1-Ig) was used as a loading control.
Plasmids, retrovirus infection, and transduction
BMI1 gene was amplified by PCR from cDNA and cloned into pSin-EF2 vectors. Three BMI1-targeting shRNA sequences (RNAi#1: AGAACAGATTGGATCGGAA; and RNAi#2: AGACCACTACTGAATATAA; RNAi#3: TACATTTATACCTGGAGAA) were cloned into SUPER.retro.puro vectors (OligoEngine, USA) to construct the respective pSUPER.retro.BMI1-RNAi(s). T24 or BIU-87 cells were seeded in the P100 plate, and then transducted with 10 μg plasmids. Cell lines stably expressing BMI1 or BMI1 shRNA were constructed through retrovirus infection of HEK293T cells and selected using 0.5 mg/ml puromycin.
CRISPR/cas9 generation of BMI1−/− cells
Lentiviral CRISPR–Cas9 vectors that mediated BMI1 gene editing were purchased from Beyotime Biotechnology (Beyotime, Shanghai, China). The targeted sequence of sgRNA was GACAATACTTGCTGGTCTCC. After 48h lentiviral transfection, cells were screened using puromycin. To screen for clones with BMI1 gene disruption, total genomic DNA was extracted and genomic PCR of BMI1 gene was performed with primers: forward: 5'-CCACCTGATGTGTGTGCTTTG-3'; reversed: 5'-TTCAGTAGTGGTCTGGTCTTGT-3'. PCR products were analysed on 1% agarose gel supplemented with ethidium-bromide and immunoblots were performed to confirm BMI1 depletion.
miRNA microarray assay analysis
miRNA expression profiles of two different cell samples (T24/DDP&GEM vs. T24/DDP&GEM-sgBMI1 cells) were established by SHBIO Technology Corporation (Shanghai, China). The procedures were carried out base on manufacturer's recommendations.
Prediction of miRNAs targeting ABCB1 gene
MiRWalk 2.0, a comprehensive database of predicted and validated miRNA-target interactions, was used to predict the binding sites by microRNAs in 3’-UTR of ABCB1 gene [38].
Luciferase reporter test
293T cells were implanted in 96-well plate for 24h. ABCB1 3’-UTR-luciferase plasmid and renilla plasmid (Promega) were transducted into cells with lipofectamine 3000 (Invitrogen). Then the luciferase and renilla signals were detected with Dual Luciferasel Reporter Test Kit (Promega) base on the protocols.
Co-immunoprecipitation (co-IP) assay
The indicated cells were lysed, and then immunoprecipitated by anti-BMI1 (Abcam, Cat. No. ab126783) and anti-p53 (Abcam, Cat. No. ab1101) antibodies. Then the immune complexes were detected by anti-BMI1 (Abcam, Cat. No. ab126783) and p53 (Abcam, Cat. No. ab1101) antibodies, and visualized with an ECL analysis system.
Chromatin immunoprecipitation (ChIP)
ChIP test was carried out with an EZ ChlP Kit (Abcam, Cambridge, MA, USA, Cat. No. ab500) base on the protocol. In short, 5×10⁶ cells were cross-linked with 1% formaldehyde for 15 minutes. Cross-linked chromatin was sonicated and then incubated using anti-IgG, anti-p53 (Abcam, Cat. No. ab1101), anti-BMI1 (Abcam, No. ab126783) or anti-H2AK119ub1 (CST, Cat. No. 8240). The immunoprecipitated DNA was purified and quantified by RT-PCR to detect the binding level of p53, which was standardized to 0.5% input. The primer used for ChlP test was listed below: miR-3682-3p promoter:
5'-GGTTTACAGATAAGACTGGGAATG-3',
5'-CTTTCTGCCCATTTCCAC-3'.
Statistical analysis
The statistical methods contained t test, Fisher’s exact test, χ2 test and log-rank test. Univariate and multivariate analyses were used with a Cox regression model. Statistical analysis was carried out using SPSS 11.0 software. The data represented mean ± SD; P ≤ 0.05 was considered to be statistically significant.
Results
Ectopic BMI1 in bladder cancer tissues from patients resistant to chemotherapy correlated with poor prognosis
In our previous research, elevated BMI1 expression was related to poor overall survival in bladder cancer [34]. For further investigating the regulation role of BMI1 in human bladder cancer, we firstly analysed BMI1 levels in bladder cancer tissues from TCGA-bladder urothelial carcinoma (BLCA) database. According to the available clinical information from TCGA-BLCA dataset, 102 patients with complete response to chemotherapy and 13 patients with partial response to chemotherapy were included for analysis. Here, patients with complete response to chemotherapy were defined as chemo-sensitive patients, while patients with partial response to chemotherapy were defined as chemo-resistance. BMI1 expression was significantly elevated in 13 patients resistant to chemotherapy compared with that in 102 patients sensitive to chemotherapy (Figure 1A), suggesting the association of BMI1 with chemoresistance. In particular, patients with high BMI1 levels had a worse relapse-free survival rate than patients with low BMI1 levels (Figure 1B). These data suggested that ectopic BMI1 may be an indicator of chemoresistance and poor prognosis of bladder cancer.
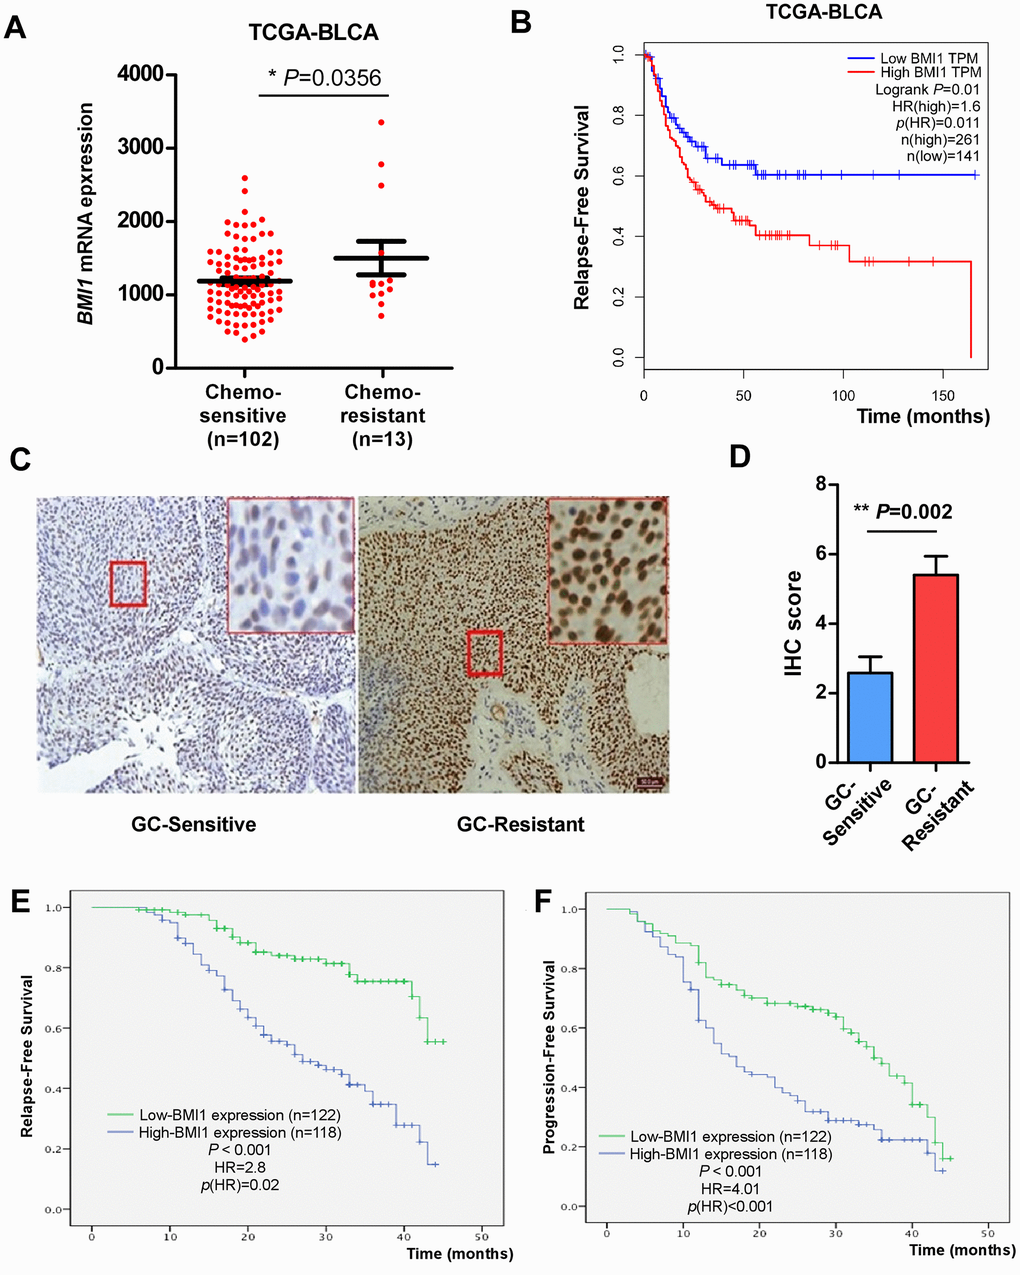
Figure 1. Elevated BMI1 in GC-chemoresistant bladder cancer conferred poor prognosis. (A) BMI1 mRNA expression in bladder cancer tissues of patients partial response to chemotherapy versus patients complete response to chemotherapy from TCGA-BLCA database. (B) Relapse-free survival of patients in TCGA-BLCA dataset with low versus high levels of BMI1 mRNA. (C) IHC analysis of BMI1 protein expression in bladder cancer tissues of patients resistant to GC chemotherapy and that sensitive to GC chemotherapy, magnification, ×200 & ×400. (D) Statistical quantification of the IHC score of BMI1 staining in bladder cancer specimens from patients resistant versus sensitive to GC chemotherapy. (E) Relapse-free survival of patients with bladder cancer with low versus high BMI1 expression. (F) Progression-free survival of patients with bladder cancer with low versus high BMI1 expression. *P < 0.05. GC: Cisplatin and Gemcitabine; TCGA: The Cancer Genome Atlas; BLCA: Bladder Urothelial Carcinoma; IHC: Immunohistochemistry; TPM: Transcripts Per Million.
In order to verify the above analysis, we examined BMI1 expression in 240 archived, paraffin-embedded bladder cancer specimens using IHC staining. Consistently, the level of BMI1 in tumor tissues from patients resistant to GC chemotherapy was significantly higher than that sensitive to GC chemotherapy (Figure 1C). Quantitative IHC score analysis further corroborated the elevated BMI1 expression in bladder cancer tissues from patients resistant to GC chemotherapy (Figure 1D).
The association of BMI1 level and the clinicopathologic characteristics of bladder cancer were further evaluated among 240 bladder cancer specimens. 118 (49.17%) had high BMI1 expression, while 122 (50.83%) had low BMI1 expression (Table 1). The statistical analyses indicated that upregulated BMI1 expression was related to higher clinical stage, grade and lymph node (LN) metastasis (P < 0.01), but not with gender, age or multiplicity (Table 1). BMI1 expressions in bladder cancer tissues were inversely related to relapse-free survival (P < 0.001, Figure 1E) and progression-free survival (P < 0.001, Figure 1F). Furthermore, the expression level of BMI1 was an independent prognosis factor for bladder cancer (P < 0.05) similar to clinical grade, stage, multiplicity and LN metastasis (Tables 2, 3). Taken together, BMI1 upregulation in bladder cancer involves in chemoresistance and is related to poor prognosis for bladder cancer.
Table 2. Univariate and multivariate analyses of tumor-specific mortality in patients with bladder cancer by cox-regression analysis.
| Characteristics | Univariate | Multivariate | |||
| HR (95%CI) | P-value | HR (95%CI) | P-value | ||
| Gender: male, female | 0.85 (0.62, 1.11) | 0.361 | - | - | |
| Age (years): ≤ 65, > 65 | 0.81 (0/62, 1.02) | 0.141 | - | - | |
| No. of tumors: single, multiple | 3.17 (1.76, 5.37) | 0.021 | 2.57 (1.62, 3.13) | 0.022 | |
| Stage: T2, T3, T4 | 3.56 (1.63, 4.93) | 0.011 | 3.13 (1.29, 5.61) | 0.003 | |
| Grade: low, high | 2.77 (1.32, 4.05) | 0.033 | 2.99 (1.73, 5.03) | 0.035 | |
| Lymph node: negative, positive | 3.79 (2.32, 5.29) | 0.001 | 3.58 (1.93, 6.02) | 0.003 | |
| BMI1 expression | 2.81 (1.61, 4.02) | 0.019 | 2.73 (1.93, 3.85) | 0.013 | |
Table 3. Univariate and multivariate analyses of tumor progression in patients with bladder cancer by cox-regression analysis.
| Characteristics | Univariate | Multivariate | |||
| HR (95%CI) | P-value | HR (95%CI) | P-value | ||
| Gender: male, female | 0.94 (0.81, 1.09) | 0.213 | - | - | |
| Age (years): ≤ 65, > 65 | 0.84 (0.67, 1.19) | 0.421 | - | - | |
| No. of tumors: single, multiple | 1.93 (1.51, 3.07) | 0.021 | 1.73 (1.24, 2.39) | 0.047 | |
| Stage: T2, T3, T4 | 2.85 (1.79, 4.21) | < 0.001 | 2.39 (1.88, 3.77) | 0.003 | |
| Grade: low, high | 1.45 (1.03, 1.93) | 0.043 | 2.33 (1.66, 3.30) | 0.041 | |
| Lymph node: negative, positive | 3.72 (1.99, 5.35) | < 0.001 | 2.79 (1.53, 4.33) | 0.001 | |
| BMI1 expression | 4.01 (2.01, 7.31) | < 0.001 | 3.03 (1.73, 5.37) | 0.005 | |
Inhibition of BMI1 up-regulation reversed the chemoresistance in T24/DDP&GEM cells
In order to better mimic the characteristics of clinical bladder cancer resistant to GC chemotherapy, we established a bladder cancer cell lines, named T24/DDP&GEM, resistant to cisplatin and gemcitabine by alternately exposing T24 cells to cisplatin or gemcitabine. The drug resistance of T24/DDP&GEM cells was confirmed by cell proliferation and apoptosis assays upon treatment with cisplatin or gemcitabine (Figure 2A, 2B). The half maximal inhibitory concentration (IC50) of T24/DDP&GEM cells for cisplatin and gemcitabine was significantly increased compared with T24 cells (Table 4). Of note, BMI1 expression was significantly higher in resistant T24/DDP&GEM cells than that in T24 cells (Figure 2C), which was consistent with the elevated BMI1 expression in bladder cancer tissues of patients resistant to GC chemotherapy. These data supported the crucial role of BMI1 in GC chemoresistant bladder cancer.
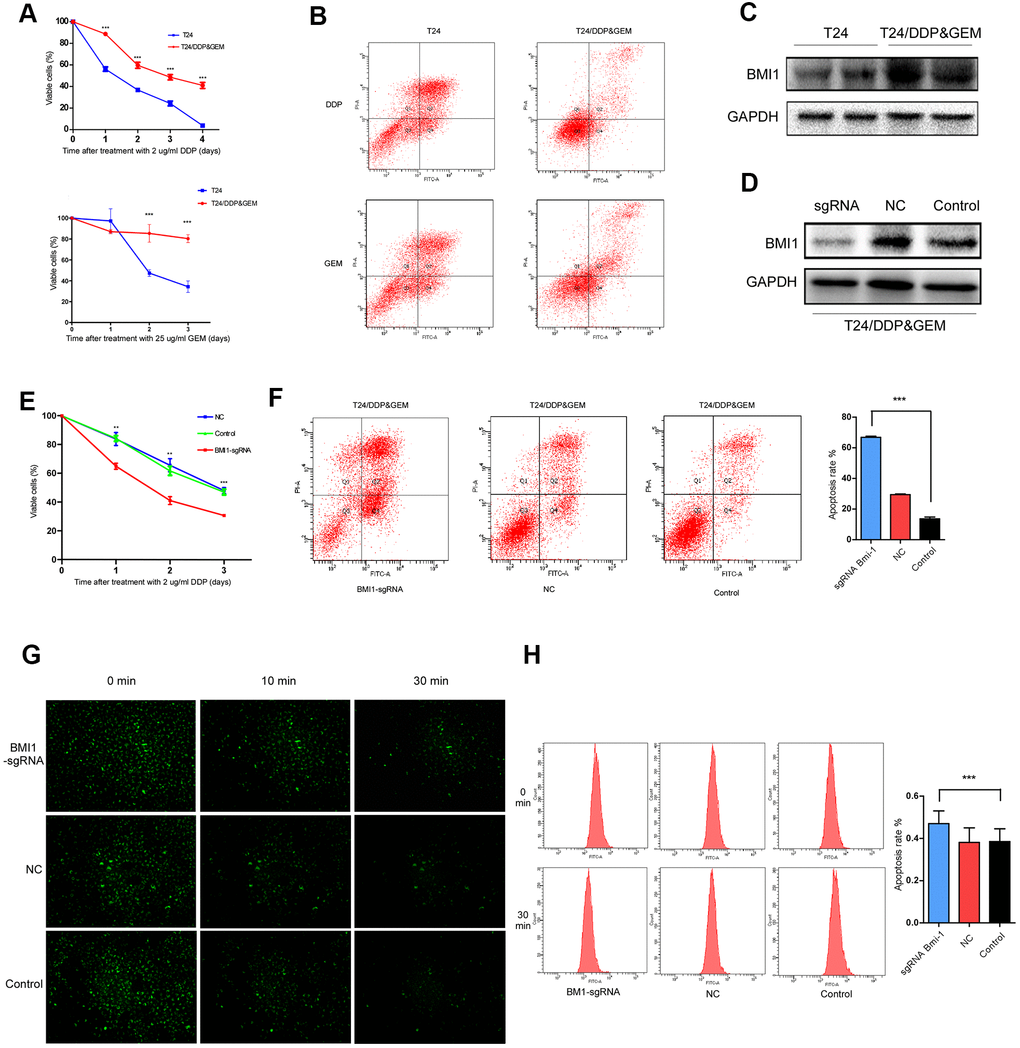
Figure 2. Inhibition of BMI1 overexpression reversed the chemoresistance in GC-resistant T24 cells. (A) Cell proliferation changes of T24 and T24/DDP&GEM cells assessed by cell counting kit-8 assays after treatment with 2 μg/ml DDP or 25 μg/ml GEM. (B) Apoptosis of T24 and T24/DDP&GEM cells detected by the Annexin V/flow cytometric apoptosis assay after treatment with 2 μg/ml DDP or 25 μg/ml GEM. (C) Western Blot analysis of BMI1 protein in T24 and T24/DDP&GEM cells. (D) Western Blot detection of BMI1 protein in T24/DDP&GEM cells upon BMI1 knockout using CRISPR/Cas9 system. (E) Cell proliferation changes of T24/DDP&GEM cells upon knockout of BMI1 were assessed by cell counting kit-8 assays after treatment with 2 μg/ml DDP. (F) Apoptosis of T24/DDP&GEM-sgBMI1 and T24/DDP&GEM cells detected by the Annexin V/flow cytometric apoptosis assay after treatment with 2 μg/ml DDP. (G) Under observation in inverted fluorescence microscope, the fluorescent intensity of dye in indicated cells after transfection with rhodamine 123. (H) The retention rate of rhodamine 123 dye in down-regulating BMI1 or vector control T24/DDP&GEM cells detected by flow cytometry. *P < 0.05. **P < 0.01. ***P < 0.001. GC: cisplatin and gemcitabine; DDP: cisplatin; GEM: gemcitabine.
Table 4. The half maximal inhibitory concentration (IC50) values and resistance index (RI) of T24/DDP&GEM and T24 cells.
| Cells | IC50 (μg/ml) | ||||||||||||||||||||||||||||||||||||||||||||||||||||||||||||||||||||||||||||||||||||||||||||||||||
| Cisplatin | Gemcitabine | ||||||||||||||||||||||||||||||||||||||||||||||||||||||||||||||||||||||||||||||||||||||||||||||||||
| T24/DDP&GEM | 4.93 ± 0.42 | 45.97 ± 3.35 | |||||||||||||||||||||||||||||||||||||||||||||||||||||||||||||||||||||||||||||||||||||||||||||||||
| T24 | 1.16 ± 0.24 | 0.73 ± 0.12 | |||||||||||||||||||||||||||||||||||||||||||||||||||||||||||||||||||||||||||||||||||||||||||||||||
| RI (T24/DDP&GEM : T24) | 4.25 | 62.97 | |||||||||||||||||||||||||||||||||||||||||||||||||||||||||||||||||||||||||||||||||||||||||||||||||
| DDP: Cisplatin; GEM: Gemcitabine; T24/DDP&GEM cells: cisplatin- and gemcitabine-resistant T24 cells. | |||||||||||||||||||||||||||||||||||||||||||||||||||||||||||||||||||||||||||||||||||||||||||||||||||
For further investigating the biological role of BMI1 in GC chemoresistant bladder cancer, we knock-downed BMI1 in T24/DDP&GEM cells, which was named T24/DDP&GEM-sgBMI1 cells using CRISPR/Cas9 system (Figure 2D). Intriguingly, BMI1 knockdown reversed the chemoresistance of T24/DDP&GEM cells. Depletion of BMI1 reduced viability and promoted apoptosis of T24/DDP&GEM cells when treated with cisplatin (Figure 2E, 2F). Under observation in inverted fluorescence microscope, the fluorescent intensity of rhodamine 123 dye was decreased more slowly in T24/DDP&GEM-sgBMI1 cells than that in T24/DDP&GEM cells (Figure 2G). Consistently, the retention rate of fluorescent dye was elevated in T24/DDP&GEM-sgBMI1 cells as detected by flow cytometry (Figure 2H), which suggested that BMI1 mediated chemoresistance of bladder cancer probably via promotion of drug efflux.
BMI1 enhanced the chemoresistance in bladder cancer cells
For investigating the roles of BMI1 in bladder cancer chemoresistance, we knock-downed or overexpressed BMI1 in T24 and BIU-87 cells, respectively (Figure 3A, 3B). Upon treatment with cisplatin, BMI1-overexpressing cells presented a higher viability and lower apoptosis as assessed by the cell counting kit-8 analysis (Figure 3C) and Annexin V/flow cytometry apoptosis assay (Figure 3E), whereas BMI1-downregulating cells reduced the viability and increased the apoptosis rate (Figure 3D, 3F). These results indicated that BMI1 could enhance chemoresistance of bladder cancer cells, while BMI1 knockout could increase the sensitivity to chemotherapy. Furthermore, as detected by flow cytometry, the retention rate of fluorescent dye rhodamine 123 was significantly decreased in BMI1-overexpressing cells (Figure 3G), whereas significantly increased in BMI-silenced cells (Figure 3H). These findings supported the above-mentioned viewpoint that BMI1 increased chemoresistance probably via promotion of drug efflux, which was associated with ABC transporter family. Taking together, BMI1 knockdown reversed the chemoresistance of T24/DDP&GEM cells.
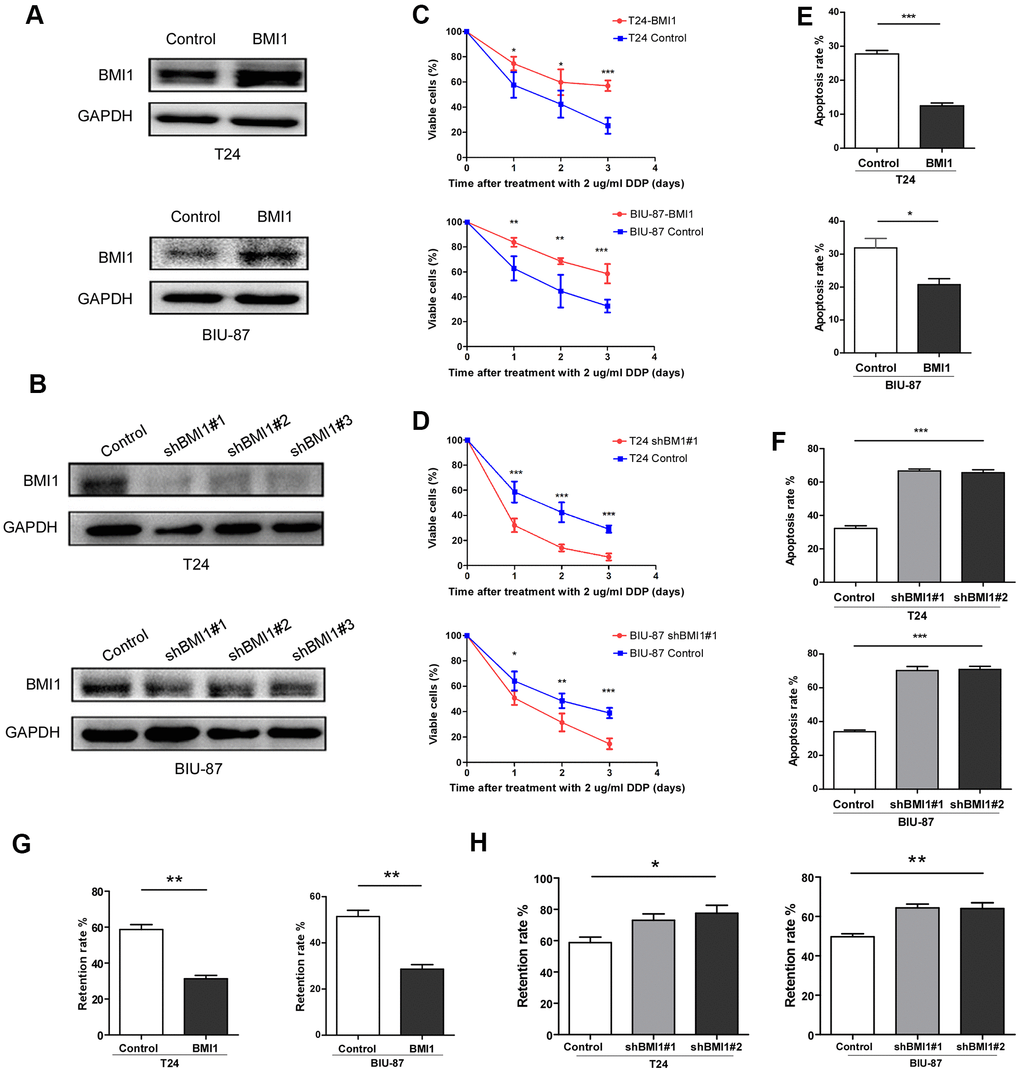
Figure 3. BMI1 enhanced the chemoresistance of bladder cancer cells. (A, B) Western blot analysis of BMI1 in the indicated BMI1-transduced, BMI1-silenced, or vector control cells. GAPDH was used as the loading control. (C, D) Cell proliferation changes of BMI1-overexpressing, BMI-silenced or vector control cells assessed by cell counting kit-8 assays after treatment with 2 μg/ml DDP. (E, F) Apoptosis of T24 and BIU-87 cells upon BMI1 up-regulation or knock-down was determined by the Annexin V/flow cytometric apoptosis assay after treatment with 2 μg/ml DDP for 72h. (G, H) The retention rate of rhodamine 123 in up-regulating BMI1, down-regulating BMI1 or vector control cells detected by flow cytometry. *P < 0.05. GAPDH: glyceraldehyde3-phosphate dehydrogenase; DDP: cisplatin.
miR-3682-3p directly suppressed ABCB1 gene, contributing to BMI1-mediated chemoresistance in bladder cancer cells.
Next we explored the potential mechanism underpinning BMI1-mediated promotion of drug efflux, which was associated with ABC transporter family. This family has at least 48 members [39], 12 of which are considered to be putative drug transporters [40]. Then these 12 human ABC-transporters were examined by qRT-PCR and ABCB1 gene level was significantly decreased in T24/DDP&GEM cells upon BMI1 knockdown (Figure 4A). Western Blot assay further confirmed the reduction of P-GP protein in T24/DDP&GEM-sgBMI1 cells (Figure 4B). Analogously, BMI1 overexpression increased P-GP protein in bladder cancer cells (Figure 4C), whereas BMI1 knockdown decreased its expression (Figure 4D).
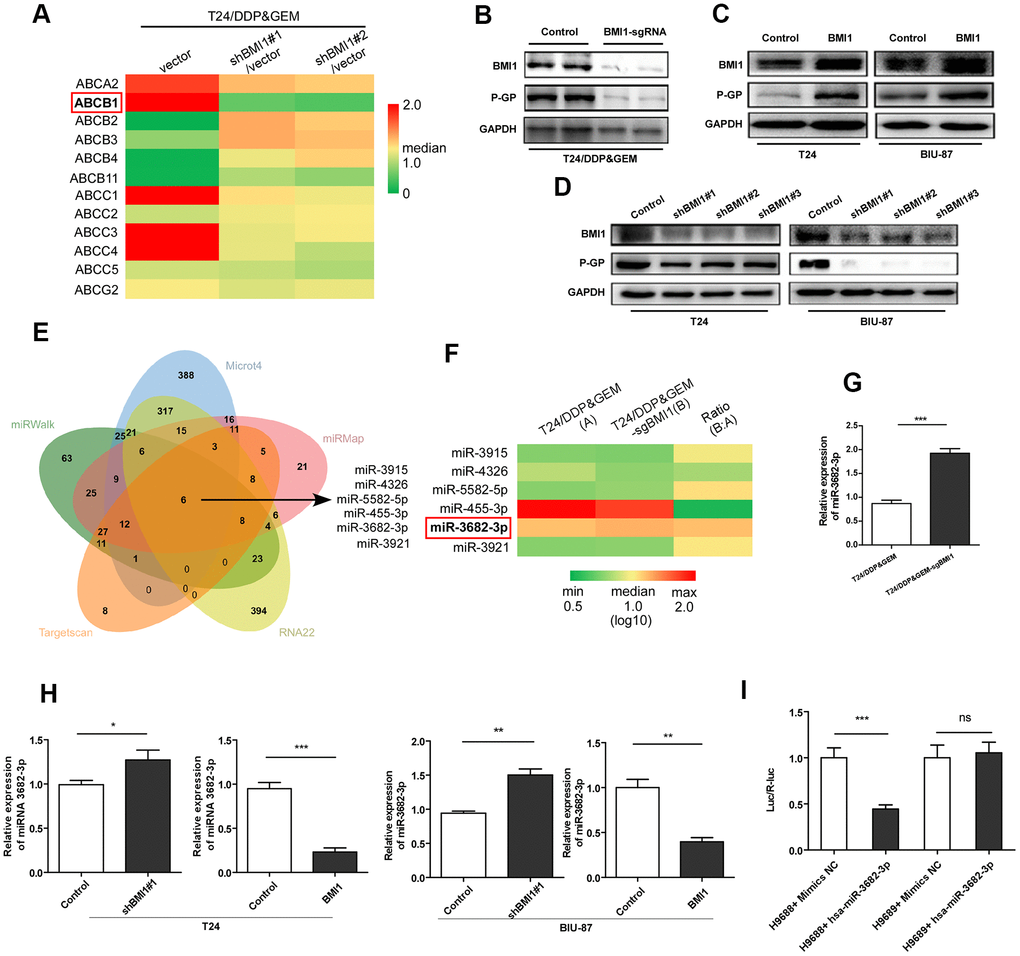
Figure 4. BMI1 activated P- glycoprotein via suppression of miR-3682-3p. (A) qRT-PCR detection of 12 human ABC-transporters, which are associated with drug transport, in T24/DDP&GEM cells upon BMI1 knockdown. (B) Western blot detection of BMI1 and P-GP in T24/DDP&GEM and T24/DDP&GEM-sgBMI1 cells. (C, D) Western blot analysis of BMI1 and P-GP in overexpressing, downregulating BMI1 or vector control cells (T24 and BIU-87). (E) A Venn diagram showing the overlap of candidate miRNAs that were predicted by miRWalk2.0 to potentially bind to the ABCB1 3'-UTR. (F) Heatmap of 6 candidate miRNAs expression in miRNA microarray assay analysis between T24/DDP&GEM and T24/DDP&GEM-sgBMI1 cells. (G) Quantification analysis of miR-3682-3p expression by q-RT-PCR in T24/DDP&GEM and T24/DDP&GEM-sgBMI1 cells. (H) Detection of miR-3682-3p expression by q-RT-PCR in overexpressing, downregulating or vector control cells (T24 and BIU-87). (I) Results of luciferase reporter assay in HEK293T cells with co-transfection of ABCB1 3'-UTR vector (H9688) or mutant control vector (H9689). *P < 0.05. **P < 0.01. ***P < 0.001. DDP: cisplatin; GEM: gemcitabine; P-GP: P-glycoprotein.
Given the important regulatory role of miRNAs in silencing of gene expression, especially in MDR related genes [9], we explored the potential regulation of miRNAs in P-GP reduction. A comprehensive database, miRWalk 2.0, including miRWalk, RNA22, miRMap, Microt4, and TargetScan, were applied to predict miRNAs potentially inhibiting ABCB1 gene by binding to its 3'-UTR. And then, six candidate microRNAs (miR-3915, miR-4326, miR-5582-5p, miR-455-3p, miR-3682-3p, and miR-3921) were predicted (Figure 4E). Notably, among these microRNAs, miR-3682-3p was detected by miRNA arrays to be significantly over-expressed in T24/DDP&GEM-sgBMI1 cells relative to T24/DDP&GEM cells (Figure 4F). Subsequent q-RT-PCR further confirmed the increased expression of miR-3682-3p in T24/DDP&GEM-sgBMI1 cells (Figure 4G). Consistently, in another two bladder cancer cells, T24 and BIU-87, miR-3682-3p was detected by q-RT-PCR to be highly expressed upon BMI1 knockdown, whereas miR-3682-3p was down-regulated after overexpressing BMI1 (Figure 4H). To investigate whether miR-3682-3p can specifically inhibit ABCB1 gene, we constructed an ABCB1 3'-UTR plasmid (H9688) that included a 3'-UTR of ABCB1 downstream of the luciferase gene and a mutant plasmid (H9689) that contained a mutant site in predicted binding site. Luciferase reporter assay showed that compared to the control groups, miR-3682-3p markedly inhibited luciferase activities of reporters including 3'-UTR of ABCB1, while miR-3682-3p had no influence on luciferase activities of reporters including the mutant 3'-UTR of ABCB1 (Figure 4I). These data indicated that ABCB1 was a miR-3682-3p target and miR-3682-3p was involved in BMI1-mediated chemoresistance by directly binding to ABCB1 3'-UTR and suppressing its expression.
BMI1 epigenetically repressed transcription of miR-3682-3p upon interaction with p53
Next we investigated the potential mechanism underlying BMI1-mediated reduction of miR-3682-3p. Given the crucial role of BMI1 in transcriptionally silencing genes [41], we supposed that BMI1 repressed miR-3682-3p transcription probably via interference with its regulators. Then we predicted the potential transcription regulators that could interact with BMI1, as well as regulate miR-3682-3p expression by Biological General Repository for Interactionh Datasets (BioGRID) and JASPAR database. Of these proteins, p53 aroused great interest as it have been reported to interact with BMI1 [42], and BMI1 loss results in the upregulation of p53 targets [43, 44]. Herein, co-IP assay validated the interaction of BMI1 with p53 in T24 cells (Figure 5A). According to the predicted binding sites of miR-3682-3p gene, ChIP assay was performed and confirmed that p53 could directly associate with the promoter of miR-3682-3p gene (Figure 5B). Interestingly, silencing p53 significantly decreased BMI1 occupancy on miR-3682-3p gene promoter (Figure 5C). Furthermore, BMI1 overexpression decreased miR-3682-3p promoter-driven reporter activity in T24 cells, whereas silencing BMI1 had the opposite effects (Figure 5D). These results presented evidence that BMI1 could interact with p53 and repress miR-3682-3p transcription.
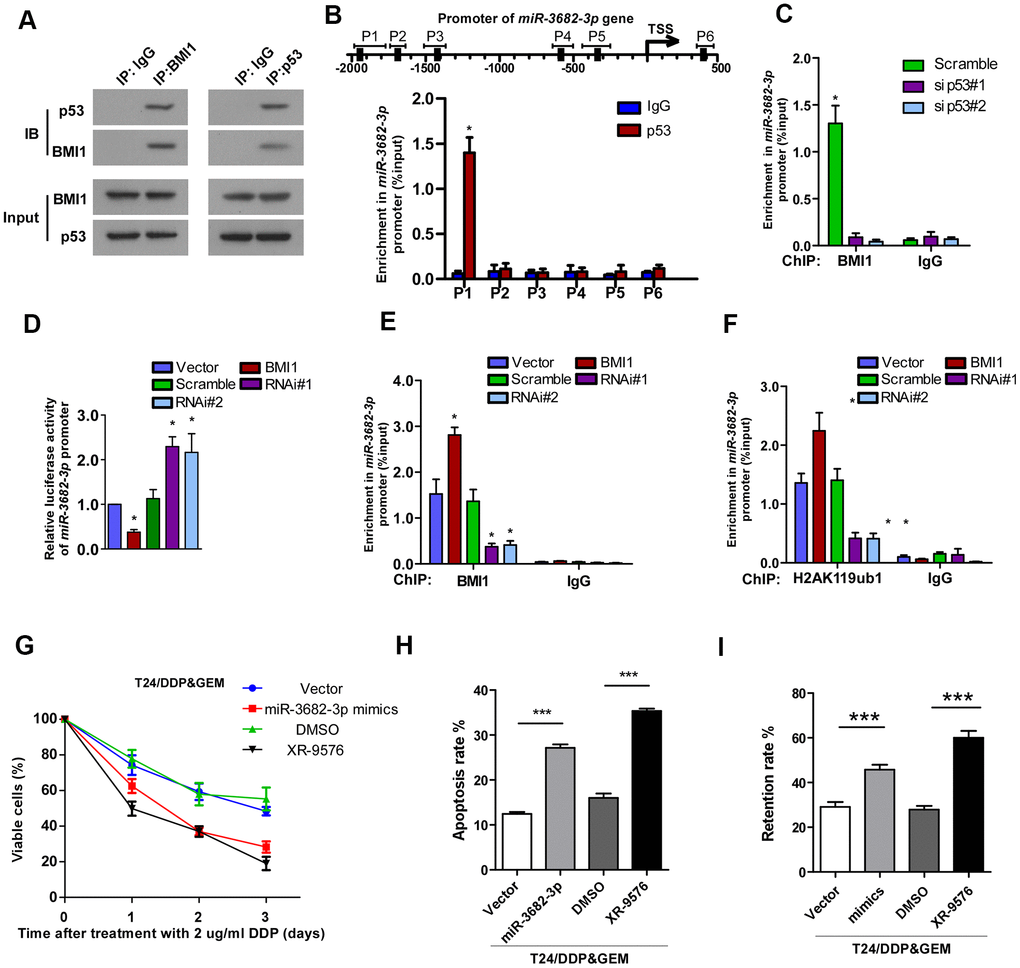
Figure 5. Interacted with p53, BMI1 epigenetically repressed transcription of miR-3682-3p. (A) Co-IP assay showing the interaction of BMI1 with p53 in T24 cells. (B) ChIP assay showing the nucleotide regions of miR-3682-3p promoter that are physically associated with p53. Upper panel: schematic illustration of predicted p53-bound sites and PCR-amplified fragments of the miR-3682-3p promoter; lower panel: ChIP assays were performed using p53 antibody to validate p53-bound miR-3682-3p promoter regions. IgG was used as a negative control. (C) ChIP-qPCR analysis showing enrichment of p53 at miR-3682-3p promoter in the indicated cells. (D) miR-3682-3p promoter luciferase reporter plasmids, Renilla pRL-TK plasmids, vector, or BMI1 were transfected into T24 cells. After 48 h, cells were subjected to a luciferase reporter assay. (E, F) ChIP-qPCR analysis of BMI1 (E) and H2AK119ub1 (F) at promoter of miR-3682-3p in T24 cells. (G) Cell proliferation changes of T24/DDP&GEM cells transfected with miR-3682-3p mimics, ABCB1 inhibitor XR-9576, or negative control were assessed by cell counting kit-8 assays after treatment with 2 μg/ml DDP. (H) Apoptosis of the indicated cells detected by the Annexin V/flow cytometric apoptosis assay after treatment with 2 μg/ml DDP. (I) The retention rate of Rhodamine 123 in the indicated cells detected by flow cytometry. *P < 0.05. **P < 0.01. ***P < 0.001. Co-IP: co-immunoprecipitation; ChIP: chromatin immunoprecipitation; DDP: cisplatin.
BMI1 is a major component of PRC1, which was shown to function as a transcriptional repressor through catalyzing the mono-ubiquitination of histone H2A lysine 119 (H2AK119ub1), an epigenetic marker related to gene suppression [45–47]. ChIP showed that BMI1 occupancy on the miR-3682-3p promoter was increased and accompanied by increased H2AK119ub1 upon BMI1 up-regulation (Figure 5E, 5F). Consistent with these results, RNAi of BMI1 significantly decreased the occupancy of BMI1 on the promoter as well as those of H2AK119ub1 (Figure 5E, 5F). Collectively, these results suggested that BMI1, interacted with p53, could repress the transcription of miR-3682-3p through H2AK119 mono-ubiquitination.
To further validate that BMI1-mediated chemoresistance took place through suppression of ABCB1 by miR-3682-3p, we blocked ABCB1 expression in T24/DDP&GEM cells by transfecting the cells with miR-3682-3p mimics or P-GP inhibitor, tariquidar (XR-9576). As shown in Figure 5G–5I, inhibition of ABCB1 via transfecting with miR-3682-3p mimics or by its inhibitor XR-9576 significantly decreased viability (Figure 5G), promoted apoptosis (Figure 5H) and decreased dye efflux (Figure 5I) in BMI1-transduced cells. These experiments showed that miR-3682-3p could directly inhibit ABCB1 gene through targeting its 3'-UTR, contributing to BMI1-mediated chemoresistance of bladder cancer cells.
Clinical relevance among BMI1/miR-3682-3p/P-GP axis in bladder cancer specimens
Next, we analyzed whether the BMI1/miR-3682-3p/P-GP axis found in bladder cancer cells were relevant in clinical. Eight fresh bladder cancer tissue specimens were collected and detected by q-RT-PCR and western blot (Figure 6A). BMI1 protein level correlated negatively with miR-3682-3p level (P = 0.024, R2 = 0.602), and correlated positively with P-GP protein level (P = 0.040, R2 = 0.531), while miR-3682-3p expression correlated negatively with P-GP protein level (P = 0.046, R2 = 0.512, Figure 6B). These results indicated that up-regulation of BMI1 in bladder cancer contributed to miR-3682-3p reduction, which in turn increased P-GP expression to enhance the chemoresistance of bladder cancer.
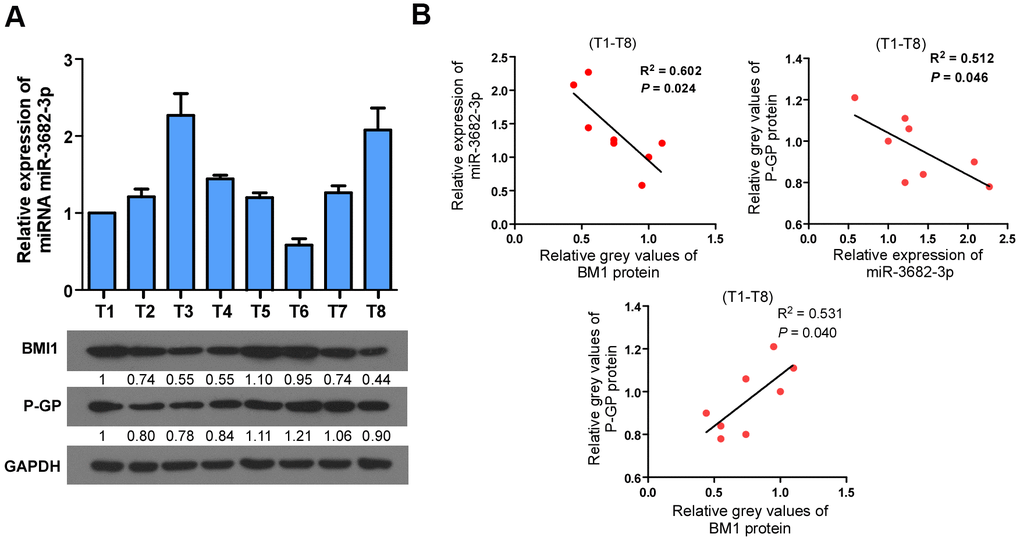
Figure 6. Clinical relevance among BMI1/miR-3682-3p/P-GP axis in human bladder cancer. (A) qRT-PCR or Western Blot detection of BMI1, P-GP and miR-3682-3p expression in 8 freshly collected human bladder cancer samples. (B) Correlation analyses among BMI1/miR-3682-3p/P-GP in these 8 bladder cancer tissues. P-GP: P-glycoprotein.
Aberrant BMI1 amplification contributes to BMI1 overexpression and chemoresistance in bladder cancer, which confers poor prognosis
The BMI1 locus is located on chromosome 10p12.2, that is generally amplified in multiple cancers [23, 48–50]. Compared with the BMI1 copy number variation (CNV) in bladder cancer patients sensitive to chemotherapy in TCGA data sets, BMI1 locus was highly amplified in bladder cancer patients resistant to chemotherapy (P = 0.0254, Figure 7A–7D), suggesting that ectopic BMI1 amplification involved in the chemoresistance of bladder cancer. Consistently, BMI1 mRNA level was significantly related to BMI1 CNV (Figure 7C–7E). CNV in BMI1 expression correlated with neither p53 gene CNV nor p53 mRNA expression (Supplementary Figure 1). Importantly, bladder cancer with BMI1 amplification predicted a worse survival than those without BMI1 amplification (P = 0.0383; Figure 7F). Collectively, aberrant BMI1 amplification contributes to BMI1 overexpression and chemoresistance in bladder cancer, which confers poor prognosis.
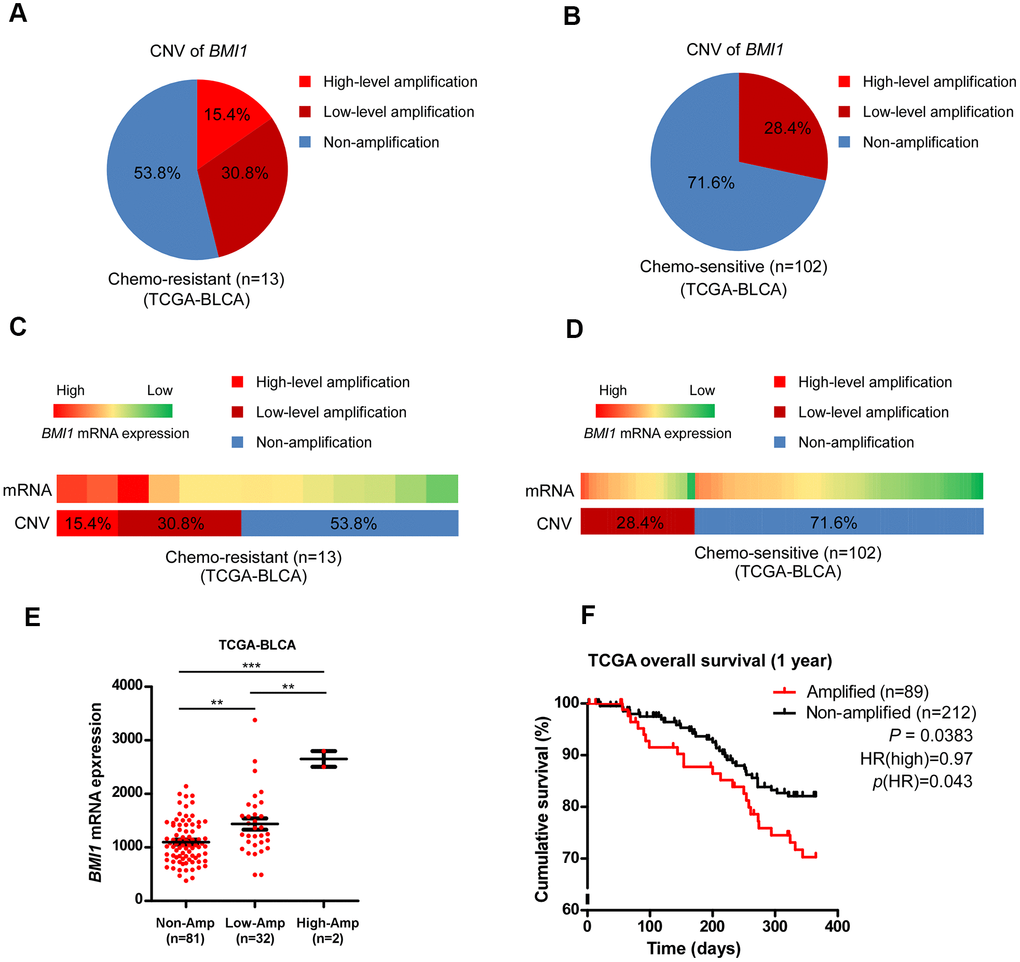
Figure 7. Aberrant BMI1 amplification contributed to BMI1 overexpression and chemoresistance in bladder cancer. (A, B) Analysis of BMI1 copy number variant (CNV) in bladder cancer patients resistant to chemotherapy (A) and that sensitive to chemotherapy (B) in TCGA-BLCA data sets. (C, D) BMI1 gene CNV and corresponding mRNA expression in bladder cancer patients resistant chemotherapy (C) vs. that sensitive to chemotherapy (D) in TCGA-BLCA data sets (P = 0.0254). (E) BMI1 gene CNV and corresponding mRNA expression in a TCGA bladder cancer data set (P < 0.001). (F) Kaplan-Meier analysis of overall survival for patients with amplified or non-amplified BMI1 expression (P = 0.0383). *P < 0.05. **P < 0.01. ***P < 0.001. CNV: copy number variation; TCGA: The Cancer Genome Atlas; BLCA: Bladder Urothelial Carcinoma.
Discussion
This research mainly revealed that upon interaction with p53, BMI1 epigenetically repressed transcription of miR-3682-3p, which in turn increased P-GP expression, resulting in the enhanced drug efflux and chemoresistance of bladder cancer cells. BMI1 was detected to be over-expressed in bladder cancer specimens from GC-chemoresistant patients, which was consistent with the elevated BMI1 expression in established GC-resistant T24/DDP&GEM cells. BMI1 up-regulation, which could be attributed to the amplification of gene loci on the 10p12.2 chromosome, was related to the relapse and progression of bladder cancer. Herein, this study uncovered a novel mechanism underlying BMI1 up-regulation and BMI1-mediated activation of P-GP in GC-chemoresistant bladder cancer, and represented this protein as a potential target for GC-chemoresistant patients with bladder cancer.
BMI1 is a core component of PRC1 complex, which could function as an E3 ubiquitin ligase that transfers the mono-ubiquitination mark to the C-terminal tail of histone H2A at K118/K119 [51–54]. The complex is required to maintain the transcriptionally repressive state of many genes through catalyzing the H2AK119ub1, an epigenetic marker related to gene suppression [45–47, 51]. Ectopic H2AK119ub1 expression has been correlated with the poor prognosis of some tumors [55]. BMI1 enhanced the enzymatic activities of RING1B to mono-ubiquitinate H2AK119 and repress gene transcription [51]. Knockout of Bmi-1 results in a decrease in H2AK119ub1 [56] concomitant with derepression of Hox gene silencing [45, 57]. BMI1 is frequently up-regulated in a variety of cancer, and its over-expression is associated with poor prognosis [19, 58]. Multiple researches have shown that BMI1 is involved in chemoresistance, while inhibiting BMI1 can make cancer cells sensitive to chemotherapy [27, 28, 59]. Consistently, our study revealed that BMI1 was overexpressed in GC-chemoresistant bladder cancer tissues, which confers poor prognosis. Overexpressing BMI1 significantly enhanced, whereas silencing BMI1 attenuated drug efflux and chemoresistance of bladder cancer cells. Mechanically, upon interaction with p53, BMI1 overexpression increased its occupancy on miR-3682-3p gene promoter concomitant with an increase in H2AK119ub1, leading to the reduced transcription of miR-3682-3p gene followed by derepression of ABCB1 gene.
ABCB1 is a member of the superfamily of ATP-binding cassette transporters. As an important MDR related gene, ABCB1 gene encodes P-GP protein and participates in intracellular drug efflux, leading to decreased drug accumulation and development of resistance to anticancer drugs [60–64]. Ectopic P-GP level was inversely related to the prognosis in bladder cancer [64]. Herein, our study identified a novel microRNA post-translationally regulating P-GP overexpression in GC-chemoresistant patients with bladder cancer. Suppression of miR-3682-3p by BMI1 restored P-GP expression in bladder cancer, resulting in the chemoresistant to GC, and tumor relapse and progression.
Currently, most of the chemotherapies for bladder cancer are platinum-based combined regimens in clinic, owing to the low response rate of single drug therapy [65–67]. As the first-line treatment, combined chemotherapy of cisplatin and gemcitabine is the most commonly used for advanced MIBC patients, but its response rate is still not more than 50% [3]. In this study, we established T24/DDP&GEM cells resistant to cisplatin and gemcitabine, and investigated the regulation role of BMI1/miR-3682-3p/P-GP axis in T24/DDP&GEM cells and in bladder cancer tissues of patients resistant to GC chemotherapy. Suppression of P-GP by miR-3682-3p mimics or XR-9576 could significantly reverse BMI1-mediated chemoresistance of bladder cancer cells, presenting miR-3682-3p or XR-9576 as a potential adjuvant agent in GC-chemoresistant bladder cancer with ectopic BMI1 expression. XR-9576, also named tariquidar, is the 3rd generation of P-GP inhibitors. XR-9576 has high affinity with P-GP, can bind to P-GP non-competitively and strongly suppresses its activity [68]. XR-9576 did not interfere with the pharmacokinetics of doxorubicin, paclitaxel, or vinorelbine in chemotherapy of patients with solid tumours [69, 70]. Several clinical trials using XR-9576 in combination with chemotherapy revealed that XR-9576 is a potent P-GP antagonist without significant side effects [69–72], representing XR-9576 as a promising treatment for MDR bladder cancer with ectopic BMI1 expression.
This study demonstrated that the elevated BMI1 expression observed in GC-resistant patients with bladder cancer could be due to genomic amplification of 10p12.2, which conferred poor prognosis. BMI1 overexpression dramatically promoted drug efflux, enhanced viability and decreased apoptosis of bladder cancer cells upon chemotherapy with DDP or GEM, whereas BMI1 downregulation reversed this effect. Mechanically, miR-3682-3p was identified as a downstream target of p53. Upon interaction with p53, BMI1 could repress the transcription of miR-3682-3p gene following an increase in H2AK119ub1, leading to derepression of ABCB1 gene. Moreover, suppression of P-GP by miR-3682-3p mimics or XR-9576 could significantly reverse BMI1-mediated chemoresistance of bladder cancer cells. The results provided a novel insight into the portion of mechanism underlying BMI1-mediated chemoresistance in bladder cancer, presenting BMI1 as a valuable prognosis indicator and potential therapeutic target for GC-resistant bladder cancer.
Supplementary Materials
Author Contributions
LCD and QZK designed the study. CMK, WP and YYL carried out the experiments of cytobiology. LY, ZJW and CZJ conducted the follow-up study. YJK, LDY and LZJ participated in acquisition of data. XX, ZQZ and XKY took part in collection of clinical samples. GWB, XM and BJM analyzed the experimental data. ZJH drafted the manuscript. YC, DHF, WHY, HZP and CMK participated in the revising of the manuscript. All authors read and approved the final manuscript.
Conflicts of Interest
The authors declare that they have no conflicts of interest.
Funding
This study was supported by National Natural Science Foundation of China, No. 81072101 and Natural Science Foundation of Guangdong Province (No.2014A030310017, No.2017A030313686).
Editorial Note
This corresponding author has a verified history of publications using a personal email address for correspondence
References
- 1. Bray F, Ferlay J, Soerjomataram I, Siegel RL, Torre LA, Jemal A. Global cancer statistics 2018: GLOBOCAN estimates of incidence and mortality worldwide for 36 cancers in 185 countries. CA Cancer J Clin. 2018; 68:394–424. https://doi.org/10.3322/caac.21492 [PubMed]
- 2. Gallagher DJ, Milowsky MI, Bajorin DF. Advanced bladder cancer: status of first-line chemotherapy and the search for active agents in the second-line setting. Cancer. 2008; 113:1284–93. https://doi.org/10.1002/cncr.23692 [PubMed]
- 3. von der Maase H, Hansen SW, Roberts JT, Dogliotti L, Oliver T, Moore MJ, Bodrogi I, Albers P, Knuth A, Lippert CM, Kerbrat P, Sanchez Rovira P, Wersall P, et al. Gemcitabine and cisplatin versus methotrexate, vinblastine, doxorubicin, and cisplatin in advanced or metastatic bladder cancer: results of a large, randomized, multinational, multicenter, phase III study. J Clin Oncol. 2000; 18:3068–77. https://doi.org/10.1200/JCO.2000.18.17.3068 [PubMed]
- 4. Grossman HB, Natale RB, Tangen CM, Speights VO, Vogelzang NJ, Trump DL, deVere White RW, Sarosdy MF, Wood DP
Jr , Raghavan D, Crawford ED. Neoadjuvant chemotherapy plus cystectomy compared with cystectomy alone for locally advanced bladder cancer. N Engl J Med. 2003; 349:859–66. https://doi.org/10.1056/NEJMoa022148 [PubMed] - 5. Jansen MP, Knijnenburg T, Reijm EA, Simon I, Kerkhoven R, Droog M, Velds A, van Laere S, Dirix L, Alexi X, Foekens JA, Wessels L, Linn SC, et al. Hallmarks of aromatase inhibitor drug resistance revealed by epigenetic profiling in breast cancer. Cancer Res. 2013; 73:6632–41. https://doi.org/10.1158/0008-5472.CAN-13-0704 [PubMed]
- 6. Holohan C, Van Schaeybroeck S, Longley DB, Johnston PG. Cancer drug resistance: an evolving paradigm. Nat Rev Cancer. 2013; 13:714–26. https://doi.org/10.1038/nrc3599 [PubMed]
- 7. Pisco AO, Brock A, Zhou J, Moor A, Mojtahedi M, Jackson D, Huang S. Non-Darwinian dynamics in therapy-induced cancer drug resistance. Nat Commun. 2013; 4:2467. https://doi.org/10.1038/ncomms3467 [PubMed]
- 8. Turner NC, Reis-Filho JS. Genetic heterogeneity and cancer drug resistance. Lancet Oncol. 2012; 13:e178–85. https://doi.org/10.1016/S1470-2045(11)70335-7 [PubMed]
- 9. Wu Q, Yang Z, Nie Y, Shi Y, Fan D. Multi-drug resistance in cancer chemotherapeutics: mechanisms and lab approaches. Cancer Lett. 2014; 347:159–66. https://doi.org/10.1016/j.canlet.2014.03.013 [PubMed]
- 10. Kimchi-Sarfaty C, Oh JM, Kim IW, Sauna ZE, Calcagno AM, Ambudkar SV, Gottesman MM. A “silent” polymorphism in the MDR1 gene changes substrate specificity. Science. 2007; 315:525–28. https://doi.org/10.1126/science.1135308 [PubMed]
- 11. Azzariti A, Porcelli L, Quatrale AE, Silvestris N, Paradiso A. The coordinated role of CYP450 enzymes and P-gp in determining cancer resistance to chemotherapy. Curr Drug Metab. 2011; 12:713–21. https://doi.org/10.2174/138920011798357042 [PubMed]
- 12. Wang F, Li T, Zhang B, Li H, Wu Q, Yang L, Nie Y, Wu K, Shi Y, Fan D. MicroRNA-19a/b regulates multidrug resistance in human gastric cancer cells by targeting PTEN. Biochem Biophys Res Commun. 2013; 434:688–94. https://doi.org/10.1016/j.bbrc.2013.04.010 [PubMed]
- 13. Zhang L, Pickard K, Jenei V, Bullock MD, Bruce A, Mitter R, Kelly G, Paraskeva C, Strefford J, Primrose J, Thomas GJ, Packham G, Mirnezami AH. miR-153 supports colorectal cancer progression via pleiotropic effects that enhance invasion and chemotherapeutic resistance. Cancer Res. 2013; 73:6435–47. https://doi.org/10.1158/0008-5472.CAN-12-3308 [PubMed]
- 14. Park IK, Qian D, Kiel M, Becker MW, Pihalja M, Weissman IL, Morrison SJ, Clarke MF. Bmi-1 is required for maintenance of adult self-renewing haematopoietic stem cells. Nature. 2003; 423:302–05. https://doi.org/10.1038/nature01587 [PubMed]
- 15. Siddique HR, Saleem M. Role of BMI1, a stem cell factor, in cancer recurrence and chemoresistance: preclinical and clinical evidences. Stem Cells. 2012; 30:372–78. https://doi.org/10.1002/stem.1035 [PubMed]
- 16. Ojo D, Lin X, Wu Y, Cockburn J, Bane A, Tang D. Polycomb complex protein BMI1 confers resistance to tamoxifen in estrogen receptor positive breast cancer. Cancer Lett. 2018; 426:4–13. https://doi.org/10.1016/j.canlet.2018.03.048 [PubMed]
- 17. Blackledge NP, Fursova NA, Kelley JR, Huseyin MK, Feldmann A, Klose RJ. PRC1 Catalytic Activity Is Central to Polycomb System Function. Mol Cell. 2020; 77:857–74.e9. https://doi.org/10.1016/j.molcel.2019.12.001 [PubMed]
- 18. Lee JY, Yu KR, Kim HS, Kang I, Kim JJ, Lee BC, Choi SW, Shin JH, Seo Y, Kang KS. BMI1 inhibits senescence and enhances the immunomodulatory properties of human mesenchymal stem cells via the direct suppression of MKP-1/DUSP1. Aging (Albany NY). 2016; 8:1670–89. https://doi.org/10.18632/aging.101000 [PubMed]
- 19. Abdouh M, Facchino S, Chatoo W, Balasingam V, Ferreira J, Bernier G. BMI1 sustains human glioblastoma multiforme stem cell renewal. J Neurosci. 2009; 29:8884–96. https://doi.org/10.1523/JNEUROSCI.0968-09.2009 [PubMed]
- 20. Kreso A, van Galen P, Pedley NM, Lima-Fernandes E, Frelin C, Davis T, Cao L, Baiazitov R, Du W, Sydorenko N, Moon YC, Gibson L, Wang Y, et al. Self-renewal as a therapeutic target in human colorectal cancer. Nat Med. 2014; 20:29–36. https://doi.org/10.1038/nm.3418 [PubMed]
- 21. Chen Y, Li L, Ni W, Zhang Y, Sun S, Miao D, Chai R, Li H. Bmi1 regulates auditory hair cell survival by maintaining redox balance. Cell Death Dis. 2015; 6:e1605. https://doi.org/10.1038/cddis.2014.549 [PubMed]
- 22. Douglas D, Hsu JH, Hung L, Cooper A, Abdueva D, van Doorninck J, Peng G, Shimada H, Triche TJ, Lawlor ER. BMI-1 promotes ewing sarcoma tumorigenicity independent of CDKN2A repression. Cancer Res. 2008; 68:6507–15. https://doi.org/10.1158/0008-5472.CAN-07-6152 [PubMed]
- 23. Kang MK, Kim RH, Kim SJ, Yip FK, Shin KH, Dimri GP, Christensen R, Han T, Park NH. Elevated Bmi-1 expression is associated with dysplastic cell transformation during oral carcinogenesis and is required for cancer cell replication and survival. Br J Cancer. 2007; 96:126–33. https://doi.org/10.1038/sj.bjc.6603529 [PubMed]
- 24. Song LB, Li J, Liao WT, Feng Y, Yu CP, Hu LJ, Kong QL, Xu LH, Zhang X, Liu WL, Li MZ, Zhang L, Kang TB, et al. The polycomb group protein Bmi-1 represses the tumor suppressor PTEN and induces epithelial-mesenchymal transition in human nasopharyngeal epithelial cells. J Clin Invest. 2009; 119:3626–36. https://doi.org/10.1172/JCI39374 [PubMed]
- 25. Dong P, Kaneuchi M, Watari H, Hamada J, Sudo S, Ju J, Sakuragi N. MicroRNA-194 inhibits epithelial to mesenchymal transition of endometrial cancer cells by targeting oncogene BMI-1. Mol Cancer. 2011; 10:99. https://doi.org/10.1186/1476-4598-10-99 [PubMed]
- 26. Shen HT, Chien PJ, Chen SH, Sheu GT, Jan MS, Wang BY, Chang WW. BMI1-Mediated Pemetrexed Resistance in Non-Small Cell Lung Cancer Cells Is Associated with Increased SP1 Activation and Cancer Stemness. Cancers (Basel). 2020; 12:2069. https://doi.org/10.3390/cancers12082069 [PubMed]
- 27. Crea F, Duhagon Serrat MA, Hurt EM, Thomas SB, Danesi R, Farrar WL. BMI1 silencing enhances docetaxel activity and impairs antioxidant response in prostate cancer. Int J Cancer. 2011; 128:1946–54. https://doi.org/10.1002/ijc.25522 [PubMed]
- 28. Qin L, Zhang X, Zhang L, Feng Y, Weng GX, Li MZ, Kong QL, Qian CN, Zeng YX, Zeng MS, Liao DF, Song LB. Downregulation of BMI-1 enhances 5-fluorouracil-induced apoptosis in nasopharyngeal carcinoma cells. Biochem Biophys Res Commun. 2008; 371:531–35. https://doi.org/10.1016/j.bbrc.2008.04.117 [PubMed]
- 29. Xu F, Yang R, Wu L, He Q, Zhang Z, Zhang Q, Yang Y, Guo J, Chang C, Li X. Overexpression of BMI1 confers clonal cells resistance to apoptosis and contributes to adverse prognosis in myelodysplastic syndrome. Cancer Lett. 2012; 317:33–40. https://doi.org/10.1016/j.canlet.2011.11.012 [PubMed]
- 30. Cheng Y, Yang X, Deng X, Zhang X, Li P, Tao J, Lu Q. MicroRNA-218 inhibits bladder cancer cell proliferation, migration, and invasion by targeting BMI-1. Tumour Biol. 2015; 36:8015–23. https://doi.org/10.1007/s13277-015-3532-x [PubMed]
- 31. Liang W, Zhu D, Cui X, Su J, Liu H, Han J, Zhao F, Xie W. Knockdown BMI1 expression inhibits proliferation and invasion in human bladder cancer T24 cells. Mol Cell Biochem. 2013; 382:283–91. https://doi.org/10.1007/s11010-013-1745-0 [PubMed]
- 32. De Faveri LE, Hurst CD, Roulson JA, Wood H, Sanchez-Carbayo M, Knowles MA, Chapman EJ. Polycomb Repressor Complex 1 Member, BMI1 Contributes to Urothelial Tumorigenesis through p16-Independent Mechanisms. Transl Oncol. 2015; 8:387–99. https://doi.org/10.1016/j.tranon.2015.08.002 [PubMed]
- 33. Zhu D, Wan X, Huang H, Chen X, Liang W, Zhao F, Lin T, Han J, Xie W. Knockdown of Bmi1 inhibits the stemness properties and tumorigenicity of human bladder cancer stem cell-like side population cells. Oncol Rep. 2014; 31:727–36. https://doi.org/10.3892/or.2013.2919 [PubMed]
- 34. Qin ZK, Yang JA, Ye YL, Zhang X, Xu LH, Zhou FJ, Han H, Liu ZW, Song LB, Zeng MS. Expression of Bmi-1 is a prognostic marker in bladder cancer. BMC Cancer. 2009; 9:61. https://doi.org/10.1186/1471-2407-9-61 [PubMed]
- 35. Jiang L, Zhou J, Zhong D, Zhou Y, Zhang W, Wu W, Zhao Z, Wang W, Xu W, He L, Ma Y, Hu Y, Zhang W, Li J. Overexpression of SMC4 activates TGFβ/Smad signaling and promotes aggressive phenotype in glioma cells. Oncogenesis. 2017; 6:e301. https://doi.org/10.1038/oncsis.2017.8 [PubMed]
- 36. Cai J, Guan H, Fang L, Yang Y, Zhu X, Yuan J, Wu J, Li M. MicroRNA-374a activates Wnt/β-catenin signaling to promote breast cancer metastasis. J Clin Invest. 2013; 123:566–79. https://doi.org/10.1172/JCI65871 [PubMed]
- 37. Zhou JH, Zhou QZ, Lyu XM, Zhu T, Chen ZJ, Chen MK, Xia H, Wang CY, Qi T, Li X, Liu CD. The expression of cysteine-rich secretory protein 2 (CRISP2) and its specific regulator miR-27b in the spermatozoa of patients with asthenozoospermia. Biol Reprod. 2015; 92:28. https://doi.org/10.1095/biolreprod.114.124487 [PubMed]
- 38. Dweep H, Gretz N. miRWalk2.0: a comprehensive atlas of microRNA-target interactions. Nat Methods. 2015; 12:697. https://doi.org/10.1038/nmeth.3485 [PubMed]
- 39. Gillet JP, Efferth T, Remacle J. Chemotherapy-induced resistance by ATP-binding cassette transporter genes. Biochim Biophys Acta. 2007; 1775:237–62. https://doi.org/10.1016/j.bbcan.2007.05.002 [PubMed]
- 40. Lage H. ABC-transporters: implications on drug resistance from microorganisms to human cancers. Int J Antimicrob Agents. 2003; 22:188–99. https://doi.org/10.1016/s0924-8579(03)00203-6 [PubMed]
- 41. Jiang L, Li J, Song L. Bmi-1, stem cells and cancer. Acta Biochim Biophys Sin (Shanghai). 2009; 41:527–34. https://doi.org/10.1093/abbs/gmp040 [PubMed]
- 42. Calao M, Sekyere EO, Cui HJ, Cheung BB, Thomas WD, Keating J, Chen JB, Raif A, Jankowski K, Davies NP, Bekkum MV, Chen B, Tan O, et al. Direct effects of Bmi1 on p53 protein stability inactivates oncoprotein stress responses in embryonal cancer precursor cells at tumor initiation. Oncogene. 2013; 32:3616–26. https://doi.org/10.1038/onc.2012.368 [PubMed]
- 43. Cantor DJ, King B, Blumenberg L, DiMauro T, Aifantis I, Koralov SB, Skok JA, David G. Impaired Expression of Rearranged Immunoglobulin Genes and Premature p53 Activation Block B Cell Development in BMI1 Null Mice. Cell Rep. 2019; 26:108–18.e4. https://doi.org/10.1016/j.celrep.2018.12.030 [PubMed]
- 44. Alajez NM, Shi W, Hui AB, Yue S, Ng R, Lo KW, Bastianutto C, O’Sullivan B, Gullane P, Liu FF. Targeted depletion of BMI1 sensitizes tumor cells to P53-mediated apoptosis in response to radiation therapy. Cell Death Differ. 2009; 16:1469–79. https://doi.org/10.1038/cdd.2009.85 [PubMed]
- 45. Cao R, Tsukada Y, Zhang Y. Role of Bmi-1 and Ring1A in H2A ubiquitylation and Hox gene silencing. Mol Cell. 2005; 20:845–54. https://doi.org/10.1016/j.molcel.2005.12.002 [PubMed]
- 46. Benitz S, Regel I, Reinhard T, Popp A, Schäffer I, Raulefs S, Kong B, Esposito I, Michalski CW, Kleeff J. Polycomb repressor complex 1 promotes gene silencing through H2AK119 mono-ubiquitination in acinar-to-ductal metaplasia and pancreatic cancer cells. Oncotarget. 2016; 7:11424–33. https://doi.org/10.18632/oncotarget.6717 [PubMed]
- 47. Endoh M, Endo TA, Endoh T, Isono K, Sharif J, Ohara O, Toyoda T, Ito T, Eskeland R, Bickmore WA, Vidal M, Bernstein BE, Koseki H. Histone H2A mono-ubiquitination is a crucial step to mediate PRC1-dependent repression of developmental genes to maintain ES cell identity. PLoS Genet. 2012; 8:e1002774. https://doi.org/10.1371/journal.pgen.1002774 [PubMed]
- 48. Beà S, Tort F, Pinyol M, Puig X, Hernández L, Hernández S, Fernandez PL, van Lohuizen M, Colomer D, Campo E. BMI-1 gene amplification and overexpression in hematological malignancies occur mainly in mantle cell lymphomas. Cancer Res. 2001; 61:2409–12. [PubMed]
- 49. Kim JH, Yoon SY, Jeong SH, Kim SY, Moon SK, Joo JH, Lee Y, Choe IS, Kim JW. Overexpression of Bmi-1 oncoprotein correlates with axillary lymph node metastases in invasive ductal breast cancer. Breast. 2004; 13:383–88. https://doi.org/10.1016/j.breast.2004.02.010 [PubMed]
- 50. Leung C, Lingbeek M, Shakhova O, Liu J, Tanger E, Saremaslani P, Van Lohuizen M, Marino S. Bmi1 is essential for cerebellar development and is overexpressed in human medulloblastomas. Nature. 2004; 428:337–41. https://doi.org/10.1038/nature02385 [PubMed]
- 51. Wang H, Wang L, Erdjument-Bromage H, Vidal M, Tempst P, Jones RS, Zhang Y. Role of histone H2A ubiquitination in Polycomb silencing. Nature. 2004; 431:873–78. https://doi.org/10.1038/nature02985 [PubMed]
- 52. Gutiérrez L, Oktaba K, Scheuermann JC, Gambetta MC, Ly-Hartig N, Müller J. The role of the histone H2A ubiquitinase Sce in Polycomb repression. Development. 2012; 139:117–27. https://doi.org/10.1242/dev.074450 [PubMed]
- 53. Scheuermann JC, Gutiérrez L, Müller J. Histone H2A monoubiquitination and Polycomb repression: the missing pieces of the puzzle. Fly (Austin). 2012; 6:162–68. https://doi.org/10.4161/fly.20986 [PubMed]
- 54. Di Croce L, Helin K. Transcriptional regulation by Polycomb group proteins. Nat Struct Mol Biol. 2013; 20:1147–55. https://doi.org/10.1038/nsmb.2669 [PubMed]
- 55. Chen S, Chen J, Zhan Q, Zhu Y, Chen H, Deng X, Hou Z, Shen B, Chen Y, Peng C. H2AK119Ub1 and H3K27Me3 in molecular staging for survival prediction of patients with pancreatic ductal adenocarcinoma. Oncotarget. 2014; 5:10421–33. https://doi.org/10.18632/oncotarget.2126 [PubMed]
- 56. Gray F, Cho HJ, Shukla S, He S, Harris A, Boytsov B, Jaremko Ł, Jaremko M, Demeler B, Lawlor ER, Grembecka J, Cierpicki T. BMI1 regulates PRC1 architecture and activity through homo- and hetero-oligomerization. Nat Commun. 2016; 7:13343. https://doi.org/10.1038/ncomms13343 [PubMed]
- 57. Wei J, Zhai L, Xu J, Wang H. Role of Bmi1 in H2A ubiquitylation and Hox gene silencing. J Biol Chem. 2006; 281:22537–44. https://doi.org/10.1074/jbc.M600826200 [PubMed]
- 58. Bhattacharya R, Nicoloso M, Arvizo R, Wang E, Cortez A, Rossi S, Calin GA, Mukherjee P. MiR-15a and MiR-16 control Bmi-1 expression in ovarian cancer. Cancer Res. 2009; 69:9090–95. https://doi.org/10.1158/0008-5472.CAN-09-2552 [PubMed]
- 59. Wang E, Bhattacharyya S, Szabolcs A, Rodriguez-Aguayo C, Jennings NB, Lopez-Berestein G, Mukherjee P, Sood AK, Bhattacharya R. Enhancing chemotherapy response with Bmi-1 silencing in ovarian cancer. PLoS One. 2011; 6:e17918. https://doi.org/10.1371/journal.pone.0017918 [PubMed]
- 60. Hoffmann AC, Wild P, Leicht C, Bertz S, Danenberg KD, Danenberg PV, Stöhr R, Stöckle M, Lehmann J, Schuler M, Hartmann A. MDR1 and ERCC1 expression predict outcome of patients with locally advanced bladder cancer receiving adjuvant chemotherapy. Neoplasia. 2010; 12:628–36. https://doi.org/10.1593/neo.10402 [PubMed]
- 61. Cheng XZ, Zhou HL, Tang SX, Jiang T, Chen Q, Gao R, Ding YL. Intercellular transfer of P-glycoprotein mediates the formation of stable multi-drug resistance in human bladder cancer BIU-87 cells. Biol Open. 2019; 8:bio041889. https://doi.org/10.1242/bio.041889 [PubMed]
- 62. Zhou HL, Zheng YJ, Cheng XZ, Lv YS, Gao R, Mao HP, Chen Q. Intercellular transfer of P-glycoprotein from the drug resistant human bladder cancer cell line BIU-87 does not require cell-to-cell contact. J Urol. 2013; 190:1069–75. https://doi.org/10.1016/j.juro.2013.04.053 [PubMed]
- 63. Robey RW, Pluchino KM, Hall MD, Fojo AT, Bates SE, Gottesman MM. Revisiting the role of ABC transporters in multidrug-resistant cancer. Nat Rev Cancer. 2018; 18:452–64. https://doi.org/10.1038/s41568-018-0005-8 [PubMed]
- 64. Bebawy M, Combes V, Lee E, Jaiswal R, Gong J, Bonhoure A, Grau GE. Membrane microparticles mediate transfer of P-glycoprotein to drug sensitive cancer cells. Leukemia. 2009; 23:1643–49. https://doi.org/10.1038/leu.2009.76 [PubMed]
- 65. Loehrer PJ
Sr , Einhorn LH, Elson PJ, Crawford ED, Kuebler P, Tannock I, Raghavan D, Stuart-Harris R, Sarosdy MF, Lowe BA. A randomized comparison of cisplatin alone or in combination with methotrexate, vinblastine, and doxorubicin in patients with metastatic urothelial carcinoma: a cooperative group study. J Clin Oncol. 1992; 10:1066–73. https://doi.org/10.1200/JCO.1992.10.7.1066 [PubMed] - 66. Bellmunt J, Albanell J, Gallego OS, Ribas A, Vicente P, Carulla J, De Torres J, Morote J, Lopez M, Solé LA. Carboplatin, methotrexate, and vinblastine in patients with bladder cancer who were ineligible for cisplatin-based chemotherapy. Cancer. 1992; 70:1974–79. https://doi.org/10.1002/1097-0142(19921001)70:7<1974::aid-cncr2820700727>3.0.co;2-d [PubMed]
- 67. von der Maase H. Gemcitabine in transitional cell carcinoma of the urothelium. Expert Rev Anticancer Ther. 2003; 3:11–19. https://doi.org/10.1586/14737140.3.1.11 [PubMed]
- 68. Martin C, Berridge G, Mistry P, Higgins C, Charlton P, Callaghan R. The molecular interaction of the high affinity reversal agent XR9576 with P-glycoprotein. Br J Pharmacol. 1999; 128:403–11. https://doi.org/10.1038/sj.bjp.0702807 [PubMed]
- 69. Abraham J, Edgerly M, Wilson R, Chen C, Rutt A, Bakke S, Robey R, Dwyer A, Goldspiel B, Balis F, Van Tellingen O, Bates SE, Fojo T. A phase I study of the P-glycoprotein antagonist tariquidar in combination with vinorelbine. Clin Cancer Res. 2009; 15:3574–82. https://doi.org/10.1158/1078-0432.CCR-08-0938 [PubMed]
- 70. Pusztai L, Wagner P, Ibrahim N, Rivera E, Theriault R, Booser D, Symmans FW, Wong F, Blumenschein G, Fleming DR, Rouzier R, Boniface G, Hortobagyi GN. Phase II study of tariquidar, a selective P-glycoprotein inhibitor, in patients with chemotherapy-resistant, advanced breast carcinoma. Cancer. 2005; 104:682–91. https://doi.org/10.1002/cncr.21227 [PubMed]
- 71. Kelly RJ, Draper D, Chen CC, Robey RW, Figg WD, Piekarz RL, Chen X, Gardner ER, Balis FM, Venkatesan AM, Steinberg SM, Fojo T, Bates SE. A pharmacodynamic study of docetaxel in combination with the P-glycoprotein antagonist tariquidar (XR9576) in patients with lung, ovarian, and cervical cancer. Clin Cancer Res. 2011; 17:569–80. https://doi.org/10.1158/1078-0432.CCR-10-1725 [PubMed]
- 72. Fox E, Widemann BC, Pastakia D, Chen CC, Yang SX, Cole D, Balis FM. Pharmacokinetic and pharmacodynamic study of tariquidar (XR9576), a P-glycoprotein inhibitor, in combination with doxorubicin, vinorelbine, or docetaxel in children and adolescents with refractory solid tumors. Cancer Chemother Pharmacol. 2015; 76:1273–83. https://doi.org/10.1007/s00280-015-2845-1 [PubMed]