


Introduction
In 2020, breast cancer accounted for 30% of all types of cancer in women in the United States. Expressions of the estrogen receptor (ER), progesterone receptor, and human epidermal growth factor receptor (HER)-2 are used to subgroup breast cancer cases. Currently, salvage therapy for breast cancer patients includes fulvestrant (selective ER downregulators) [1, 2], cyclin-dependent kinase 4/6 inhibitors [3], aromatase inhibitors combined with everolimus (a mammalian analog of rapamycin which acts as a mammalian target of rapamycin (mTOR) inhibitor) [4], and histone deacetylase (HDAC) inhibitors [5]. High expression of B-cell lymphoma 2 was detected in nearly 70% of metastatic breast cancer patients, and treatment with a selective inhibitor improved apoptosis in a preclinical model of breast cancer [6, 7]. Meanwhile, proteasome 26S subunit ATPase (PSMC), proteasome 20S subunit beta (PSMB), GATA-binding protein, serine/threonine kinase, and matrix metallopeptidase family genes, signal transducer and activator of transcription (STAT), Notch, and phosphatidylinositol 3-kinase (PI3K) were reported to be causes of those alterations [8–11].
The PSMC family is comprised of six members, namely PSMC1, PSMC2, PSMC3, PSMC4, PSMC5, and PSMC6, which partially constitute formation of the 19S regulatory complex. This complex plays an important role in regulating the 26S proteasome, which in turn, catalyzes the unfolding and translocation of substrates into the 20S proteasome. In addition, members of the PSMC gene family, except for PSMC3, are known to cause N-CoR degradation [12]. Previous studies showed that PSMC6 promotes osteoblast apoptosis and cancer cell proliferation, while PSMC2 inhibits apoptosis. Furthermore, PSMC6 also inhibited activation of the PI3K/AKT signaling pathway in an animal model of ovariectomy-induced osteoporosis [13–15]. PSMC5 participates in degradation of Tln1 and angiogenesis [16]. In hepatocellular carcinoma cells, knockdown of PSMC3IP resulted in suppression of xenograft proliferation and tumorigenesis [17].
High-throughput technologies are widely used as systemic approaches to explore differences in expressions of thousands of genes for both biological and genomics systems [18–20]. It is well recognized that many upregulated and downregulated genes are associated with oncogenic or tumor-suppressive functions in cancer development [21–26]. Nevertheless, a holistic approach to exploring messenger (m)RNA levels of the entire PSMC family in breast cancer has not been conducted.
Therefore, in the present study, we analyzed all available mRNA data from public breast cancer databases, comparing datasets from breast cancer patients with those from normal tissues. We also predicted interactive networks and gene regulatory networks related to the PSMC family to determine potential biomarkers. A meta-analysis approach was adopted to screen downstream molecules associated with PSMC genes. Based on our analysis, PSMC family members and their downstream-regulated genes are potential candidates for new therapeutic targets in breast cancer progression.
Results
PSMC family members play crucial roles in breast cancer progression
Previous studies identified six PSMC family members in Homo species, and some of these genes play crucial roles in cancer progression. Oncomine platform contained a total of 392 unique analyses for PSMC1 expression, and PSMC1 had significant in 13 of 392 unique analyses. PSMC2 had significant in 55 of 433 unique analyses, PSMC3 had significant in 28 of 421 unique analyses, PSMC4 had significant in 71 of 432 unique analyses, PSMC5 had significant in 24 of 420 unique analyses, PSMC6 had significant in 28 of 445 unique analyses (Figure 1). However, a meta-analysis is needed to clarify gene signatures of PSMC family members in breast cancer. According to our results from an Oncomine analysis of mRNA expressions of PSMC2, PSMC3, PSMC4, PSMC5, and PSMC6, these members are highly upregulated in breast cancer tissues; therefore, we chose breast cancer to perform further bioinformatics analyses (Figure 1). Furthermore, in the METABRIC database, expressions of PSMC members in breast cancer tissues were significantly higher than those in normal tissues; p values ranged from 2.16E-45 to 0.023 for PSMC1, 1.37E-29 to 0.016 for PSMC2, 3.18E-21 to 0.001 for PSMC3, 1.28E-53 to 0.018 for PSMC4, 7.02E-36 to 0.041 for PSMC5, and 9.03E-12 to 0.039 for PSMC6 (Supplementary Table 1). Meanwhile, to further explore gene expressions of the entire PSMC family in breast cancer, we compared transcript levels of different breast cancer subtypes, such as the triple-negative, HER-2, and luminal subtypes, relative to normal breast tissues, in TCGA database (Supplementary Figure 1). Interestingly, we discovered that PSMC genes were overexpressed in a subtype-specific manner: specifically, PSMC1, PSMC2, PSMC3, PSMC4 were highly expressed in the triple-negative subtype, PSMC5 in HER-2, and PSMC6 in luminal cancer. These results suggest oncogenic effects of PSMC family genes on tumor progression.
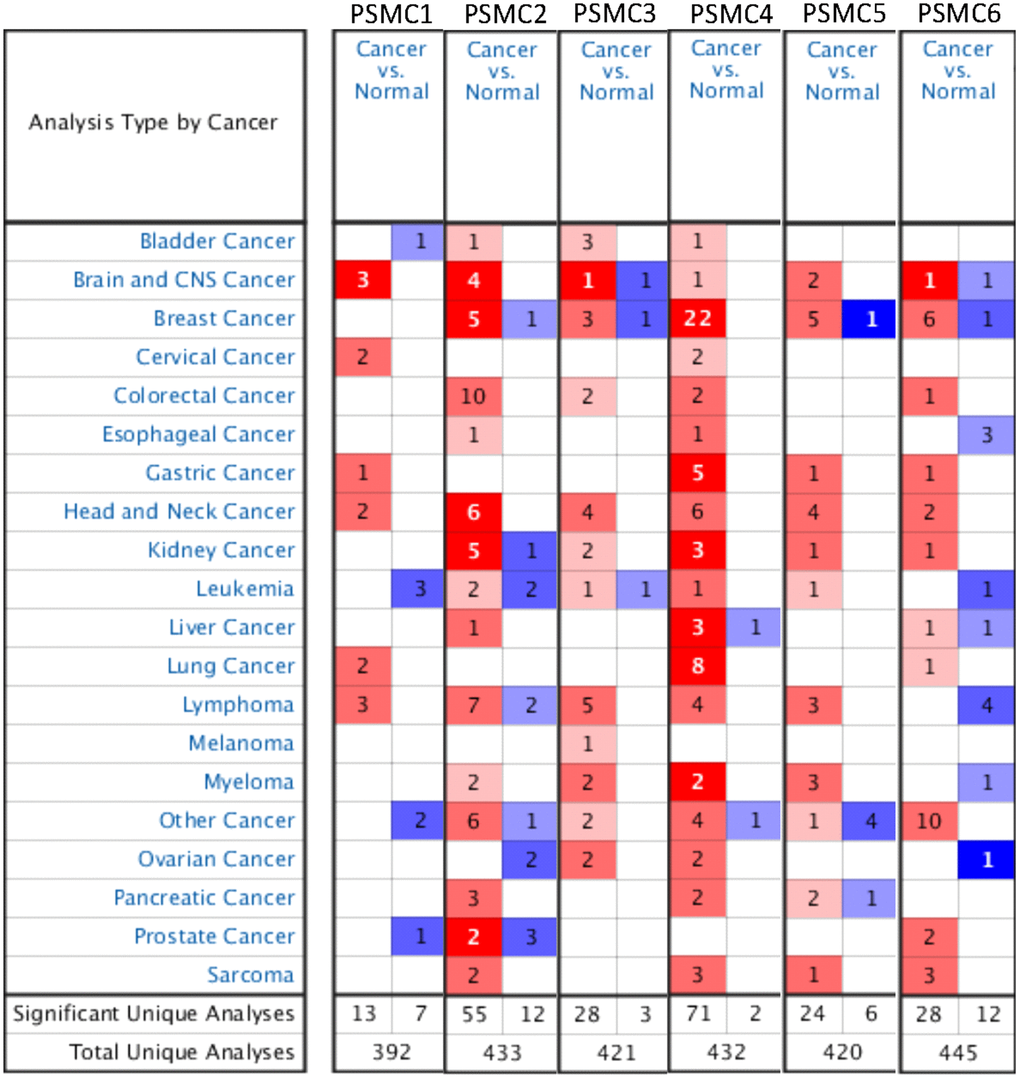
Figure 1. Overview of mRNA expression levels of proteasome 26S subunit, ATPase (PSMC) genes in multiple types and subtypes of cancer from the Oncomine database. The analysis compared expressions of target genes in breast cancer tissues relative to normal matched tissues. Red and blue gradients display the top-ranked genes in specific datasets. Significant unique analysis means the number of datasets that satisfied the threshold of >2 multiples of change, p<0.05, and in the top 10% gene ranking.
Associations between mRNA levels of the PSMC family and clinicopathological parameters in breast cancer patients and cell lines
GEPIA2 datasets were used to analyze mRNA levels of PSMC members in breast cancer tissues compared to normal tissues. We found that levels of all six PSMCs were upregulated in breast cancer tissues relative to normal breast tissues (Figure 2A–2H). Additionally, analysis of the CCLE dataset (https://www.broadinstitute.org/ccle) also showed differential expressions of PSMC family members in breast cell lines (Figure 3).
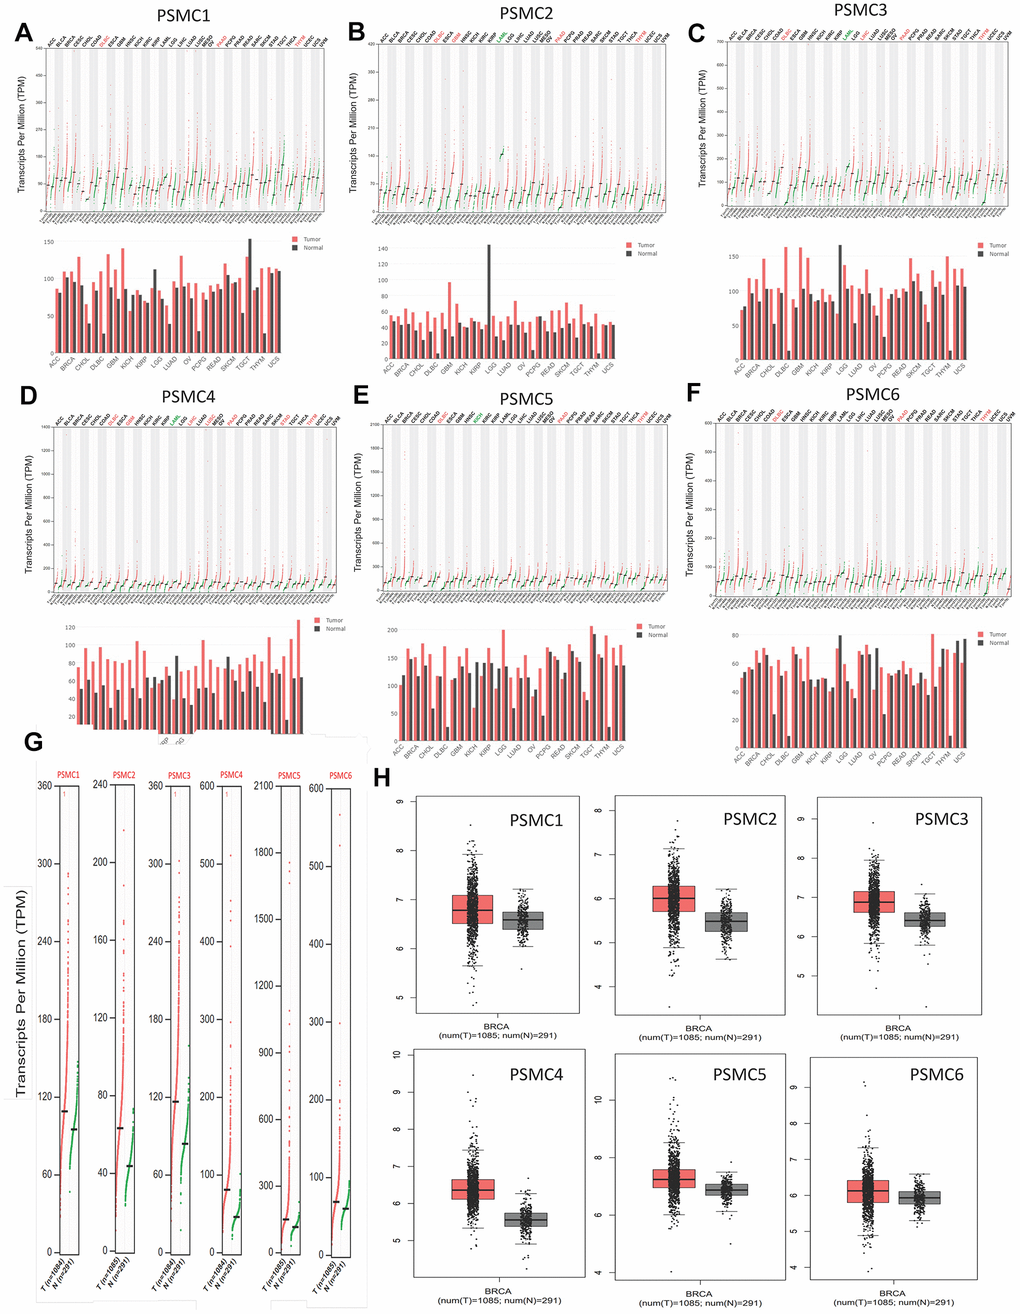
Figure 2. Transcript expressions of proteasome 26S subunit, ATPase (PSMC) genes in breast cancer. (A–F) Expressions of PSMC members in multiple types of cancer. (G, H) Transcript expressions of PSMC members in clinical breast cancer patients. Red bar and box plots show tumor expression while green/gray colors represent normal breast tissues.
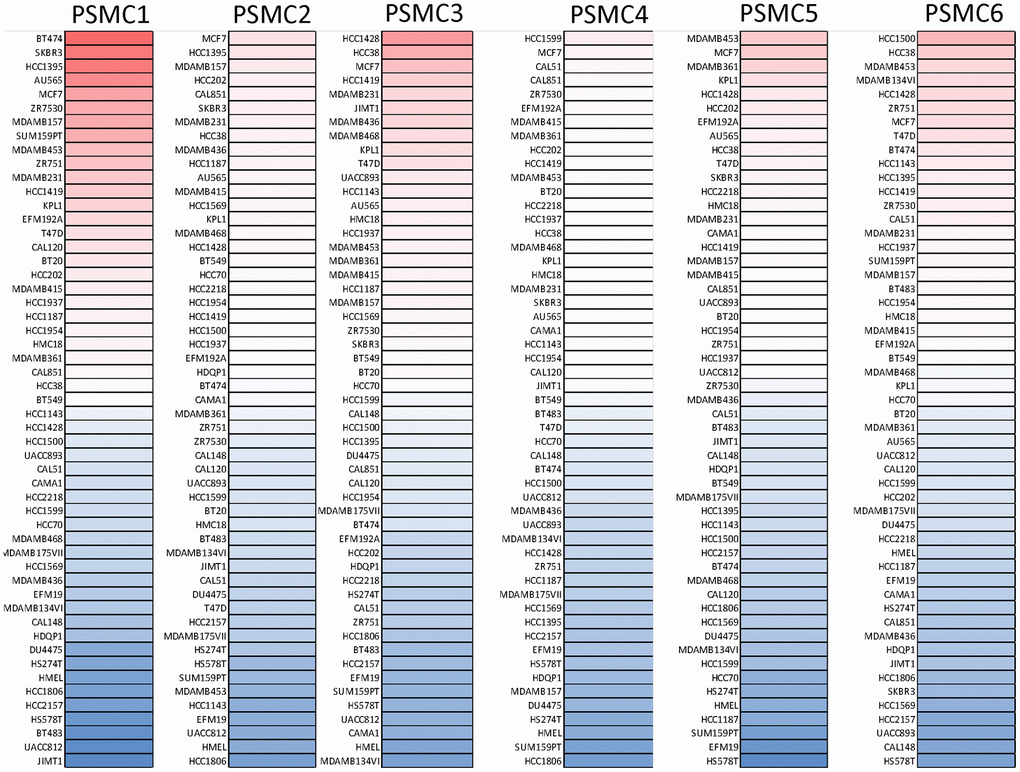
Figure 3. Expressions of proteasome 26S subunit, ATPase (PSMC) genes in different breast cancer cell lines. Heatmap plots were acquired from the CCLE database, which indicated expression levels of six PSMC members in breast cancer cell lines. The upper blocks in red indicate over-expression, whereas the bottom blocks indicate under-expression.
Genes coexpressed with PSMC family genes in breast cancer
We analyzed genes coexpressed with PSMC1 in the Perou Breast 2 dataset from the Oncomine platform. We found that PSMC1 was positively correlated with MYL9, PCOLCE, ANXA6, DVL1, MAPKAPK2, PROC, FTL, ZNF358, CHRNA1, COL5A1, MPP1, PDE6A, COL1A1, MIA, SH2B3, COL6A1, and BGN. We used the Landemaine dataset to analyze genes coexpressed with PSMC2 and found that its expression was positively correlated with SMAD5, KLHL20, ZNF148, KLHL28, PPP4R2, SFRS12IP1, NPHP3, TMCC1, KIAA2018, DHX29, Clorf27, C14orf138, SOCS4, Cllorf46, FKTN, RNF170, CHIC1, ZNHIT6, and JMIDIC. We analyzed genes coexpressed with PSMC3 in the Minn dataset and found that its expression was positively correlated with EIF6, CLIC1, MAPRE1, EIF2S2, GRPEL1, TMEM93, PSMB6, EXOSC9, RPAI, COPS3, G3BP1, EIF2S1, NOL7, SNRPC, EEFIEl, RDBP, and CSEIL. As for the genes coexpressed with PSMC4, we used the Ma dataset and found that it was positively correlated with expressions of ADRM1, CAPZB, ACOT7, HSPB1, UEVLD, PCBD2, CCDC64, C7orf68, SCD, CYB561, GPRC5A, DNAJA4, HAGH, SNRNP25, PSMD2, ANXA4, GRB2, UBE2F, and UBEZF. We analyzed genes coexpressed with PSMC5 in the Julka dataset and found that its expression was positively correlated with CCDC45, CMYA5, KCTD3, SPOPL, TP53INP1, TPPP3, C20orf54, PTGER3, EXOC1, CAT, WDR11, SDCBP, CCDC46, C20orf3, PLK1S1, MYADM, ADAMTSL3, ABCC5, and CAPS. For genes coexpressed with PSMC6, we used the Kreike dataset and found that its expression was positively correlated with CLPX, CCDC9OB, FAM18B2, C60rf62, ZBTB33, PYROXD1, CDC42SE2, COMMD6, LOC401397, CAPZAI, TPRKB, GABPA, MATR3, ZDHHC20, SCOC, and COPS2 (Figure 4A).
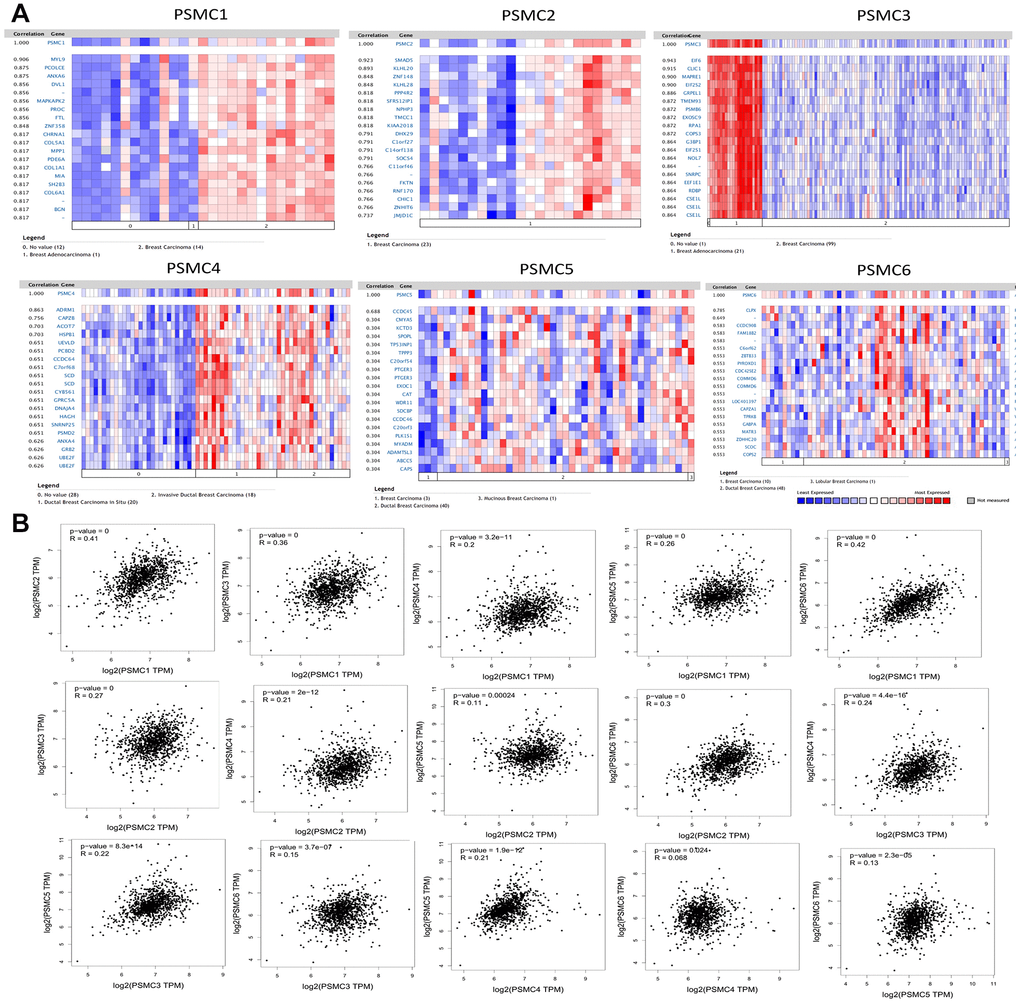
Figure 4. Genes coexpressed with the proteasome 26S subunit, ATPase (PSMC) family and correlations among the six PSMC genes in breast cancer. (A) Genes coexpressed with PSMC genes in breast cancer from the Oncomine platform. (B) Correlations among PSMC genes in breast cancer from the GEPIA2 platform.
Additionally, associations among PSMC1, PSMC2, PSMC3, PSMC4, PSMC5, and PSMC6 were also analyzed using the GEPIA dataset. Specifically, PSMC1 was positively correlated with PSMC2 (R=0.41, p<0.05), PSMC3 (R=0.36, p<0.05), PSMC4 (R=0.2, p<0.05), PSMC5 (R=0.26, p<0.05), and PSMC6 (R=0.42, p<0.05). PSMC2 was positively correlated with PSMC3 (R=0.27, p<0.05), PSMC4 (R=0.21, p<0.05), PSMC5 (R=0.11, p<0.05), and PSMC6 (R=0.3, p<0.05). PSMC3 was positively correlated with PSMC4 (R=0.24, p<0.05), PSMC5 (R=0.22, p<0.05), and PSMC6 (R=0.15, p<0.05). PSMC4 was positively correlated with PSMC5 (R=0.021, p<0.05) and PSMC6 (R=0.068, p<0.05). Finally, PSMC5 was positively correlated with PSMC6 (R=0.13, p<0.05) (Figure 4B). Meanwhile, we obtained similar results from the cBioPortal and the Cytoscaped and METABRIC databases, which revealed that the six PSMC members were correlated with cell cycle-related genes (Supplementary Figure 2). In addition, expressions of PSMC family members were also correlated with immune infiltration profiles in breast cancer, as analyzed with the Tumor Immune Estimation Resource (TIMER; cistrome.shinyapps.io/timer) tool. Expression of each PSMC gene was associated with tumor purity and markers of different types of immune cells (Supplementary Figure 3).
Protein expressions and prognostic values of the PSMC family in breast cancer specimens
Since PSMC family genes were differentially expressed in samples from breast cancer patients, we next explored the potential roles of these genes in human breast cancer tissues, correlating their expressions with other potential biomarkers related to molecular subtypes of breast cancer. To determine expressions of PSMC family members and their clinical relevance, we analyzed protein expressions of individual PSMC members in clinical specimens from the Human Protein Atlas. The data demonstrated that PSMC1-6 presented moderate protein expressions, and PSMC2, PSMC3, and PSMC5 were highly expressed in certain clinical tissues from breast cancer specimens (Figure 5). The Kaplan–Meier plotter database also showed that PSMC1, PSMC3, PSMC4, PSMC5, and PSMC6 had high expression levels in breast cancer tissues may have oncogenic roles in breast cancer progression. High transcription levels of PSMC1, PSMC3, PSMC4, PSMC5, and PSMC6 predicted poor survival, whereas PSMC2 did not show the same pattern (Figure 6).
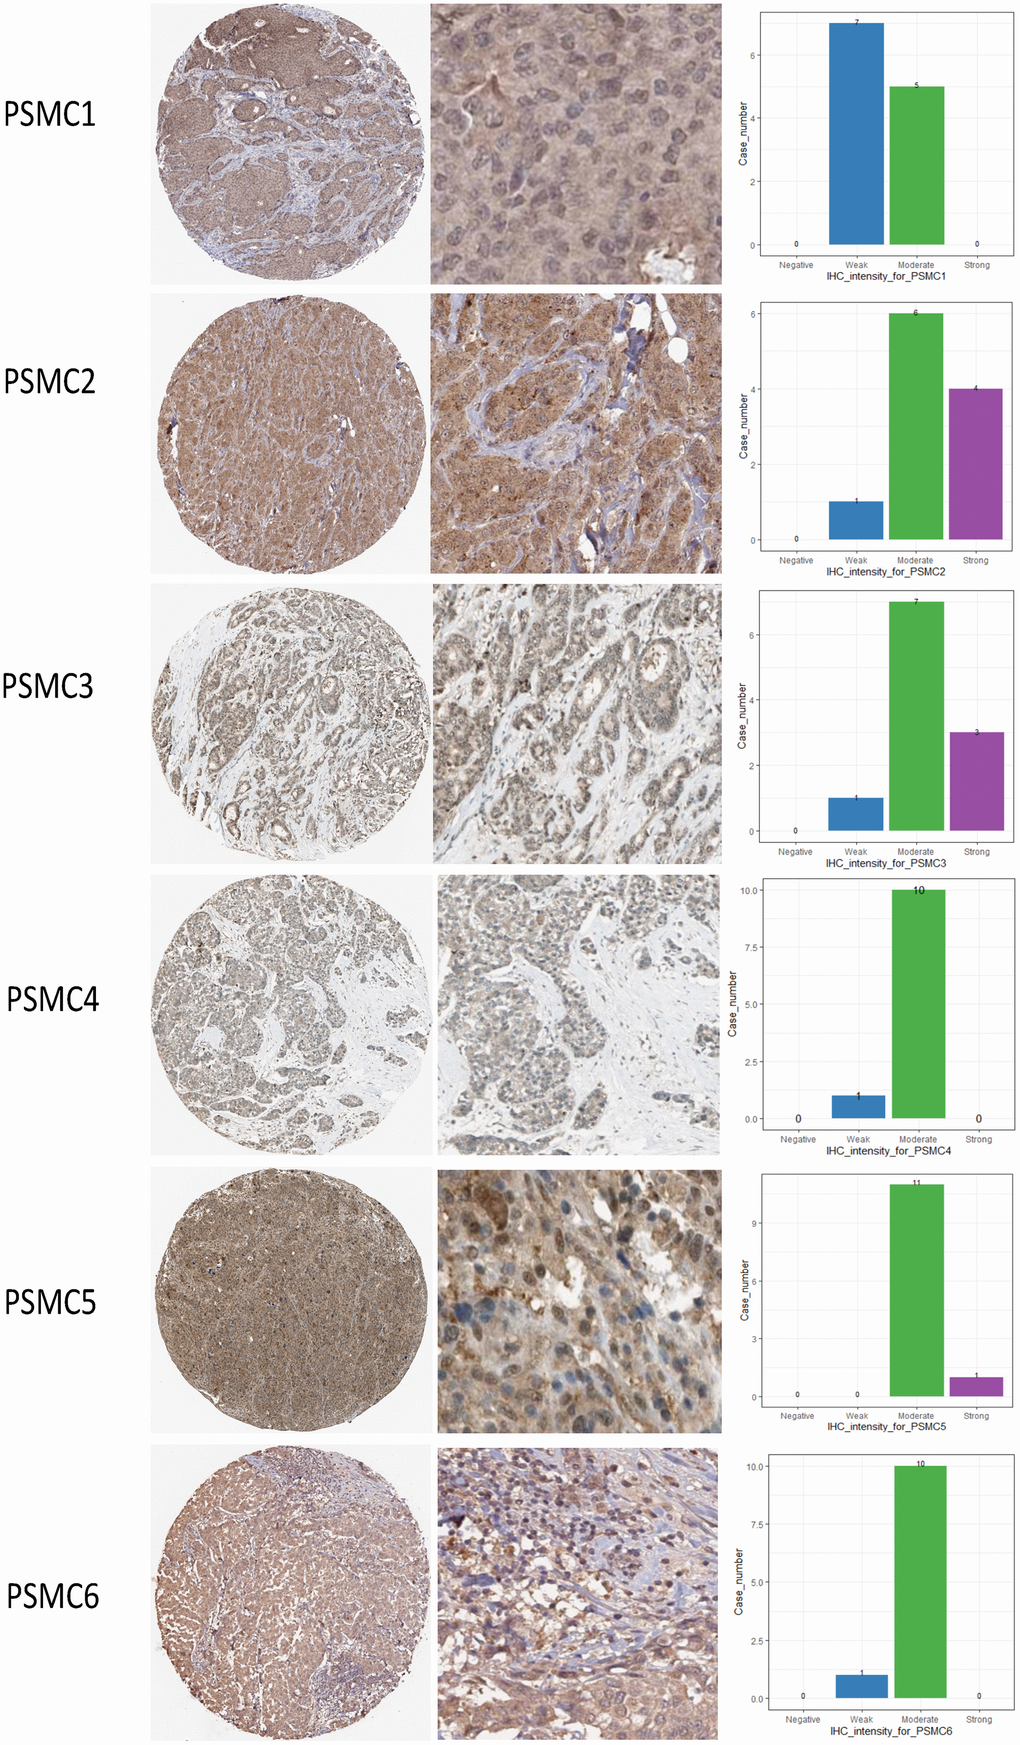
Figure 5. Protein expression levels of proteasome 26S subunit, ATPase (PSMC) family members across clinical specimens of breast cancer. PSMC1, PSMC4, and PSMC6 proteins were moderately expressed, and some clinical tissues showed strong PSMC2, PSMC3, and PSMC5 protein expressions in breast cancer.
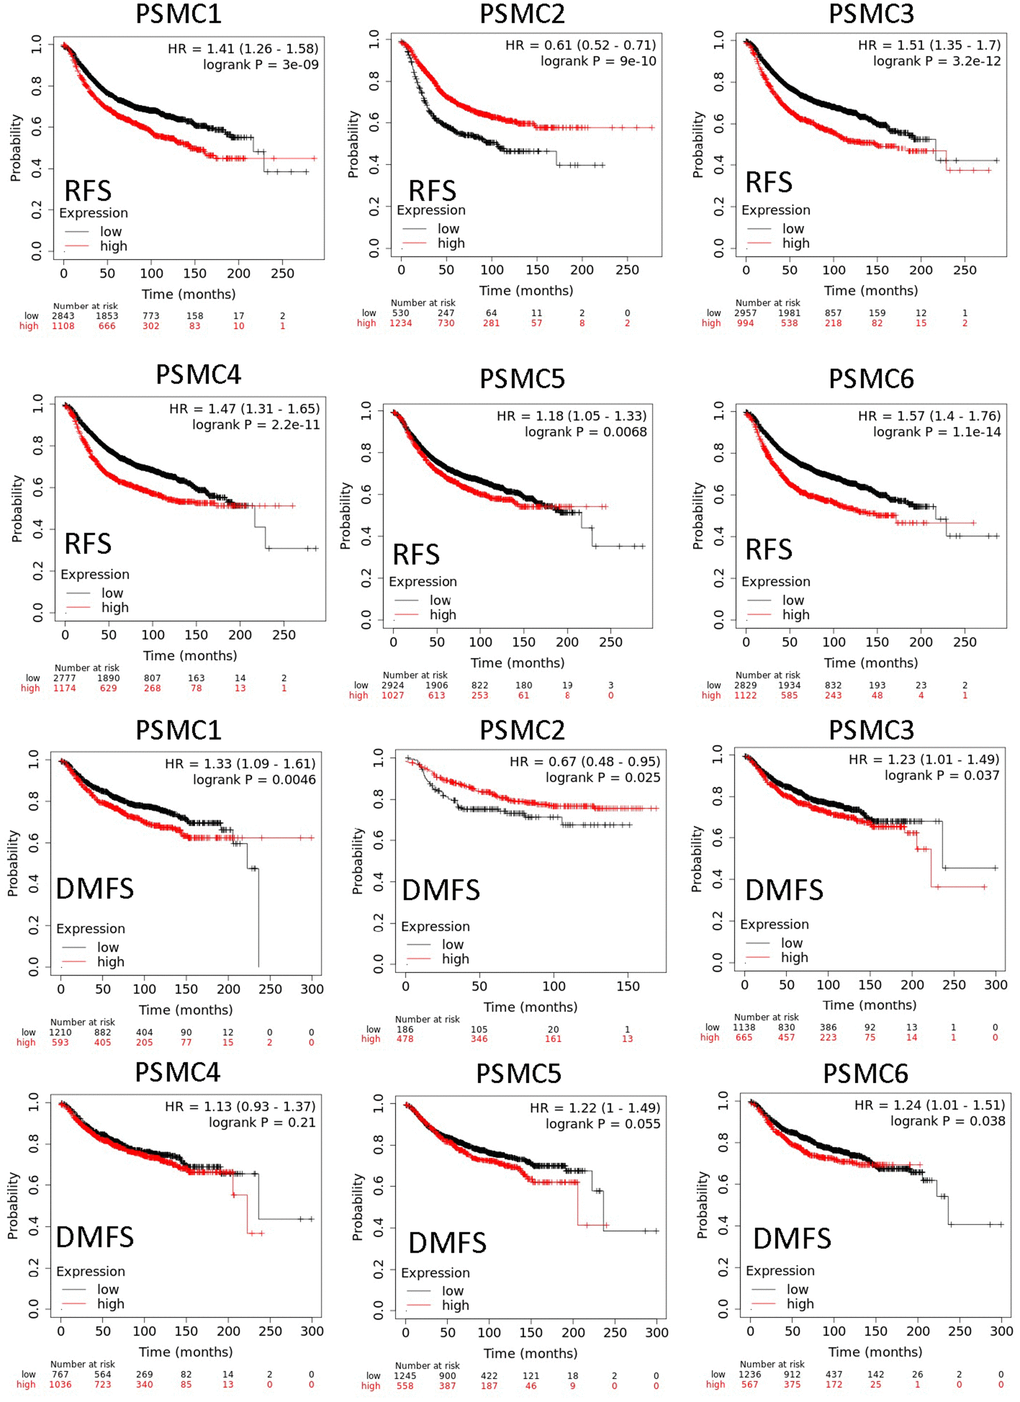
Figure 6. Relationship between expressions of proteasome 26S subunit, ATPase (PSMC) family members with recurrence-free survival (RFS) and distant metastasis-free survival (DMFS) from clinical breast cancer patients (n=2898). Kaplan–Meier plots show correlations of RFS and DMFS in breast cancer patients with high and low expression levels of PSMC family members using the median of expression as the cutoff. Red and black lines respectively represent higher and lower values than the median. High expression levels of most PSMC members were associated with poor survival, whereas high expression levels of PSMC2 were associated with significantly better survival rates (p<0.05).
Pathway and network analyses of PSMC family member genes
First, to explore the universally regulated pathways of the entire PSMC family, GeneGo Metacore was leveraged to investigate downstream networks according to coexpression patterns of PSMC genes. An analysis on the GeneGo Metacore platform demonstrated that genes coexpressed with the six PSMC genes participated in biological processes related to cancer progression. MetaCore can be used to construct downstream networks associated with biological processes from uploaded genes. By uploading PSMC coexpressed genes from the METABRIC database into the Metacore platform, we found that several cancer progression-related pathways were correlated with genes of the PSMC family (Supplementary Figures 4, 5 and Supplementary Table 2), including "Cytoskeleton remodeling_Regulation of actin cytoskeleton organization by the kinase effectors of Rho GTPases", "Cell cycle_Role of APC in cell cycle regulation", "Cell cycle_Chromosome condensation in prometaphase", "Cell cycle_Nucleocytoplasmic transport of CDK/Cyclins", and "Transcription_Role of heterochromatin protein 1 family in transcriptional silencing" (Figure 7). Next, the STRING platform was used to externally validate and search for potential protein-protein interactions (PPIs). The resulting network with a core cluster contained all of the genes associated with cancer progression and metastasis (Figure 8).
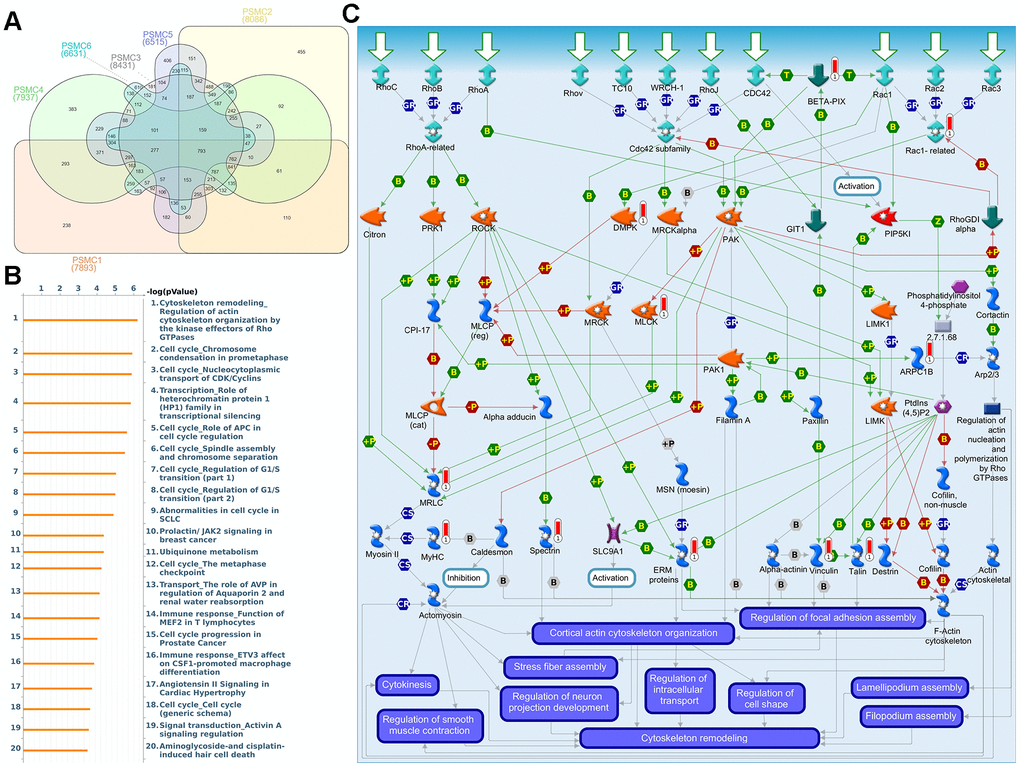
Figure 7. Coexpression of proteasome 26S subunit, ATPase (PSMC) genes and signal transduction pathways in breast cancer tissues. (A) Venn diagram of PSMC family coexpression networks in METABRIC breast cancer databases. PSMC genes were analyzed using METABRIC databases, and the intersection of coexpressed genes was plotted. (B) To explore potential networks regulated by PSMC family genes, we exported coexpressed genes and further uploaded them to the MetaCore platform for a pathway analysis. (C) The MetaCore pathway analysis of "biological processes" indicated that “Cytoskeleton remodeling_Regulation of actin cytoskeleton organization by the kinase effectors of Rho GTPases"-related pathways were correlated with breast cancer development.
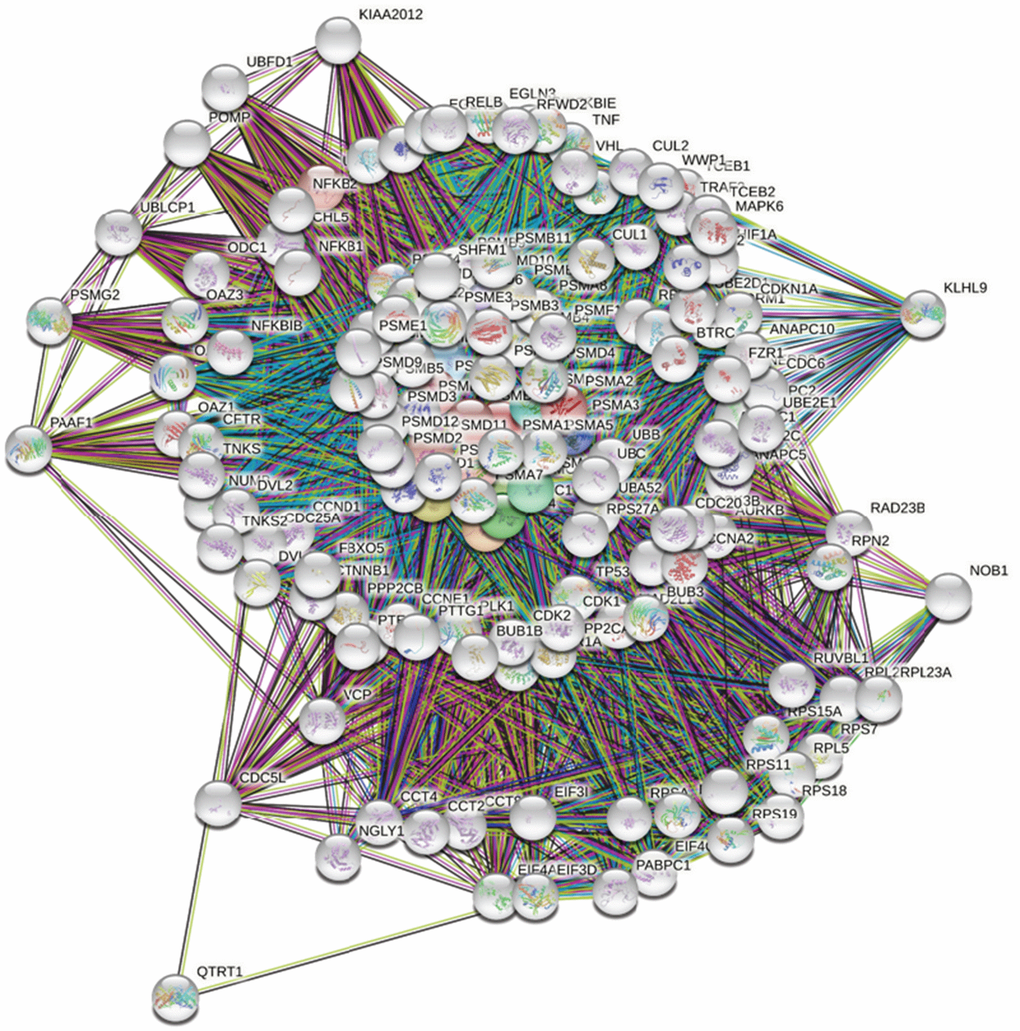
Figure 8. Network analysis of protein-protein interactions (PPIs) by the STRING platform. Genes associated with the proteasome 26S subunit, ATPase (PSMC) family were uploaded to the STRING platform to establish the network. Using k-means clustering, the network was further separated into different clusters.
Next, we explored whether individual genes of the PSMC family regulate specific pathways and networks in breast cancer development. We obtained coexpression profiles for PSMC1 from TCGA and METABRIC breast cancer datasets. Afterward, GeneGo Metacore annotations of each biological process suggested that genes coexpressed with PSMC1 were involved inG-protein-coupled receptor (GPCR)- and apoptosis-related pathways and networks such as “Chemotaxis_Lysophosphatidic acid signaling via GPCRs”, “Development_Positive regulation of WNT/Beta-catenin signaling in the cytoplasm”, and “Apoptosis and survival_Regulation of apoptosis by mitochondrial proteins”, and play essential roles in breast cancer (Supplementary Figure 6 and Supplementary Table 3). PSMC2-related genes were involved in Wnt- and hypoxia-related pathways and networks such as “Development_Negative regulation of WNT/Beta-catenin signaling in the cytoplasm” and “Transcription_HIF-1 targets”, which may be involved in breast cancer (Supplementary Figure 7 and Supplementary Table 4). Genes coexpressed with PSMC3 participated in processes of cytoskeleton- and organization-related pathways and networks such as “Cytoskeleton remodeling_Regulation of actin cytoskeleton organization by the kinase effectors of Rho GTPases” (Supplementary Figure 8 and Supplementary Table 5).
PSMC4-related genes were involved in mitogen-activated protein kinase (MAPK)- and inflammation-related pathways and networks such as “Signal transduction_CXCR4 signaling via MAPKs cascades” and “Signal transduction_Angiotensin II/AGTR1 signaling via Notch, Beta-catenin and NF-κB pathways”, which may participate in breast cancer (Supplementary Figure 9 and Supplementary Table 6). Genes found to be coexpressed with PSMC5 were involved in oxidative stress- and cell adhesion-related pathways and networks such as “Oxidative stress_ROS-induced cellular signaling” and “Cell adhesion_Tight junctions” (Supplementary Figure 10 and Supplementary Table 7). PSMC6-coexpressed genes were involved in calcium- and hormone-related pathways and networks such as “Signal transduction_Calcium-mediated signaling” and “Reproduction_Gonadotropin-releasing hormone (GnRH) signaling ”, which could participate in breast cancer (Supplementary Figure 11 and Supplementary Table 8).
Discussion
Breast cancer has the highest prevalence rate compared to other types of cancer, particularly in females. Despite several years of extraordinary efforts to increase our knowledge of tumor biology and improve surgical treatments and chemotherapies, prognoses of advanced breast cancer patients have not improved [27–32]. Therefore, it is very important to investigate new diagnostic tools and novel biomarkers that can allow us to refine patient prognoses and investigate effective interventions.
Most genes of the PSMC family are upregulated in many types and subtypes of cancer. PSMC members were proven to be involved in tumor progression. For example, overexpression of PFN1 is associated with PSMC1 in the MDA-MB-231 triple-negative breast cancer cell line and may involve multiple mechanisms for cancer progression [33]. PSMC2 is highly expressed in pancreatic cancer, and PSMC2-knockdown significantly decreased cell proliferation. PSMC3 was identified as a crucial node in a PPI network in glioma cells [34]. PSMC4 and PSMC5 contribute to prostate tumorigenesis [35]. Additionally, PSMC4 was identified as one of the best biomarkers for endometrial cancer [36], and risk model construction revealed that it is also a prognostic marker for the same type of cancer [37]. PSMC5 acts as a novel regulator and is involved in the extracellular signal-regulated kinase 1/2 signaling pathway [38], and it was observed to have a relatively higher cytoplasmic expression pattern in most cancer types [39]. Both the PSMC6 and MAPK8 genes were upregulated in melanosis coli patients [40], and CRISPR Genome-Wide Screening demonstrated that the PSMC6 subunit is an important and sensitive target for bortezomib in multiple myeloma cells [41].
Since the roles of PSMC family members in breast cancer are poorly described, the present findings show their importance, by providing preliminary clues for prospective studies in breast cancer research. Findings from the current study are in line with previous reports on the roles of PSMC genes in cancer. Both mRNA and protein levels of PSMC2, PSMC3, PSMC4, PSMC5, and PSMC6 were significant in cancer tissues, and PSMC1, PSMC3, PSMC4, PSMC5, and PSMC6 overexpression was associated with poor prognoses of breast cancer patients. Meanwhile, to further clarify its role of PSMC family genes in pan-cancer, we also used GEPIA2 database to confirm that PSMC family genes had prognostic value in these integrated analyses (Supplementary Figure 12), as well as the PSMC family gene expressions in CCLE database (Supplementary Figure 13), The coexpression analysis revealed the positive correlative roles of PSMC family genes in cytoskeletal remodeling and CDK/cyclins, as well as cell cycle-related pathways and networks, which are consistent with previous studies. To some extent, this is the first report on both mRNA and protein expressions of the PSMC family in cancer cell lines and tissues, together with their associations with breast cancer patient survival.
Collectively, by integrating multiple high-throughput databases, our study uncovered that PSMC genes have prognostic and predictive value in breast cancer. To comprehensively provide a complete picture of the PSMC members not only in breast but also in other types and subtypes of cancer, our results can be used as hints for further examination of this family, and possibly they can serve as novel biomarkers and potential prognostic indicators in breast cancer.
Materials and Methods
Oncomine analysis
Oncomine (https://www.oncomine.org/), a well-known high-throughput database for mRNA, was used to query expressions of PSMC family members [42]. In brief, each gene symbol of the PSMC family was used to search for expression levels in 20 types of cancer relative to matched normal-type samples. The search thresholds included a multiple of change of 2-fold, a p value of <0.01, and a gene ranking in the top 10%. The search output displayed the number of datasets that satisfied the above thresholds among all unique analyses. Upregulated genes in the generated dataset were displayed in a red gradient, decreasing with the top-ranked percentage, while downregulated genes in the generated dataset were presented in a blue gradient that decreased with the gene ranking. A gene could be upregulated in one dataset and downregulated in another depending on the search thresholds and study parameters. It is useful to examine discrepancies in gene expressions among studies, and plots of breast cancer subtypes were conducted with the ggpubr package in R environment as we previously described [43–46].
Cancer cell line encyclopedia (CCLE) analysis
In addition to investigating mRNA expressions of PSMC family members in cancer tissues from the Oncomine database, we further searched for their expression levels in cell lines via the CCLE database (https://portals.broadinstitute.org/ccle) [47]. The CCLE is a high-throughput web-based tool with large numbers of human cancer cell lines (n = 1457) and unique datasets (n = 136,488). An RNA sequencing method was selected to search for expressions of PSMC family members in 60 breast cancer cell lines, and results were plotted with default settings as we previously described [48–50].
Functional enrichment analysis of PSMC family members
To acquire coexpression patterns of PSMC family members in the METABRIC and cBioPortal databases [51], a Venn diagram was created using InteractiVenn (http://www.interactivenn.net/). Then, 1588 coexpressed genes were further uploaded to Gene Ontology for pathway and network analyses using the MetaCore platform (https://portal.genego.com/), a functional annotation platform for exploring the biological significance behind a large list of genes. Statistical significance as the boundary criterion was set to p<0.05, as we previously described [52–54].
Search tool for the retrieval of interacting genes (STRING)
Together with investigating mRNA expression levels, we concomitantly performed searches for PPI networks of PSMC family members based on coexpressed genes using the STRING database. STRING has protein data comprising 24.6 million proteins in more than 5000 organisms, resulting in more than 2 billion interactions [55]. We selected the k-means clustering algorithm to classify target proteins into different clusters.
Kaplan–Meier plot of survival analysis
To understand how mRNA expression levels of PSMC gene family members affected relapse-free survival (RFS) and distant metastasis-free survival (DMFS) of breast cancer patients, we performed a survival analysis using the Kaplan–Meier plotter database (https://kmplot.com/) [56]. Meanwhile, we also assessed the prognostic value of PSMC gene family members for pan-cancer analysis in GEPIA2, which contains RNA sequencing expression data from different types of tumors as well as the normal samples from the TCGA and GTEx projects, including Cholangio carcinoma, Colon adenocarcinoma, Lymphoid Neoplasm Diffuse Large B-cell Lymphoma, Esophageal carcinoma, Pancreatic adenocarcinoma, Pheochromocytoma and Paraganglioma, Prostate adenocarcinoma, Rectum adenocarcinoma, Sarcoma, Skin Cutaneous Melanoma, Stomach adenocarcinoma, Testicular Germ Cell Tumors, Thyroid carcinoma, Thymoma, Uterine Corpus Endometrial Carcinoma, Uterine Carcinosarcoma and Uveal Melanoma, Glioblastoma multiforme, Head and Neck squamous cell carcinoma, Kidney Chromophobe, Kidney renal clear cell carcinoma, Kidney renal papillary cell carcinoma, Acute Myeloid Leukemia, Brain Lower Grade Glioma, Adrenocortical carcinoma, Bladder Urothelial Carcinoma, Breast invasive carcinoma, Cervical squamous cell carcinoma and endocervical adenocarcinoma, Liver hepatocellular carcinoma, Lung adenocarcinoma, Lung squamous cell carcinoma, Mesothelioma, Ovarian serous cystadenocarcinoma [57, 58]. All default settings inKaplan–Meier were selected for our analysis, namely survival curves, log-rank p values, and hazard ratios with 95% confidence intervals (CIs).
Tumor immune estimation resource (TIMER)
To further analyze the infiltration level of immune cells, we applied TIMER 2.0 (http://timer.comp-genomics.org) across 31 cancer types comprising of more 10,000 samples [59, 60]. The differences between normal and tumor in mRNA expression of PSMC genes were obtained using DiffExp module. We then selected B cells, T cells clusters including CD4+ and CD8+ together with neutrophils, macrophages, and dendritic cells for our analysis.
Supplementary Materials
Author Contributions
Conceptualization, T.J.K. and C.C.W.; methodology, N.N.P.; software, Y.H.L.; validation, H.D.K.T and G.A; formal analysis, N.N.P.; investigation, J.Y.C. and C.C.W.; resources, T.J. K. and Y.F.W.; data curation, C.C.W and K.H.L.; writing—original draft preparation, T.J. K., C.C.W., and N.N.P.; writing—review and editing, J.Y.C. and C.Y.W.; visualization, N.N.P.; supervision, J.Y.C. and C.C.W.; project administration, J.Y.C. and C.Y.W.; funding acquisition, J.Y.C. and C.Y.W. All authors have read and agreed to the published version of the manuscript.
Acknowledgments
The authors especially thank Mr. Daniel P. Chamberlin from the Office of Research and Development at Taipei Medical University for professional English editing. Bioinformatics analyses and data mining were conducted by the Bioinformatics Core Facility at Taipei Medical University.
Conflicts of Interest
The authors declare that they have no conflicts of interest.
Funding
The study was supported by grants from Taipei Medical University Hospital (107TMU-TMUH-02 to C.C.W. and J.Y.C.) and the Ministry of Science and Technology of Taiwan (110-2636-B-038-004 to J.Y.C).
References
- 1. Nardone A, Weir H, Delpuech O, Brown H, De Angelis C, Cataldo ML, Fu X, Shea MJ, Mitchell T, Veeraraghavan J, Nagi C, Pilling M, Rimawi MF, et al. The oral selective oestrogen receptor degrader (SERD) AZD9496 is comparable to fulvestrant in antagonising ER and circumventing endocrine resistance. Br J Cancer. 2019; 120:331–39. https://doi.org/10.1038/s41416-018-0354-9 [PubMed]
- 2. Chen SH, Cheung CHA. Challenges in Treating Estrogen Receptor-Positive Breast Cancer. Estrogen: IntechOpen 2018. https://doi.org/10.5772/intechopen.79263
- 3. Finn RS, Aleshin A, Slamon DJ. Targeting the cyclin-dependent kinases (CDK) 4/6 in estrogen receptor-positive breast cancers. Breast Cancer Res. 2016; 18:17. https://doi.org/10.1186/s13058-015-0661-5 [PubMed]
- 4. Burris HA 3rd. Overcoming acquired resistance to anticancer therapy: focus on the PI3K/AKT/mTOR pathway. Cancer Chemother Pharmacol. 2013; 71:829–42. https://doi.org/10.1007/s00280-012-2043-3 [PubMed]
- 5. Munster PN, Thurn KT, Thomas S, Raha P, Lacevic M, Miller A, Melisko M, Ismail-Khan R, Rugo H, Moasser M, Minton SE. A phase II study of the histone deacetylase inhibitor vorinostat combined with tamoxifen for the treatment of patients with hormone therapy-resistant breast cancer. Br J Cancer. 2011; 104:1828–35. https://doi.org/10.1038/bjc.2011.156 [PubMed]
- 6. Vaillant F, Merino D, Lee L, Breslin K, Pal B, Ritchie ME, Smyth GK, Christie M, Phillipson LJ, Burns CJ, Mann GB, Visvader JE, Lindeman GJ. Targeting BCL-2 with the BH3 mimetic ABT-199 in estrogen receptor-positive breast cancer. Cancer Cell. 2013; 24:120–29. https://doi.org/10.1016/j.ccr.2013.06.002 [PubMed]
- 7. Lok SW, Whittle JR, Vaillant F, Teh CE, Lo LL, Policheni AN, Bergin AR, Desai J, Ftouni S, Gandolfo LC, Liew D, Liu HK, Mann GB, et al. A Phase Ib Dose-Escalation and Expansion Study of the BCL2 Inhibitor Venetoclax Combined with Tamoxifen in ER and BCL2-Positive Metastatic Breast Cancer. Cancer Discov. 2019; 9:354–69. https://doi.org/10.1158/2159-8290.CD-18-1151 [PubMed]
- 8. Kito Y, Matsumoto M, Hatano A, Takami T, Oshikawa K, Matsumoto A, Nakayama KI. Cell cycle-dependent localization of the proteasome to chromatin. Sci Rep. 2020; 10:5801. https://doi.org/10.1038/s41598-020-62697-2 [PubMed]
- 9. Grigoreva TA, Tribulovich VG, Garabadzhiu AV, Melino G, Barlev NA. The 26S proteasome is a multifaceted target for anti-cancer therapies. Oncotarget. 2015; 6:24733–49. https://doi.org/10.18632/oncotarget.4619 [PubMed]
- 10. Owyong M, Chou J, van den Bijgaart RJ, Kong N, Efe G, Maynard C, Talmi-Frank D, Solomonov I, Koopman C, Hadler-Olsen E, Headley M, Lin C, Wang CY, et al. MMP9 modulates the metastatic cascade and immune landscape for breast cancer anti-metastatic therapy. Life Sci Alliance. 2019; 2:e201800226. https://doi.org/10.26508/lsa.201800226 [PubMed]
- 11. Wang CY, Li CY, Hsu HP, Cho CY, Yen MC, Weng TY, Chen WC, Hung YH, Lee KT, Hung JH, Chen YL, Lai MD. PSMB5 plays a dual role in cancer development and immunosuppression. Am J Cancer Res. 2017; 7:2103–20. [PubMed]
- 12. Perissi V, Aggarwal A, Glass CK, Rose DW, Rosenfeld MG. A corepressor/coactivator exchange complex required for transcriptional activation by nuclear receptors and other regulated transcription factors. Cell. 2004; 116:511–26. https://doi.org/10.1016/s0092-8674(04)00133-3 [PubMed]
- 13. Zhang Y, Cao X, Li P, Fan Y, Zhang L, Li W, Liu Y. PSMC6 promotes osteoblast apoptosis through inhibiting PI3K/AKT signaling pathway activation in ovariectomy-induced osteoporosis mouse model. J Cell Physiol. 2020; 235:5511–24. https://doi.org/10.1002/jcp.29261 [PubMed]
- 14. Qin J, Wang W, An F, Huang W, Ding J. PSMC2 is Up-regulated in Pancreatic Cancer and Promotes Cancer Cell Proliferation and Inhibits Apoptosis. J Cancer. 2019; 10:4939–46. https://doi.org/10.7150/jca.27616 [PubMed]
- 15. Song M, Wang Y, Zhang Z, Wang S. PSMC2 is up-regulated in osteosarcoma and regulates osteosarcoma cell proliferation, apoptosis and migration. Oncotarget. 2017; 8:933–53. https://doi.org/10.18632/oncotarget.13511 [PubMed]
- 16. Li X, Sun Y, Huang S, Chen Y, Chen X, Li M, Si X, He X, Zheng H, Zhong L, Yang Y, Liao W, Liao Y, et al. Inhibition of AZIN2-sv induces neovascularization and improves prognosis after myocardial infarction by blocking ubiquitin-dependent talin1 degradation and activating the Akt pathway. EBioMedicine. 2019; 39:69–82. https://doi.org/10.1016/j.ebiom.2018.12.001 [PubMed]
- 17. Ding J, Li Y, Fan H, Xu W, Gao R, Bai S, Zhu Z, Yang W, Gong Y, Yang J, Zhou J. Knockdown of PSMC3IP suppresses the proliferation and xenografted tumorigenesis of hepatocellular carcinoma cell. J Cell Biochem. 2019; 120:5449–58. https://doi.org/10.1002/jcb.27824 [PubMed]
- 18. Rhodes DR, Kalyana-Sundaram S, Mahavisno V, Varambally R, Yu J, Briggs BB, Barrette TR, Anstet MJ, Kincead-Beal C, Kulkarni P, Varambally S, Ghosh D, Chinnaiyan AM. Oncomine 3.0: genes, pathways, and networks in a collection of 18,000 cancer gene expression profiles. Neoplasia. 2007; 9:166–80. https://doi.org/10.1593/neo.07112 [PubMed]
- 19. Huang TC, Lee PT, Wu MH, Huang CC, Ko CY, Lee YC, Lin DY, Cheng YW, Lee KH. Distinct roles and differential expression levels of Wnt5a mRNA isoforms in colorectal cancer cells. PLoS One. 2017; 12:e0181034. https://doi.org/10.1371/journal.pone.0181034 [PubMed]
- 20. Cheng LC, Chao YJ, Overman MJ, Wang CY, Phan NN, Chen YL, Wang TW, Hsu HP, Shan YS, Lai MD. Increased expression of secreted frizzled related protein 1 (SFRP1) predicts ampullary adenocarcinoma recurrence. Sci Rep. 2020; 10:13255. https://doi.org/10.1038/s41598-020-69899-8 [PubMed]
- 21. Hoheisel JD. Microarray technology: beyond transcript profiling and genotype analysis. Nat Rev Genet. 2006; 7:200–10. https://doi.org/10.1038/nrg1809 [PubMed]
- 22. Anuraga G, Tang WC, Phan NN, Ta HD, Liu YH, Wu YF, Lee KH, Wang CY. Comprehensive Analysis of Prognostic and Genetic Signatures for General Transcription Factor III (GTF3) in Clinical Colorectal Cancer Patients Using Bioinformatics Approaches. Curr Issues Mol Biol. 2021; 43:2. https://doi.org/10.3390/cimb43010002 [PubMed]
- 23. Khoa Ta HD, Tang WC, Phan NN, Anuraga G, Hou SY, Chiao CC, Liu YH, Wu YF, Lee KH, Wang CY. Analysis of LAGEs Family Gene Signature and Prognostic Relevance in Breast Cancer. Diagnostics (Basel). 2021; 11:726. https://doi.org/10.3390/diagnostics11040726 [PubMed]
- 24. Wang CY, Chao YJ, Chen YL, Wang TW, Phan NN, Hsu HP, Shan YS, Lai MD. Upregulation of peroxisome proliferator-activated receptor-α and the lipid metabolism pathway promotes carcinogenesis of ampullary cancer. Int J Med Sci. 2021; 18:256–69. https://doi.org/10.7150/ijms.48123 [PubMed]
- 25. Wu PS, Yen JH, Wang CY, Chen PY, Hung JH, Wu MJ. 8-Hydroxydaidzein, an Isoflavone from Fermented Soybean, Induces Autophagy, Apoptosis, Differentiation, and Degradation of Oncoprotein BCR-ABL in K562 Cells. Biomedicines. 2020; 8:506. https://doi.org/10.3390/biomedicines8110506 [PubMed]
- 26. Cheng LC, Chao YJ, Wang CY, Phan NN, Chen YL, Wang TW, Hsu HP, Lin YJ, Shan YS, Lai MD. Cancer-Derived Transforming Growth Factor-β Modulates Tumor-Associated Macrophages in Ampullary Cancer. Onco Targets Ther. 2020; 13:7503–16. https://doi.org/10.2147/OTT.S246714 [PubMed]
- 27. Barrett T, Wilhite SE, Ledoux P, Evangelista C, Kim IF, Tomashevsky M, Marshall KA, Phillippy KH, Sherman PM, Holko M, Yefanov A, Lee H, Zhang N, et al. NCBI GEO: archive for functional genomics data sets--update. Nucleic Acids Res. 2013; 41:D991–95. https://doi.org/10.1093/nar/gks1193 [PubMed]
- 28. Lin JC, Liu TP, Yang PM. CDKN2A-Inactivated Pancreatic Ductal Adenocarcinoma Exhibits Therapeutic Sensitivity to Paclitaxel: A Bioinformatics Study. J Clin Med. 2020; 9:4019. https://doi.org/10.3390/jcm9124019 [PubMed]
- 29. Lin TY, Wang PW, Huang CH, Yang PM, Pan TL. Characterizing the Relapse Potential in Different Luminal Subtypes of Breast Cancers with Functional Proteomics. Int J Mol Sci. 2020; 21:6077. https://doi.org/10.3390/ijms21176077 [PubMed]
- 30. Liu LW, Hsieh YY, Yang PM. Bioinformatics Data Mining Repurposes the JAK2 (Janus Kinase 2) Inhibitor Fedratinib for Treating Pancreatic Ductal Adenocarcinoma by Reversing the KRAS (Kirsten Rat Sarcoma 2 Viral Oncogene Homolog)-Driven Gene Signature. J Pers Med. 2020; 10:130. https://doi.org/10.3390/jpm10030130 [PubMed]
- 31. Yang PM, Hsieh YY, Du JL, Yen SC, Hung CF. Sequential Interferon β-Cisplatin Treatment Enhances the Surface Exposure of Calreticulin in Cancer Cells via an Interferon Regulatory Factor 1-Dependent Manner. Biomolecules. 2020; 10:643. https://doi.org/10.3390/biom10040643 [PubMed]
- 32. Yang PM, Lin LS, Liu TP. Sorafenib Inhibits Ribonucleotide Reductase Regulatory Subunit M2 (RRM2) in Hepatocellular Carcinoma Cells. Biomolecules. 2020; 10:117. https://doi.org/10.3390/biom10010117 [PubMed]
- 33. Coumans JV, Gau D, Poljak A, Wasinger V, Roy P, Moens PD. Profilin-1 overexpression in MDA-MB-231 breast cancer cells is associated with alterations in proteomics biomarkers of cell proliferation, survival, and motility as revealed by global proteomics analyses. OMICS. 2014; 18:778–91. https://doi.org/10.1089/omi.2014.0075 [PubMed]
- 34. Wang R, Wei B, Wei J, Li Z, Tian Y, Du C. Caspase-related apoptosis genes in gliomas by RNA-seq and bioinformatics analysis. J Clin Neurosci. 2016; 33:259–63. https://doi.org/10.1016/j.jocn.2016.03.041 [PubMed]
- 35. Hellwinkel OJ, Asong LE, Rogmann JP, Sültmann H, Wagner C, Schlomm T, Eichelberg C. Transcription alterations of members of the ubiquitin-proteasome network in prostate carcinoma. Prostate Cancer Prostatic Dis. 2011; 14:38–45. https://doi.org/10.1038/pcan.2010.48 [PubMed]
- 36. Ayakannu T, Taylor AH, Konje JC. Selection of Endogenous Control Reference Genes for Studies on Type 1 or Type 2 Endometrial Cancer. Sci Rep. 2020; 10:8468. https://doi.org/10.1038/s41598-020-64663-4 [PubMed]
- 37. Zhou H, Zhang C, Li H, Chen L, Cheng X. A novel risk score system of immune genes associated with prognosis in endometrial cancer. Cancer Cell Int. 2020; 20:240. https://doi.org/10.1186/s12935-020-01317-5 [PubMed]
- 38. Jang ER, Jang H, Shi P, Popa G, Jeoung M, Galperin E. Spatial control of Shoc2-scaffold-mediated ERK1/2 signaling requires remodeling activity of the ATPase PSMC5. J Cell Sci. 2015; 128:4428–41. https://doi.org/10.1242/jcs.177543 [PubMed]
- 39. Jhaveri DT, Kim MS, Thompson ED, Huang L, Sharma R, Klein AP, Zheng L, Le DT, Laheru DA, Pandey A, Jaffee EM, Anders RA. Using Quantitative Seroproteomics to Identify Antibody Biomarkers in Pancreatic Cancer. Cancer Immunol Res. 2016; 4:225–33. https://doi.org/10.1158/2326-6066.CIR-15-0200-T [PubMed]
- 40. Hua X, Chen J, Wu L. Identification of candidate biomarkers associated with apoptosis in melanosis coli: GNG5, LPAR3, MAPK8, and PSMC6. Biosci Rep. 2019; 39:BSR20181369. https://doi.org/10.1042/BSR20181369 [PubMed]
- 41. Shi CX, Kortüm KM, Zhu YX, Bruins LA, Jedlowski P, Votruba PG, Luo M, Stewart RA, Ahmann J, Braggio E, Stewart AK. CRISPR Genome-Wide Screening Identifies Dependence on the Proteasome Subunit PSMC6 for Bortezomib Sensitivity in Multiple Myeloma. Mol Cancer Ther. 2017; 16:2862–70. https://doi.org/10.1158/1535-7163.MCT-17-0130 [PubMed]
- 42. Rhodes DR, Yu J, Shanker K, Deshpande N, Varambally R, Ghosh D, Barrette T, Pandey A, Chinnaiyan AM. ONCOMINE: a cancer microarray database and integrated data-mining platform. Neoplasia. 2004; 6:1–6. https://doi.org/10.1016/s1476-5586(04)80047-2 [PubMed]
- 43. Sun Z, Wang CY, Lawson DA, Kwek S, Velozo HG, Owyong M, Lai MD, Fong L, Wilson M, Su H, Werb Z, Cooke DL. Single-cell RNA sequencing reveals gene expression signatures of breast cancer-associated endothelial cells. Oncotarget. 2017; 9:10945–61. https://doi.org/10.18632/oncotarget.23760 [PubMed]
- 44. Cooke DL, McCoy DB, Halbach VV, Hetts SW, Amans MR, Dowd CF, Higashida RT, Lawson D, Nelson J, Wang CY, Kim H, Werb Z, McCulloch C, et al. Endovascular Biopsy: In Vivo Cerebral Aneurysm Endothelial Cell Sampling and Gene Expression Analysis. Transl Stroke Res. 2018; 9:20–33. https://doi.org/10.1007/s12975-017-0560-4 [PubMed]
- 45. Hung YH, Huang HL, Chen WC, Yen MC, Cho CY, Weng TY, Wang CY, Chen YL, Chen LT, Lai MD. Argininosuccinate lyase interacts with cyclin A2 in cytoplasm and modulates growth of liver tumor cells. Oncol Rep. 2017; 37:969–78. https://doi.org/10.3892/or.2016.5334 [PubMed]
- 46. Wu CC, Ekanem TI, Phan NN, Loan DT, Hou SY, Lee KH, Wang CY. Gene signatures and prognostic analyses of the Tob/BTG pituitary tumor-transforming gene (PTTG) family in clinical breast cancer patients. Int J Med Sci. 2020; 17:3112–24. https://doi.org/10.7150/ijms.49652 [PubMed]
- 47. Barretina J, Caponigro G, Stransky N, Venkatesan K, Margolin AA, Kim S, Wilson CJ, Lehár J, Kryukov GV, Sonkin D, Reddy A, Liu M, Murray L, et al. The Cancer Cell Line Encyclopedia enables predictive modelling of anticancer drug sensitivity. Nature. 2012; 483:603–07. https://doi.org/10.1038/nature11003 [PubMed]
- 48. Allaire J. RStudio: integrated development environment for R. Boston, MA. 2012; 770:394.
- 49. Hsu HP, Wang CY, Hsieh PY, Fang JH, Chen YL. Knockdown of serine/threonine-protein kinase 24 promotes tumorigenesis and myeloid-derived suppressor cell expansion in an orthotopic immunocompetent gastric cancer animal model. J Cancer. 2020; 11:213–28. https://doi.org/10.7150/jca.35821 [PubMed]
- 50. Wang CY, Chang YC, Kuo YL, Lee KT, Chen PS, Cheung CH, Chang CP, Phan NN, Shen MR, Hsu HP. Mutation of the PTCH1 gene predicts recurrence of breast cancer. Sci Rep. 2019; 9:16359. https://doi.org/10.1038/s41598-019-52617-4 [PubMed]
- 51. Cerami E, Gao J, Dogrusoz U, Gross BE, Sumer SO, Aksoy BA, Jacobsen A, Byrne CJ, Heuer ML, Larsson E, Antipin Y, Reva B, Goldberg AP, et al. The cBio cancer genomics portal: an open platform for exploring multidimensional cancer genomics data. Cancer Discov. 2012; 2:401–04. https://doi.org/10.1158/2159-8290.CD-12-0095 [PubMed]
- 52. Wang CY, Chiao CC, Phan NN, Li CY, Sun ZD, Jiang JZ, Hung JH, Chen YL, Yen MC, Weng TY, Chen WC, Hsu HP, Lai MD. Gene signatures and potential therapeutic targets of amino acid metabolism in estrogen receptor-positive breast cancer. Am J Cancer Res. 2020; 10:95–113. [PubMed]
- 53. Chen PS, Hsu HP, Phan NN, Yen MC, Chen FW, Liu YW, Lin FP, Feng SY, Cheng TL, Yeh PH, Omar HA, Sun Z, Jiang JZ, et al. CCDC167 as a potential therapeutic target and regulator of cell cycle-related networks in breast cancer. Aging (Albany NY). 2021; 13:4157–81. https://doi.org/10.18632/aging.202382 [PubMed]
- 54. Liu HL, Yeh IJ, Phan NN, Wu YH, Yen MC, Hung JH, Chiao CC, Chen CF, Sun Z, Jiang JZ, Hsu HP, Wang CY, Lai MD. Gene signatures of SARS-CoV/SARS-CoV-2-infected ferret lungs in short- and long-term models. Infect Genet Evol. 2020; 85:104438. https://doi.org/10.1016/j.meegid.2020.104438 [PubMed]
- 55. Szklarczyk D, Gable AL, Lyon D, Junge A, Wyder S, Huerta-Cepas J, Simonovic M, Doncheva NT, Morris JH, Bork P, Jensen LJ, Mering CV. STRING v11: protein-protein association networks with increased coverage, supporting functional discovery in genome-wide experimental datasets. Nucleic Acids Res. 2019; 47:D607–13. https://doi.org/10.1093/nar/gky1131 [PubMed]
- 56. Györffy B, Lanczky A, Eklund AC, Denkert C, Budczies J, Li Q, Szallasi Z. An online survival analysis tool to rapidly assess the effect of 22,277 genes on breast cancer prognosis using microarray data of 1,809 patients. Breast Cancer Res Treat. 2010; 123:725–31. https://doi.org/10.1007/s10549-009-0674-9 [PubMed]
- 57. Tang Z, Li C, Kang B, Gao G, Li C, Zhang Z. GEPIA: a web server for cancer and normal gene expression profiling and interactive analyses. Nucleic Acids Res. 2017; 45:W98–102. https://doi.org/10.1093/nar/gkx247 [PubMed]
- 58. Tang Z, Kang B, Li C, Chen T, Zhang Z. GEPIA2: an enhanced web server for large-scale expression profiling and interactive analysis. Nucleic Acids Res. 2019; 47:W556–60. https://doi.org/10.1093/nar/gkz430 [PubMed]
- 59. Li T, Fan J, Wang B, Traugh N, Chen Q, Liu JS, Li B, Liu XS. TIMER: A Web Server for Comprehensive Analysis of Tumor-Infiltrating Immune Cells. Cancer Res. 2017; 77:e108–10. https://doi.org/10.1158/0008-5472.CAN-17-0307 [PubMed]
- 60. Galon J, Bruni D. Approaches to treat immune hot, altered and cold tumours with combination immunotherapies. Nat Rev Drug Discov. 2019; 18:197–218. https://doi.org/10.1038/s41573-018-0007-y [PubMed]