


Introduction
Head and neck squamous cell carcinoma (HNSCC) affects more than 800,000 people each year worldwide, leading patients with HNSCC about sixth in global incidence [1, 2]. HNSCC is a collection of malignancies with complex local autonomy, given that it originates from the squamous epithelium of the upper aerodigestive tract [3], attributing to this malignancy with high morbidity and mortality. Although advances in therapeutic strategies on local control have been improved, the 5-year overall survival (OS) rate remains 40%-50% [4, 5]. In this regard, there is a potential to identify novel biomarkers to broaden current treatment and enhance survival for patients with HNSCC.
The ubiquitin-proteasome system (UPS) is responsible for the degradation of more than 80% of intracellular proteins, such as short-lived and misfolded or non-essential proteins [6, 7]. UPS is involved in multiple biological functions, including gene transcription, translation and repair, cell cycle, cell proliferation, apoptosis, and antigen presentation [8, 9]. As UPS is involved in multitudinous critical functions, dysfunction of UPS may result in various diseases, such as nervous system diseases and cancers [10–14]. The UPS is a complex system encompassing a huge number of genes, including those encoding 10 ubiquitin (Ub)-activating enzymes (E1s), approximately 40 Ub-conjugating enzymes (E2s), over 600 validated Ub-protein ligases (E3s), approximately 100 deubiquitinating enzymes (DUBs), and nearly 50 proteasome subunits [15–18]. Accumulating studies have demonstrated that aberrant expression of UPS members altered proteolysis, facilitating the tumorigenesis and progression of HNSCC [19]. For instance, UBE2C (ubiquitin-conjugating enzyme E2 C), an E3s that overexpressed in various cancers and served as an inhibitor of p53 by facilitating its ubiquitination-mediated degradation. It is an agonist of ZEB1/2, ABCG2, and ERCC1 by promoting their transcript, which played an essential role in increasing cell proliferation and invasion, inducing epithelial-mesenchymal transitions (EMT), and chemotherapeutic resistance [20–23]. In addition, abnormal expression of PSMD2 (proteasome 26S subunit ubiquitin receptor, non-ATPase 2), a subunit of the 19S regulatory particle (RP) of the proteasome, has been reported in lung adenocarcinoma, breast cancer, and hepatocellular carcinoma [24–26]. The clinical significance of UPS genes has not been systematically investigated in patients with HNSCC. Therefore, the mechanism underlying the relationship between UPS-related genes (UPSGs) and the prognosis of HNSCC patients still needs to be further determined.
The Gene Expression Omnibus (GEO) and The Cancer Genome Atlas (TCGA) provide potent resources for directly obtaining gene expression profiles from patient tissues. Therefore, this study aims to provide a systematic investigation of the expression patterns via bioinformatics analysis and a prognostic risk model based on the UPSGs. We proposed that UPSGs are associated with the prognosis of patients with HNSCC. Importantly, our finding demonstrated that HNSCC patients with poor prognoses have high-risk scores that are associated with impaired T cell antitumor responses.
Results
Identification of differentially expressed UPSGs in HNSCC tissues
We analyzed the expression of 804 UPSGs (Supplementary Table 1) that were distributed through all chromosomes in 498 head and neck tumor tissues and 44 adjacent tissues. 114 differentially expressed UPSGs (DEUPSGs) were identified, as shown in Supplementary Figure 1, where 97 upregulated and 17 downregulated DEUPSGs were observed (FDR < 0.05 and |Fold change| > 1.5, Figure 1A, 1B). The genomic information of DEUPSGs was shown in Supplementary Table 2.
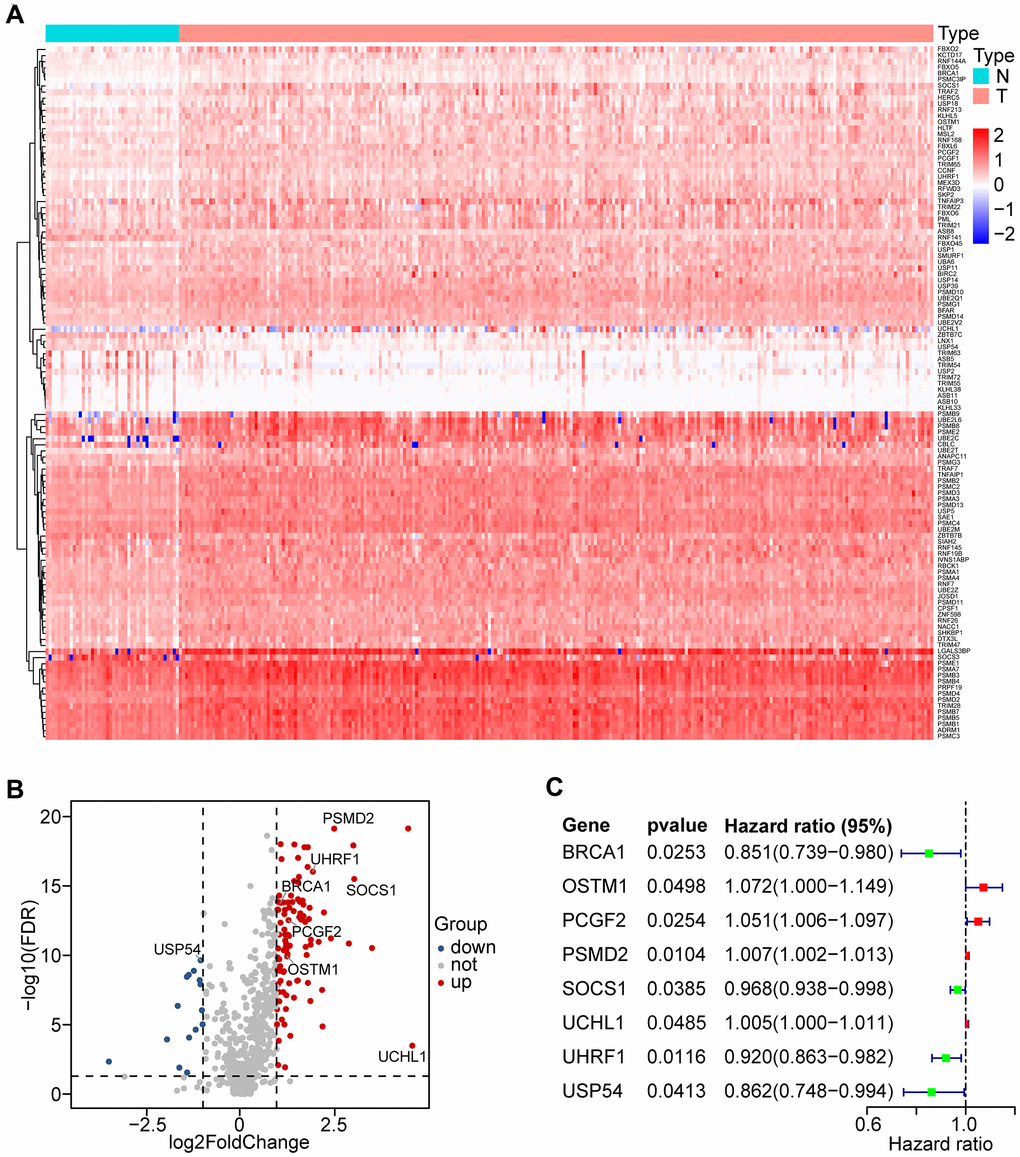
Figure 1. Differential expression of UPS-related genes (UPSGs) and identification of 8 UPSGs with prognostic value in HNSCC samples. (A) 114 differentially expressed UPSGs (DEUPSGs) are depicted as a heat map. (B) 97 upregulated and 17 downregulated DEUPSGs are shown as a volcano plot (FDR < 0.05 and |Fold change| > 1.5). (C) The eight risk DEUPSGs in the prognostic risk model are shown using a forest plot.
Functional analysis of DEUPSGs in HNSCC
To assess the potential functions of DEUPSGs, Gene Ontology (GO) and Kyoto Encyclopedia of Genes and Genomes (KEGG) pathway were analyzed using the TCGA database. The most significant GO terms were enriched for determining DEUPSGs functions, with respect to biological process (BP), cellular component (CC), and molecular function (MF), were shown in Figure 2A–2C. Enriched terms were significantly correlated with the proteasomal protein catabolic process, proteasome complex, and ubiquitin-like protein transferase activity. The KEGG pathway enrichment analysis indicated that ubiquitin-mediated proteolysis and proteasome pathways may play essential roles in the formation and development of HNSCC (Figure 2D).
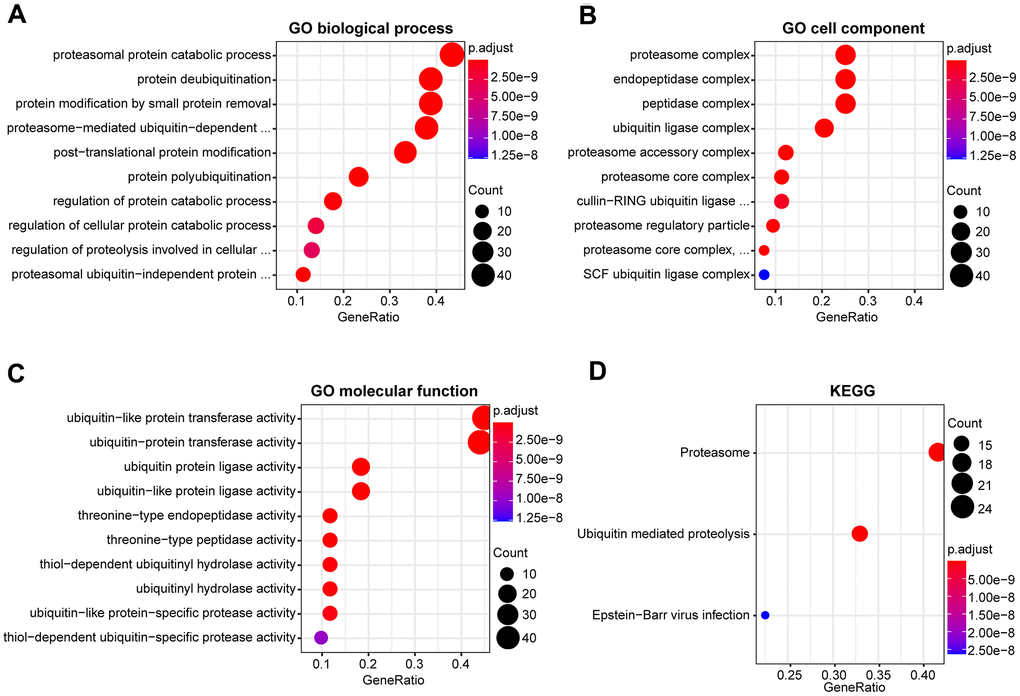
Figure 2. Functional enrichment analysis of DEUPSGs in HNSCC. (A–C) The top ten enriched terms in the GO analysis belonged to biological process (A), cell component (B), and molecular function (C) for DEUPSGs are demonstrated using an enriched scatter diagram. (D) The enriched pathways of the KEGG pathway analysis are showed using a scatter diagram. GO, gene ontology; KEGG, Kyoto Encyclopedia of Genes and Genomes.
Construction and identification of the prognostic risk model
To identify the prognostic value of DEUPSGs in HNSCC patients, Univariate Cox regression analysis was used to confirm the expression patterns of 114 DEUPSGs in the TCGA training set. The forest plots displayed the eight prognosis-related DEUPSGs in HNSCC (Figure 1C). The prognostic risk model was established based on the eight prognosis-related DEUPSGs using LASSO regression analysis (Supplementary Figure 2). The coefficient values of the eight DEUPSGs were shown in Table 1. The risk score was calculated for each sample as the following equation:
Risk score = BRCA1 * (-0.037) + OSTM1 * 0.0294 + PCGF2 * 0.0502 + PSMD2 * 0.0058 + SOCS1 * (-0.0157) + UCHL1 * 0.0022 + UHRF1 * (-0.0496) + USP54 * (-0.0887)
Table 1. List of the eight prognostic genes of the risk model in the TCGA training set.
| ENSG ID | Symbol | Location | Expression status | Coefficient |
| ENSG00000012048 | BRCA1 | Chromosome 17 | Upregulated | -0.0370 |
| ENSG00000081087 | OSTM1 | Chromosome 10 | Upregulated | 0.0294 |
| ENSG00000277258 | PCGF2 | Chromosome 17 | Upregulated | 0.0502 |
| ENSG00000175166 | PSMD2 | Chromosome 3 | Upregulated | 0.0058 |
| ENSG00000185338 | SOCS1 | Chromosome 16 | Upregulated | -0.0157 |
| ENSG00000154277 | UCHL1 | Chromosome 4 | Upregulated | 0.0022 |
| ENSG00000276043 | UHRF1 | Chromosome 19 | Upregulated | -0.0496 |
| ENSG00000166348 | USP54 | Chromosome 10 | Downregulated | -0.0887 |
Samples were classified into two groups based on the median risk score (0.0622) of the training set. OS analysis indicated that the low-risk group has a markedly better prognosis than the high-risk group (P < 0.0001, Figure 3A). The receiver operating characteristic (ROC) curve indicated that the area under the ROC (AUC) value was 0.664 (Figure 3B). The risk scores and OS were performed by risk plots and scatter plots (Figure 3C, 3D). Expression patterns of risk genes in the high- and low-risk groups were depicted in Figure 3E, showing that high expression levels of PSMD2, OSTM1 (Osteoclastogenesis associated transmembrane protein 1), PCGF2 (polycomb group ring finger 2), and UCHL1 (ubiquitin C-terminal hydrolase L1) can be considered as risk factors were correlated with a high-risk score. Furthermore, high expression levels of BRCA1 (BRCA1 DNA repair associated), SOCS1 (suppressor of cytokine signaling 1), UHRF1 (ubiquitin-like with PHD and ring finger domains 1), and USP54 (ubiquitin specific peptidase 54) were associated with a low-risk score.
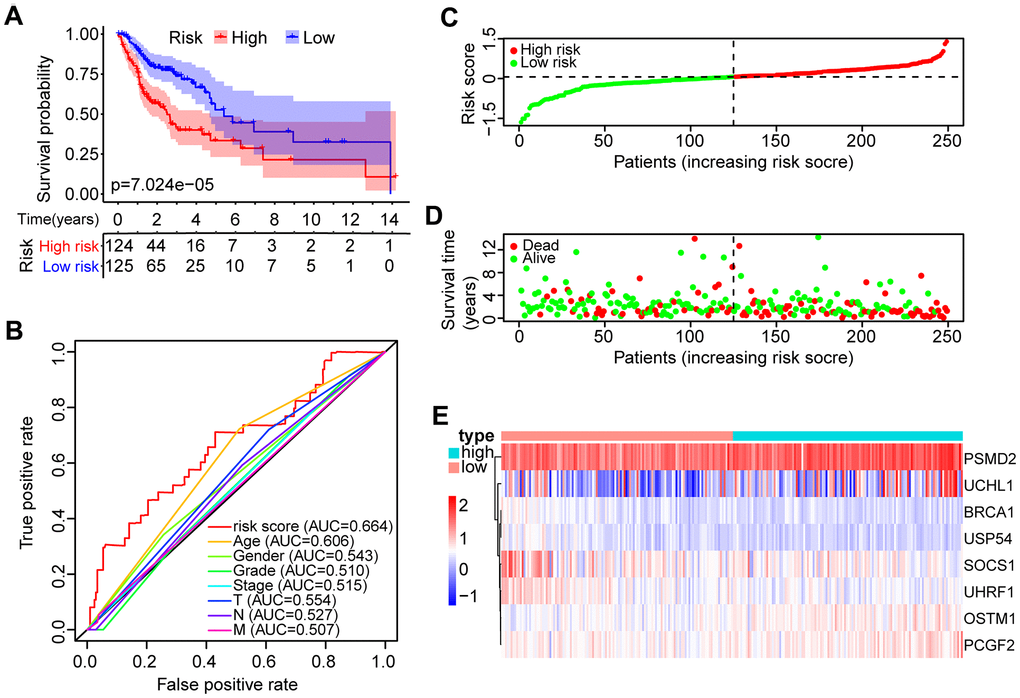
Figure 3. Identification of the prognostic risk model in HNSCC patients. (A) Kaplan-Meier survival curve with overall survival (OS) in the high- and low-risk HNSCC patients in the TCGA training set. (B) ROC curve showing AUC for the risk score and other clinical factors of HNSCC patients in the TCGA training set. (C) The risk plot distribution of the high- and low-risk HNSCC patients. (D) Scatter plot showing the survival status of HNSCC patients. (E) The expression of risk genes of HNSCC samples in the TCGA training set.
An independent validation data set was involved in the evaluation of the risk model. Based on the prognostic risk model, patients with HNSCC were divided into low- and high-risk groups. Survival analysis performed by Kaplan-Meier displayed significant prognostic differences between the two groups (P < 0.001, Supplementary Figure 3A). The relationship between the eight DEUPSGs and risk scores was shown in Supplementary Figure 3B. At the same time, similar results were found in the TCGA training set and TCGA all data set (Supplementary Figure 3C, 3D).
The GEO (GSE65858) database was used as an external data set for validating the classification performance of the risk model. Samples in the GSE65858 were segregated into low- and high-risk groups. The classification performance of the risk model and the expression pattern of the risk genes were consistent with the training set (Supplementary Figure 4).
Clinical independence of the risk model
To assess the independence of the risk model in clinical application, univariate and multivariate Cox regression analyses were subjected to clinical parameters from the TCGA training set, TCGA test set, GSE65858 database, and TCGA all data set. Univariate and multivariate Cox regression analyses suggested that the risk score had a significant association with prognosis in the TCGA training set (HR = 4.182, 95% CI = 2.540-6.887, P < 0.001; HR = 4.513, 95% CI = 2.732-7.375, P < 0.001, respectively, Figure 4A, 4B), the TCGA test set (HR = 1.993, 95% CI = 1.173-3.385, P < 0.05; HR = 1.954, 95% CI = 1.144-3.338, P < 0.05, respectively, Figure 4C, 4D), the TCGA all data set (HR = 2.947, 95% CI = 2.048-4.241, P < 0.01; HR = 2.961, 95% CI = 2.051-4.277, P < 0.01, respectively, (Supplementary Figure 5A, 5B), and the GEO data set (HR = 1.754, 95% CI = 0.917-3.352, P < 0.01; HR = 1.598, 95% CI = 0.814-3.135, P < 0.05, respectively, Supplementary Figure 5C, 5D). These data demonstrated that the risk model has an effectively prognostic power and exhibits an independent predictive value. A nomogram contained both risk score and clinical features was shown in Figure 4E.
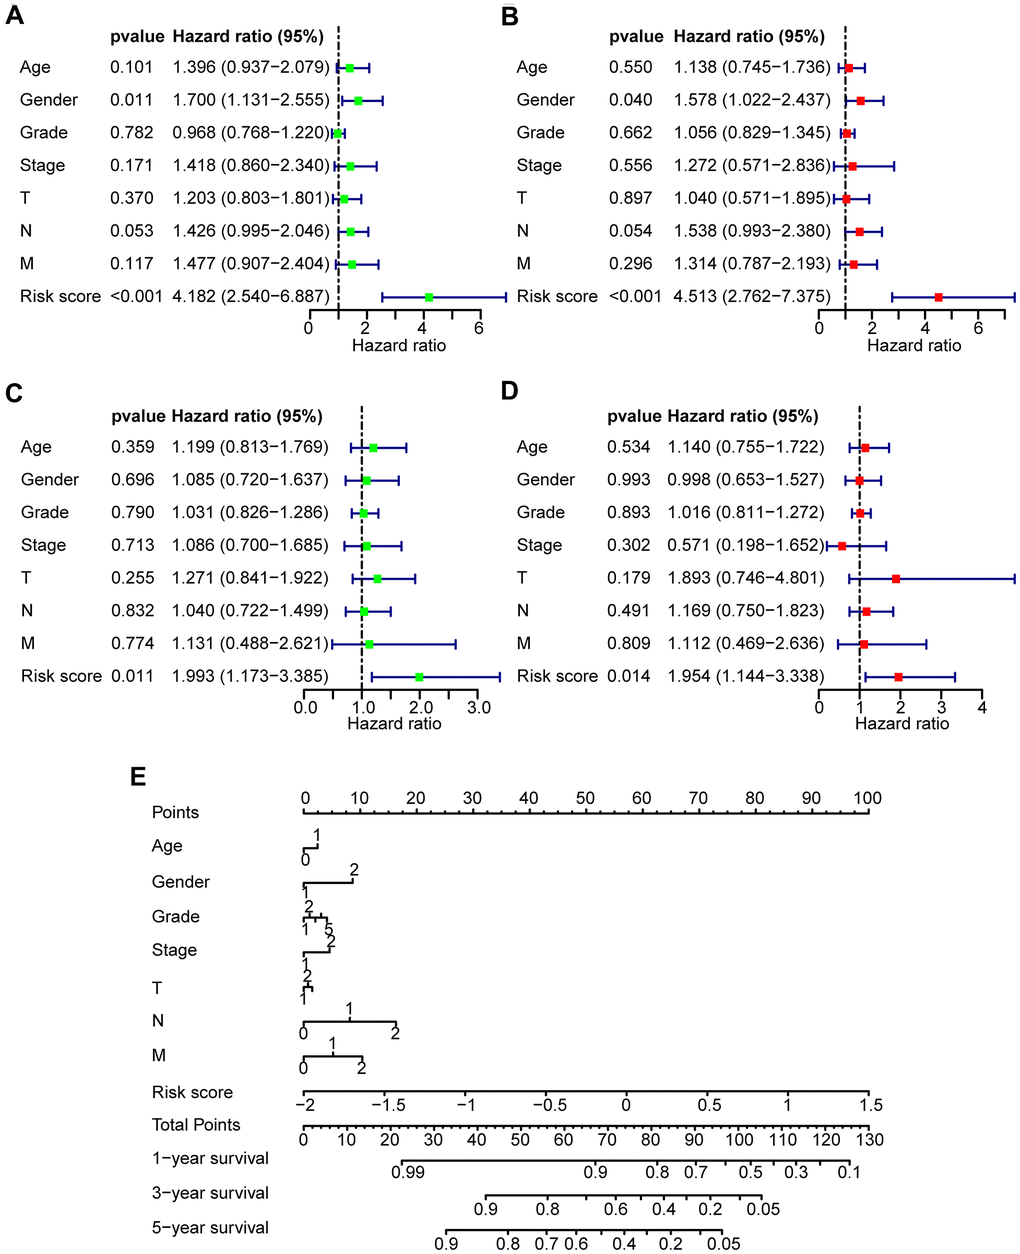
Figure 4. Prognostic predictive value of risk score in HNSCC patients. (A, B) Univariate and multivariate Cox regression analyses of the clinical factors of the patients in the TCGA training set, respectively. (C, D) Univariate and multivariate Cox regression analyses of the clinical factors of the patients in TCGA test set, respectively. (E) Nomogram for OS in HNSCC patients.
Gene set enrichment analysis in the high-risk and low-risk groups
Gene set enrichment analysis (GSEA) was employed for pathways identification in the TCGA database for detecting twenty pathways from the high- and low-risk groups (Supplementary Table 3). The selected signaling pathways showed significant differences between the two groups (FDR < 0.25, NOM p < 0.05) (Table 2), in which glycan metabolism, extracellular matrix, and proteolysis were significantly enriched in the high-risk group (Figure 5A, 5B). In contrast, DNA repair, fatty acid metabolism, other metabolisms, and immune-related pathways were significantly enriched in the low-risk group (Figure 5C–5E). Interestingly, the T cell receptor (TCR) signaling pathway was enriched in the low-risk group (Figure 5F), which may indicate a potential relationship of the high-risk core with impaired immunosurveillance and T cell antitumor response in HNSCC. The rest of GSEA graphs were shown in Supplementary Figure 6.
Table 2. Gene sets enriched in high-risk and low-risk groups.
| MSigDB collection | Name | NES | ES | NOM p-val | FDR q-val |
| c2.cp.kegg.v7.1.symbols.gmt | KEGG_GLYCOSAMINOGLYCAN_BIOSYNTHESIS_CHONDROITIN_SULFATE | 2.099 | 0.813 | 0.000 | 0.010 |
| KEGG_ECM_RECEPTOR_INTERACTION | 1.903 | 0.676 | 0.010 | 0.061 | |
| KEGG_GLYCOSPHINGOLIPID_BIOSYNTHESIS_GANGLIO_SERIES | 1.889 | 0.743 | 0.002 | 0.046 | |
| KEGG_OTHER_GLYCAN_DEGRADATION | 1.854 | 0.705 | 0.006 | 0.038 | |
| KEGG_FOCAL_ADHESION | 1.813 | 0.556 | 0.018 | 0.045 | |
| KEGG_GLYCOSAMINOGLYCAN_BIOSYNTHESIS_KERATAN_SULFATE | 1.801 | 0.683 | 0.004 | 0.045 | |
| KEGG_GLYCOSAMINOGLYCAN_DEGRADATION | 1.758 | 0.587 | 0.008 | 0.052 | |
| KEGG_LYSOSOME | 1.746 | 0.495 | 0.018 | 0.047 | |
| KEGG_GLYCOSAMINOGLYCAN_BIOSYNTHESIS_HEPARAN_SULFATE | 1.719 | 0.563 | 0.010 | 0.054 | |
| KEGG_PROTEASOME | 1.634 | 0.585 | 0.047 | 0.120 | |
| KEGG_DNA_REPLICATION | -1.971 | -0.810 | 0.000 | 0.143 | |
| KEGG_MISMATCH_REPAIR | -1.961 | -0.796 | 0.004 | 0.081 | |
| KEGG_T_CELL_RECEPTOR_SIGNALING_PATHWAY | -1.917 | -0.559 | 0.004 | 0.065 | |
| KEGG_PANTOTHENATE_AND_COA_BIOSYNTHESIS | -1.841 | -0.669 | 0.002 | 0.126 | |
| KEGG_HOMOLOGOUS_RECOMBINATION | -1.803 | -0.690 | 0.016 | 0.148 | |
| KEGG_CYSTEINE_AND_METHIONINE_METABOLISM | -1.792 | -0.552 | 0.012 | 0.137 | |
| KEGG_FC_EPSILON_RI_SIGNALING_PATHWAY | -1.773 | -0.488 | 0.008 | 0.141 | |
| KEGG_ALPHA_LINOLENIC_ACID_METABOLISM | -1.726 | -0.610 | 0.010 | 0.153 | |
| KEGG_LINOLEIC_ACID_METABOLISM | -1.712 | -0.565 | 0.018 | 0.155 | |
| KEGG_BASE_EXCISION_REPAIR | -1.676 | -0.620 | 0.045 | 0.152 | |
| KEGG_ARACHIDONIC_ACID_METABOLISM | -1.667 | -0.476 | 0.014 | 0.152 | |
| KEGG_FATTY_ACID_METABOLISM | -1.660 | -0.527 | 0.028 | 0.151 |
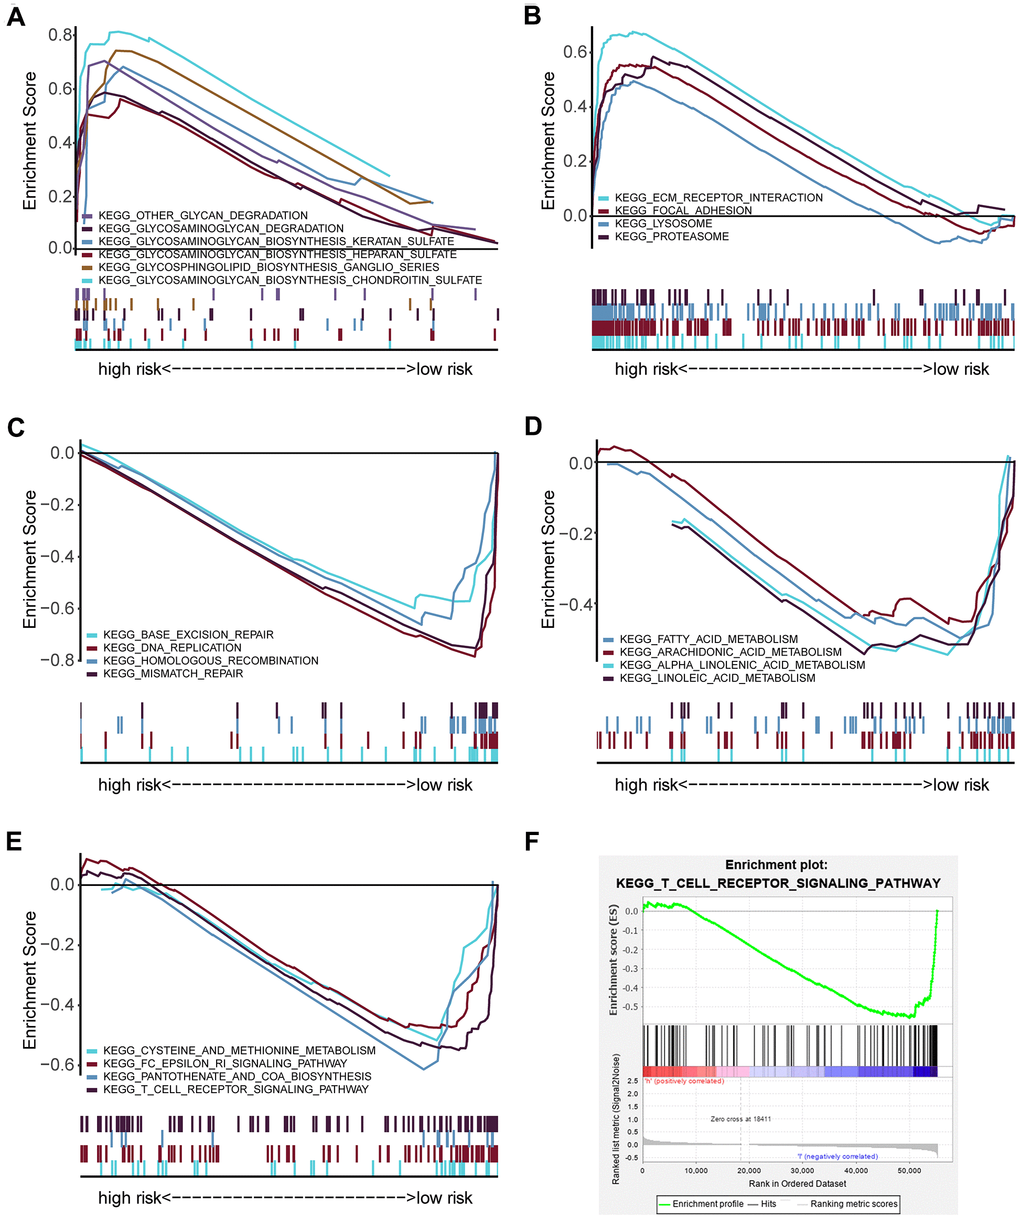
Figure 5. GSEA analysis showing the enriched pathways of the high- and low-risk groups. (A) Multiple GSEA showing glycan-related metabolism pathways in the high-risk group. (B) Multiple GSEA showing extracellular matrix and proteolysis related pathways in the high-risk group. (C) Multiple GSEA showing DNA repair in the low-risk group. (D) Multiple GSEA showing fatty acid metabolism pathways in the low-risk group. (E) Multiple GSEA showing other metabolism- and immune- related pathways in the low-risk group. (F) Single GSEA showing the T cell receptor signaling pathway.
Exploration of the relationship between the risk score and antitumor immunity
To determine whether the high-risk score was correlated with impaired T cell activity in HNSCC, we employed the ESTIMATE algorithm to estimate immune and stromal scores based on the TCGA database. The immune score was higher in the low-risk group than the high-risk group (P < 0.001, Figure 6A), and the risk score had a negative correlation with the immune score in HNSCC patients (R = -0.19, P < 0.0001, Figure 6B). However, the stromal score was higher in the high-risk group than the low-risk group (P < 0.01, Figure 6C), and the risk score had a positive correlation with the stromal score in HNSCC samples (R = 0.17, P < 0.001, Figure 6D).
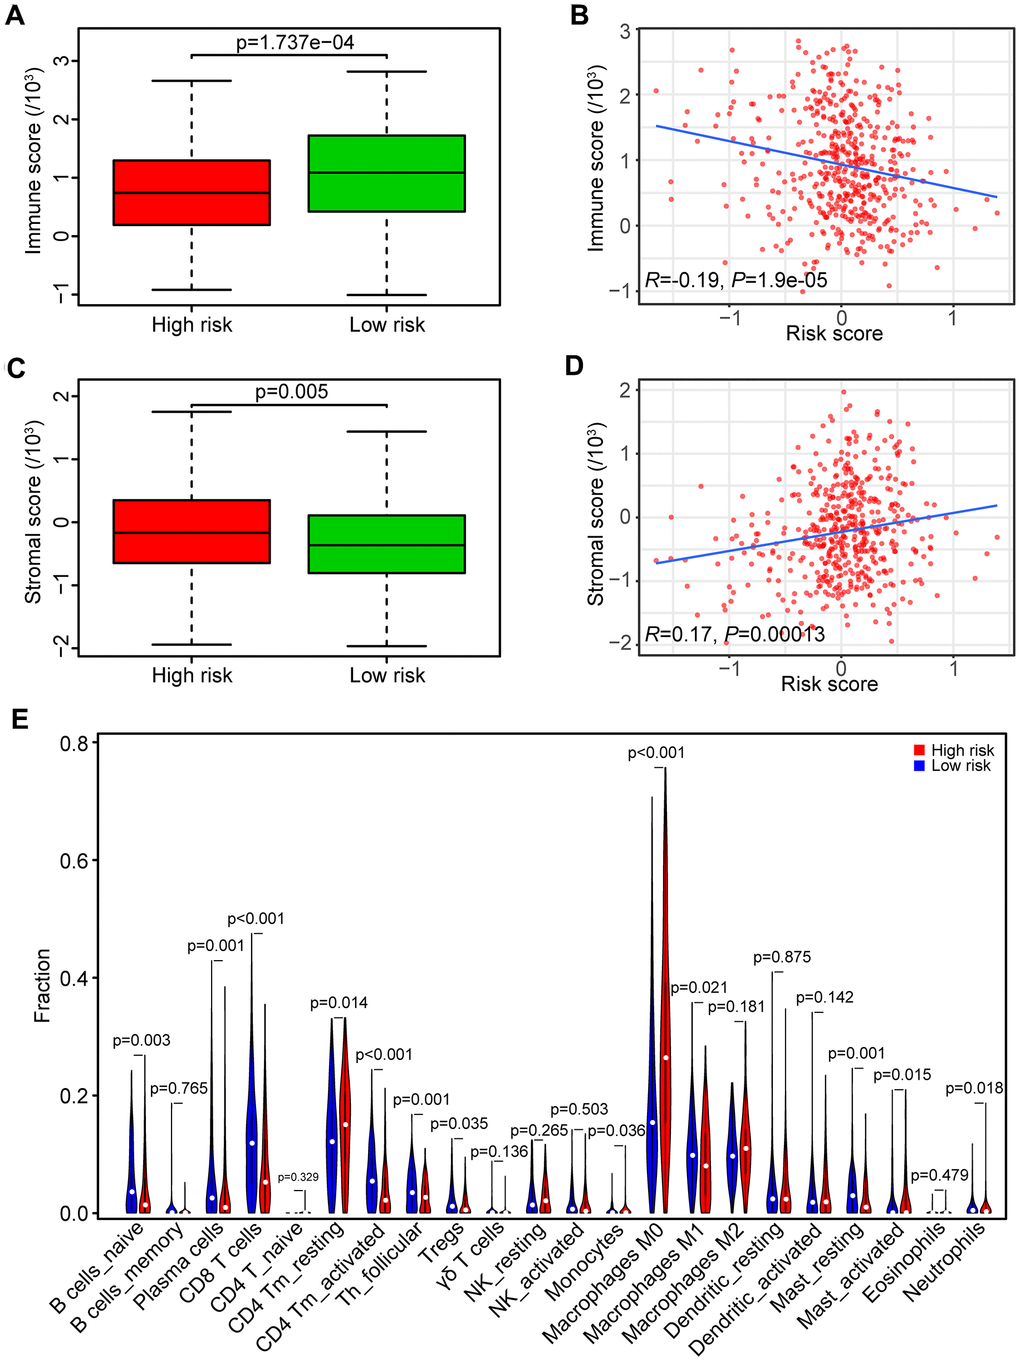
Figure 6. Association between risk score and tumor immunity. (A) Distribution of immune scores in high- and low-risk HNSCC patients. (B) Association between the risk score and immune score in HNSCC samples. (C) Distribution of stromal scores in high- and low-risk HNSCC patients. (D) Association between the risk score and stromal score in HNSCC samples. (E) Comparison of immune cell fractions between the high-risk and low-risk HNSCC patients.
We subsequently analyzed the fraction of both tumor-infiltrated innate and adaptive immune cells in HNSCC samples by CIBERSORT. The relationships of risk score with those immune cells were shown in Figure 6E. The results showed that the fraction of CD8 T cells (P < 0.001), CD4 memory activated T cells (P < 0.001), and follicular helper T cells (P < 0.01) in samples from the high-risk group were lower than the low-risk group, indicating that high-risk score was associated with immunosuppressive phenotypes that may result from impaired T cell response and activation.
Correlation between the genes of the risk model and the four T cell subpopulations
According to the potential relationship between the risk model and the four T cell subpopulations (Figure 7A), we further tested the correlation between the eight genes and the four T cell subpopulations (Figure 7B–7I). Consistent with the profile of these genes in the risk model, decreased CD8 T cells were associated with the upregulated OSTM1 (P < 0.01), PCGF2 (P < 0.05), PSMD2 (P < 0.01), UCHL1 (P < 0.05) and the downregulated SOCS1 (P < 0.01). Additionally, decreased CD4 memory-activated T cells were related to the upregulated UCHL1 (P < 0.01) and the downregulated SOCS1 (P < 0.01). Similarly, the asthenia of follicular helper T cells may be caused by high expressed OSTM1 (P < 0.05), PSMD2 (P < 0.001) and low expressed USP54 (P < 0.001). Moreover, the increase of CD4 memory resting T cells was associated with the high expressed OSTM1 (P < 0.01). Thus, the UPS-related genes OSTM1, PCGF2, PSMD2, UCHL1, SOCS1, and USP54 were associated with immunosuppression in HNSCC.
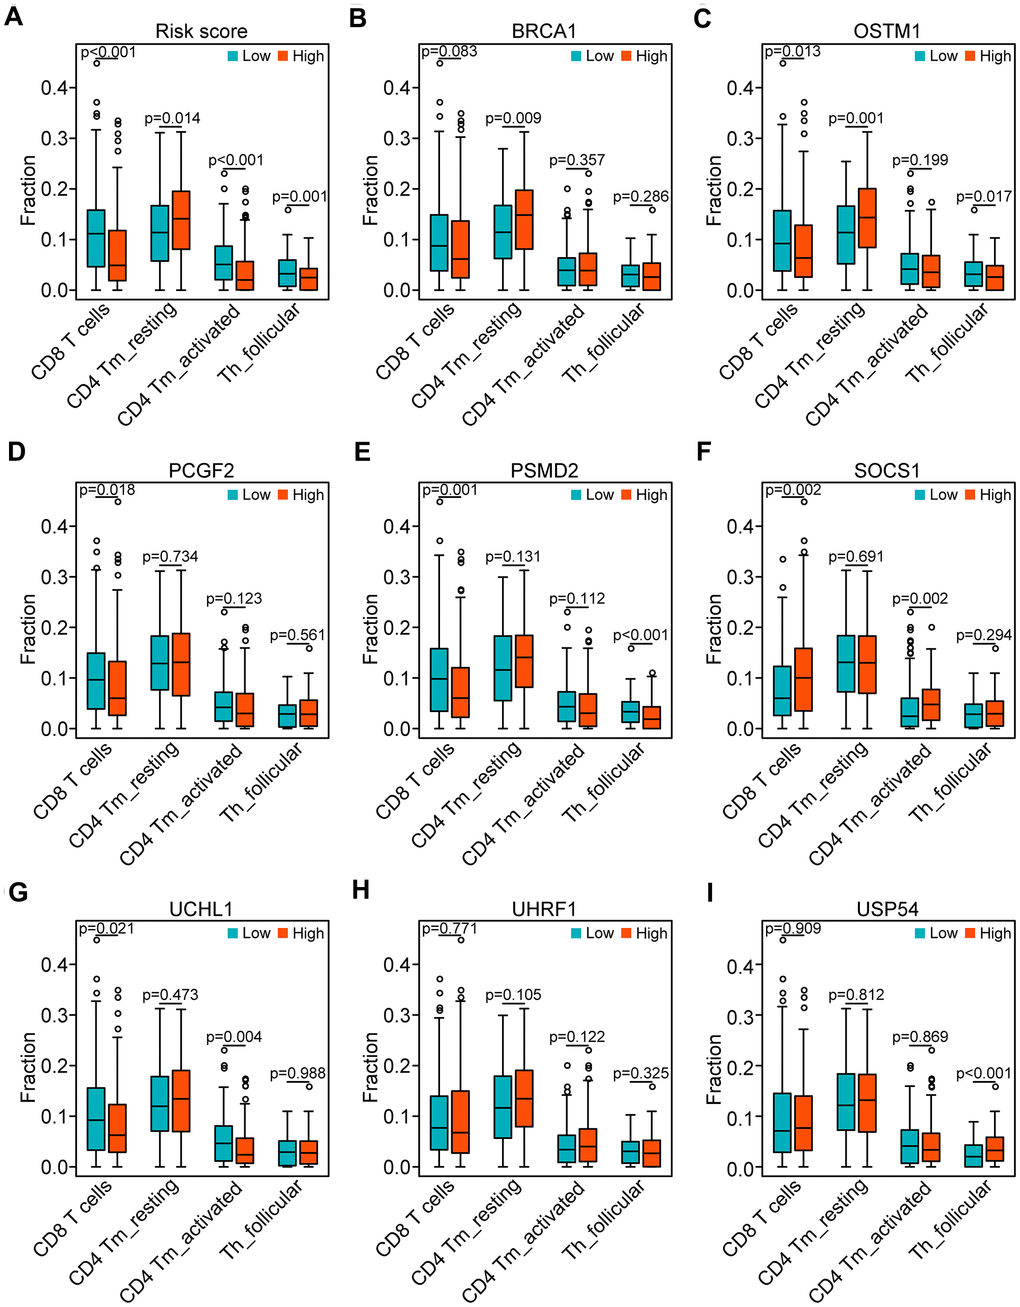
Figure 7. Correlation of the genes of the risk model with the four subpopulations of T cells. (A) Comparison of the four subpopulations of T cells (CD8 T cells, CD4 memory activated T cells, and follicular helper T cells) between the high- and low-risk groups. (B–I) Distribution of the four T cell subpopulations based on the high and low expression of BRCA1, OSTM1, PCGF2, PSMD2, SOCS1, UCHL1, UHRF1, and USP54, respectively.
Discussion
Tumor cells that escape from immunosurveillance and attack have been the characteristics of immunosuppression in the tumor progression, which is largely associated with the impaired or dysregulated host immune system [27]. By managing protein degradation and abundance, the UPS pathway has been reported as an essential regulator in immunosurveillance of the tumor microenvironment [28]. Accumulating evidence has demonstrated that E3 dysfunction perturbs antitumor immune responses [29–31]. Current knowledge on the functions of the UPS pathway in the development of HNSCC remains obscure. In this regard, an improved understanding of the UPSGs functions in the text of HNSCC can provide a therapeutic value.
This study analytically conferred prognostic evidence by identification of 114 DEUPSGs and establishment of the eight prognosis-related DEUPSGs. A prognosis risk model was established based on the eight DEUPSGs. Previous studies have reported the abnormal expression of UPSGs in renal cancer and breast cancer [32, 33]. Analyses performed at both mRNA and protein levels can improve the reliability of the results, whereas the limited sample size of these analyses may lead to a bias in the results, because only abnormal gene expression is analyzed, and verification of clinical significance or potential functional analysis is lacking.
In this risk model, high expression levels of PSMD2, OSTM1, PCGF2, and UCHL1 were risk factors, while high expression levels of BRCA1, SOCS1, UHRF1, and USP54 acted as protective factors. Overexpression of PSMD2 has been previously shown to be involved in the development of lung adenocarcinoma, breast cancer, and hepatocellular carcinoma [24–26]. UCHL1 has been reported a potential oncoprotein in colorectal cancer, breast cancer, and uterine serous cancer. It promotes proliferation and metastasis of cancer cells and leads to a radioresistant phenotype via regulation of β-catenin/TCF and HIF-1α pathway [34–38]. In line with those previous studies, our results also suggested that PSMD2 and UCHL1 may have therapeutic potential as targets against cancer. Accumulating evidence has shown that BRCA1 mutation is a crucial risk factor in multiple cancers, including breast cancer, skin cancer, ovarian cancer, and colorectal cancer [39–43]. SOCS1 acts as an antioncogene in various tumors, arresting the cell cycle, inhibiting cancer cell migration and invasion, and attenuating tumor growth [44–47]. Nevertheless, non-coding RNA (ncRNA) regulating SOCS1 promotes the occurrence and development of cancers [48–50]. Similarly, UHRF1 also acts as an antioncogene in multiple cancers and inhibits tumor development and progression [51–54]. Therefore, the abovementioned studies suggest that BRCA1, SOCS1, and UHRF1 serve as antioncogenes, consistent with our results.
Interestingly, our GSEA results showed that the TCR signaling pathway was highly enriched in the low-risk group, which suggested the impaired T cell activation presented in the high-risk group. TCR engagement initiates a central signaling pathway that is crucial for T cell proliferation, survival, and differentiation into killer cells for adaptive immunity. Abnormalities of TCR signaling could result in immunodeficiency [55–58]. Consequently, according to the relationship between the risk score and the distribution of T cell subpopulations, we found that the high-risk score has a decreased immune score, which may suggest that the high-risk score is critical for evaluating whether tumor-infiltrated T cells have an immunosuppressive status and dysregulated antitumor response. Moreover, the high expression of OSTM1, PCGF2, PSMD2 combined with the low expression of UCHL1, SOCS1, and USP54 were engaged in the suppression of T cell proliferation and activation in the HNSCC microenvironment. It has been previously shown that differential expression of UCHL1 was majorly involved in the proliferation and differentiation of T cells, including CD8 memory CTLp, circulating TCR-gamma/delta+ lymphocytes, and mature T cells [59]. SOCS1 has been identified as an inhibitor against cytokine release and a growth factor receptor, it plays a crucial role in regulating T cell homeostasis, development, and homeostasis activation [60–64]. However, the function of OSTM1, PCGF2, PSMD2, and USP54 have not been investigated in the antitumoral immune response. The present studies suggest that the high expression of OSTM1, PCGF2, and PSMD2 and low expression of UCHL1 were associated with immunosuppressive phenotypes.
Generally, we identified an eight -UPSGs based risk model according to the TCGA-HNSCC database and analyzed its biological functions, demonstrating that the risk score obtained from this model was significantly correlated with immunosuppressive status. However, some limitations in the context of the study should be acknowledged. First, this study is performed by bioinformatics analysis alone, the predictive results could be insufficient. Second, this is a retrospective study rather than a prospective one, further validations with large clinical cohort and actual experiments are needed.
Conclusions
In summary, we present a risk model constructed by DEUPSGs that can be considered as potential prognostic biomarkers and associated with an immunosuppressive status and impaired antitumor response of T cells in the HNSCC microenvironment. This systematic analysis on the interaction of UPSGs based risk model and immune profile provides a novel understanding of the precise immunotherapy for HNSCC patients.
Materials and Methods
Data downloading and processing
The most recent transcriptional data and clinical features on 500 HNSCC samples and 44 adjacent samples were obtained from the TCGA database (https://portal.gdc.cancer.gov/) and the cBio Cancer Genomics portal (https://www.cbioportal.org/) (Table 3). We chose 498 HNSCC samples with follow-up data and randomly divided them into two groups: a training set (n=298) and a test set (n=298), as shown in Supplementary Tables 4, 5. In addition, we obtained the GSE65858 data setwith 270 HNSCC samples as an external set from the Gene Expression Omnibus (GEO) database (https://www.ncbi.nlm.nih.gov/geo/).
Table 3. Clinical characteristics of HNSCC patients in the TCGA and GEO databases.
| Clinical characteristics | TCGA | GEO (GSE65858) | |||
| n=500 | % | n=270 | % | ||
| Age | |||||
| < 60 | 220 | 44.0 | 153 | 56.7 | |
| ≥ 60 | 280 | 56.0 | 117 | 43.3 | |
| Gender | |||||
| Female | 133 | 26.6 | 47 | 17.4 | |
| Male | 367 | 73.4 | 223 | 82.6 | |
| Histologic grade | |||||
| G1 | 61 | 12.2 | |||
| G2 | 299 | 59.8 | |||
| G3 | 119 | 23.8 | |||
| G4 | 2 | 0.4 | |||
| Gx | 16 | 3.2 | |||
| NA | 3 | 0.6 | |||
| Stage | |||||
| I | 19 | 3.8 | 18 | 6.7 | |
| II | 95 | 19.0 | 37 | 13.7 | |
| III | 102 | 20.4 | 37 | 13.7 | |
| IV | 270 | 54.0 | 178 | 65.9 | |
| NA | 14 | 2.8 | |||
| T classification | |||||
| T1 | 33 | 6.6 | 35 | 13 | |
| T2 | 143 | 28.6 | 80 | 29.6 | |
| T3 | 130 | 26.0 | 58 | 21.5 | |
| T4 | 179 | 35.8 | 97 | 35.9 | |
| Tx | 11 | 2.2 | |||
| NA | 4 | 0.8 | |||
| N classification | |||||
| N0 | 239 | 47.8 | 94 | 34.8 | |
| N+ | 239 | 47.8 | 176 | 65.2 | |
| Nx | 18 | 3.6 | |||
| NA | 4 | 0.8 | |||
| M classification | |||||
| M0 | 470 | 94.0 | 263 | 97.4 | |
| M1 | 5 | 1.0 | 7 | 2.6 | |
| Mx | 20 | 4.0 | |||
| NA | 5 | 1.0 | |||
| Vital status | |||||
| Deceased | 218 | 43.6 | 94 | 34.8 | |
| Living | 282 | 56.4 | 176 | 65.2 | |
Identification of differentially expressed genes
The differentially expressed UPS-related genes (DEUPSGs) between head and neck tumor tissues and adjacent tissues were screened out through the Wilcoxon signed-rank test using the limma R package, according to the following cut-off values: FDR < 0.05 and |Fold change| > 1.5. Subsequently, a heat map was generated using the “pheatmap” package, and volcano dot plots were created to present the DEUPSGs. We used the OmicCircos R package to show the distribution of the DEUPSGs [65].
Functional enrichment analyses
The enrichplot R package was built for the GO and KEGG pathway enrichment analyses to identify the functions of the abovementioned DEUPSGs [66], containing BP, CC, and MF terms and pathways. Statistical significance was defined as both P-value and FDR < 0.05.
Prognostic risk model establishment
We used univariate Cox regression analysis to screen out DEUPSGs significantly associated with OS. P < 0.05 was chosen as the threshold. We further used Lasso regression analysis to establish a multi-gene prognostic model. The risk score of each patient was calculated, employing the regression coefficient of each selected gene based on the following equation:
where n is the number of prognostic genes, genei is the ith prognostic gene, Coef is the regression coefficient of genes, and Expi is the expression value of the prognostic genes. Then, the HNSCC patients were divided into high-risk and low-risk groups according to the median risk score. Moreover, we used rms package to generate a nomogram.
Gene set enrichment analysis
Gene set enrichment analysis (GSEA, https://www.gsea-msigdb.org/) is a powerful computational tool used to determine statistical differences of specific functional gene sets between two biological states [67]. Here, we performed the GSEA analysis using GSEA v4.0.3 to obtain the differentially expressed genes from the high- and low-risk groups. After 1000 repeats for each analysis, gene sets with p-value < 0.05 and FDR < 0.25 were identified as enriched sets.
Identification of immune scores and tumor-infiltrating immune cells
To identify infiltrated immune cell numbers and stromal cell numbers, the R software package “ESTIMATE algorithm” was used for calculating immune and stromal scores of HNSCC samples in the TCGA database [68]. Additionally, CIBERSORT was applied to acquire the composition of the infiltrated immune cells in HNSCC samples [69].
Statistical analysis
R package (v4.0.1) was subjected to all analyses. Kaplan-Meier curve was drawn with the log-rank test. Univariate and multivariate Cox regression was used to determine the independence of gene markers. Spearman’s rank correlation test was utilized to identify the variables. Differences in the distributions of the variables were analyzed by the Chi-square test or Fisher’s exact test. P < 0.05 was considered statistically significant.
Data availability statement
Expression profiles of data sets in this study were downloaded from The Cancer Genome Atlas (TCGA) (https://portal.gdc.cancer.gov/) and Gene Expression Omnibus (GEO) database (https://www.ncbi.nlm.nih.gov/geo/).
Supplementary Materials
Author Contributions
YT and XZ designed this project and approved the manuscript. JW and ZL contributed to the data analysis and carried out the manuscript. JL, LZ, YQ, FZ, RH, HC and YT co-contributed to revising and polishing the manuscript and figures. All authors have read and approved the final submitted manuscript.
Conflicts of Interest
The authors declare that they have no conflicts of interest.
Funding
This work was supported by grants from the Hunan provincial Health and Family Planning Commission (20201947, B20180186) and the Hunan Provincial Natural Science Foundation of China (2019JJ50547).
References
- 1. Siegel RL, Miller KD, Jemal A. Cancer statistics. CA Cancer J Clin. 2020; 70:7–30. https://doi.org/10.3322/caac.21590
- 2. Shield KD, Ferlay J, Jemal A, Sankaranarayanan R, Chaturvedi AK, Bray F, Soerjomataram I. The global incidence of lip, oral cavity, and pharyngeal cancers by subsite in 2012. CA Cancer J Clin. 2017; 67:51–64. https://doi.org/10.3322/caac.21384 [PubMed]
- 3. Bray F, Ferlay J, Soerjomataram I, Siegel RL, Torre LA, Jemal A. Global cancer statistics 2018: GLOBOCAN estimates of incidence and mortality worldwide for 36 cancers in 185 countries. CA Cancer J Clin. 2018; 68:394–424. https://doi.org/10.3322/caac.21492 [PubMed]
- 4. Cramer JD, Burtness B, Le QT, Ferris RL. The changing therapeutic landscape of head and neck cancer. Nat Rev Clin Oncol. 2019; 16:669–83. https://doi.org/10.1038/s41571-019-0227-z [PubMed]
- 5. Deng X, Jiang Q, Liu Z, Chen W. Clinical Significance of an m6A Reader Gene, IGF2BP2, in Head and Neck Squamous Cell Carcinoma. Front Mol Biosci. 2020; 7:68. https://doi.org/10.3389/fmolb.2020.00068 [PubMed]
- 6. Pohl C, Dikic I. Cellular quality control by the ubiquitin-proteasome system and autophagy. Science. 2019; 366:818–22. https://doi.org/10.1126/science.aax3769 [PubMed]
- 7. Collins GA, Goldberg AL. The Logic of the 26S Proteasome. Cell. 2017; 169:792–806. https://doi.org/10.1016/j.cell.2017.04.023 [PubMed]
- 8. Chowdhury M, Enenkel C. Intracellular Dynamics of the Ubiquitin-Proteasome-System. F1000Res. 2015; 4:367. https://doi.org/10.12688/f1000research.6835.2 [PubMed]
- 9. Swatek KN, Komander D. Ubiquitin modifications. Cell Res. 2016; 26:399–422. https://doi.org/10.1038/cr.2016.39 [PubMed]
- 10. Luza S, Opazo CM, Bousman CA, Pantelis C, Bush AI, Everall IP. The ubiquitin proteasome system and schizophrenia. Lancet Psychiatry. 2020; 7:528–37. https://doi.org/10.1016/S2215-0366(19)30520-6 [PubMed]
- 11. Wang J, Maldonado MA. The ubiquitin-proteasome system and its role in inflammatory and autoimmune diseases. Cell Mol Immunol. 2006; 3:255–61. [PubMed]
- 12. He M, Zhou Z, Wu G, Chen Q, Wan Y. Emerging role of DUBs in tumor metastasis and apoptosis: Therapeutic implication. Pharmacol Ther. 2017; 177:96–107. https://doi.org/10.1016/j.pharmthera.2017.03.001 [PubMed]
- 13. Meyer-Schwesinger C. The ubiquitin-proteasome system in kidney physiology and disease. Nat Rev Nephrol. 2019; 15:393–411. https://doi.org/10.1038/s41581-019-0148-1 [PubMed]
- 14. Morozov AV, Karpov VL. Proteasomes and Several Aspects of Their Heterogeneity Relevant to Cancer. Front Oncol. 2019; 9:761. https://doi.org/10.3389/fonc.2019.00761 [PubMed]
- 15. Schulman BA, Harper JW. Ubiquitin-like protein activation by E1 enzymes: the apex for downstream signalling pathways. Nat Rev Mol Cell Biol. 2009; 10:319–31. https://doi.org/10.1038/nrm2673 [PubMed]
- 16. Stewart MD, Ritterhoff T, Klevit RE, Brzovic PS. E2 enzymes: more than just middle men. Cell Res. 2016; 26:423–40. https://doi.org/10.1038/cr.2016.35 [PubMed]
- 17. Buetow L, Huang DT. Structural insights into the catalysis and regulation of E3 ubiquitin ligases. Nat Rev Mol Cell Biol. 2016; 17:626–42. https://doi.org/10.1038/nrm.2016.91 [PubMed]
- 18. Reyes-Turcu FE, Wilkinson KD. Polyubiquitin binding and disassembly by deubiquitinating enzymes. Chem Rev. 2009; 109:1495–508. https://doi.org/10.1021/cr800470j [PubMed]
- 19. Voutsadakis IA. Ubiquitination and the ubiquitin - proteasome system in the pathogenesis and treatment of squamous head and neck carcinoma. Anticancer Res. 2013; 33:3527–41. [PubMed]
- 20. Liu Y, Zhao R, Chi S, Zhang W, Xiao C, Zhou X, Zhao Y, Wang H. UBE2C Is Upregulated by Estrogen and Promotes Epithelial-Mesenchymal Transition via p53 in Endometrial Cancer. Mol Cancer Res. 2020; 18:204–15. https://doi.org/10.1158/1541-7786.MCR-19-0561 [PubMed]
- 21. Jin D, Guo J, Wu Y, Du J, Wang X, An J, Hu B, Kong L, Di W, Wang W. UBE2C, Directly Targeted by miR-548e-5p, Increases the Cellular Growth and Invasive Abilities of Cancer Cells Interacting with the EMT Marker Protein Zinc Finger E-box Binding Homeobox 1/2 in NSCLC. Theranostics. 2019; 9:2036–55. https://doi.org/10.7150/thno.32738 [PubMed]
- 22. Kim YJ, Lee G, Han J, Song K, Choi JS, Choi YL, Shin YK. UBE2C Overexpression Aggravates Patient Outcome by Promoting Estrogen-Dependent/Independent Cell Proliferation in Early Hormone Receptor-Positive and HER2-Negative Breast Cancer. Front Oncol. 2020; 9:1574. https://doi.org/10.3389/fonc.2019.01574 [PubMed]
- 23. Guo J, Jin D, Wu Y, Yang L, Du J, Gong K, Chen W, Dai J, Miao S, Xi S. The miR 495-UBE2C-ABCG2/ERCC1 axis reverses cisplatin resistance by downregulating drug resistance genes in cisplatin-resistant non-small cell lung cancer cells. EBioMedicine. 2018; 35:204–21. https://doi.org/10.1016/j.ebiom.2018.08.001 [PubMed]
- 24. Matsuyama Y, Suzuki M, Arima C, Huang QM, Tomida S, Takeuchi T, Sugiyama R, Itoh Y, Yatabe Y, Goto H, Takahashi T. Proteasomal non-catalytic subunit PSMD2 as a potential therapeutic target in association with various clinicopathologic features in lung adenocarcinomas. Mol Carcinog. 2011; 50:301–09. https://doi.org/10.1002/mc.20632 [PubMed]
- 25. Li Y, Huang J, Zeng B, Yang D, Sun J, Yin X, Lu M, Qiu Z, Peng W, Xiang T, Li H, Ren G. PSMD2 regulates breast cancer cell proliferation and cell cycle progression by modulating p21 and p27 proteasomal degradation. Cancer Lett. 2018; 430:109–22. https://doi.org/10.1016/j.canlet.2018.05.018 [PubMed]
- 26. Tan Y, Jin Y, Wu X, Ren Z. PSMD1 and PSMD2 regulate HepG2 cell proliferation and apoptosis via modulating cellular lipid droplet metabolism. BMC Mol Biol. 2019; 20:24. https://doi.org/10.1186/s12867-019-0141-z [PubMed]
- 27. Hanahan D, Weinberg RA. Hallmarks of cancer: the next generation. Cell. 2011; 144:646–74. https://doi.org/10.1016/j.cell.2011.02.013 [PubMed]
- 28. Goldberg AL. Functions of the proteasome: from protein degradation and immune surveillance to cancer therapy. Biochem Soc Trans. 2007; 35:12–17. https://doi.org/10.1042/BST0350012 [PubMed]
- 29. Song M, Wang C, Wang H, Zhang T, Li J, Benezra R, Chouchane L, Sun YH, Cui XG, Ma X. Targeting ubiquitin protein ligase E3 component N-recognin 5 in cancer cells induces a CD8+ T cell mediated immune response. Oncoimmunology. 2020; 9:1746148. https://doi.org/10.1080/2162402X.2020.1746148 [PubMed]
- 30. Spinner CA, Lamsoul I, Métais A, Febrissy C, Moog-Lutz C, Lutz PG. The E3 Ubiquitin Ligase Asb2α in T Helper 2 Cells Negatively Regulates Antitumor Immunity in Colorectal Cancer. Cancer Immunol Res. 2019; 7:1332–44. https://doi.org/10.1158/2326-6066.CIR-18-0562 [PubMed]
- 31. Nurieva R, Wang J, Sahoo A. T-cell tolerance in cancer. Immunotherapy. 2013; 5:513–31. https://doi.org/10.2217/imt.13.33 [PubMed]
- 32. Kanayama H, Tanaka K, Aki M, Kagawa S, Miyaji H, Satoh M, Okada F, Sato S, Shimbara N, Ichihara A. Changes in expressions of proteasome and ubiquitin genes in human renal cancer cells. Cancer Res. 1991; 51:6677–85. [PubMed]
- 33. Deng S, Zhou H, Xiong R, Lu Y, Yan D, Xing T, Dong L, Tang E, Yang H. Over-expression of genes and proteins of ubiquitin specific peptidases (USPs) and proteasome subunits (PSs) in breast cancer tissue observed by the methods of RFDD-PCR and proteomics. Breast Cancer Res Treat. 2007; 104:21–30. https://doi.org/10.1007/s10549-006-9393-7 [PubMed]
- 34. Zhong J, Zhao M, Ma Y, Luo Q, Liu J, Wang J, Yuan X, Sang J, Huang C. UCHL1 acts as a colorectal cancer oncogene via activation of the β-catenin/TCF pathway through its deubiquitinating activity. Int J Mol Med. 2012; 30:430–36. https://doi.org/10.3892/ijmm.2012.1012 [PubMed]
- 35. Liu S, González-Prieto R, Zhang M, Geurink PP, Kooij R, Iyengar PV, van Dinther M, Bos E, Zhang X, Le Dévédec SE, van de Water B, Koning RI, Zhu HJ, et al. Deubiquitinase Activity Profiling Identifies UCHL1 as a Candidate Oncoprotein That Promotes TGFβ-Induced Breast Cancer Metastasis. Clin Cancer Res. 2020; 26:1460–73. https://doi.org/10.1158/1078-0432.CCR-19-1373 [PubMed]
- 36. Goto Y, Zeng L, Yeom CJ, Zhu Y, Morinibu A, Shinomiya K, Kobayashi M, Hirota K, Itasaka S, Yoshimura M, Tanimoto K, Torii M, Sowa T, et al. UCHL1 provides diagnostic and antimetastatic strategies due to its deubiquitinating effect on HIF-1α. Nat Commun. 2015; 6:6153. https://doi.org/10.1038/ncomms7153 [PubMed]
- 37. Kwan SY, Au-Yeung CL, Yeung TL, Rynne-Vidal A, Wong KK, Risinger JI, Lin HK, Schmandt RE, Yates MS, Mok SC, Lu KH. Ubiquitin Carboxyl-Terminal Hydrolase L1 (UCHL1) Promotes Uterine Serous Cancer Cell Proliferation and Cell Cycle Progression. Cancers (Basel). 2020; 12:118. https://doi.org/10.3390/cancers12010118 [PubMed]
- 38. Nakashima R, Goto Y, Koyasu S, Kobayashi M, Morinibu A, Yoshimura M, Hiraoka M, Hammond EM, Harada H. UCHL1-HIF-1 axis-mediated antioxidant property of cancer cells as a therapeutic target for radiosensitization. Sci Rep. 2017; 7:6879. https://doi.org/10.1038/s41598-017-06605-1 [PubMed]
- 39. Vos JR, Hsu L, Brohet RM, Mourits MJ, de Vries J, Malone KE, Oosterwijk JC, de Bock GH. Bias Correction Methods Explain Much of the Variation Seen in Breast Cancer Risks of BRCA1/2 Mutation Carriers. J Clin Oncol. 2015; 33:2553–62. https://doi.org/10.1200/JCO.2014.59.0463 [PubMed]
- 40. Milne RL, Antoniou AC. Modifiers of breast and ovarian cancer risks for BRCA1 and BRCA2 mutation carriers. Endocr Relat Cancer. 2016; 23:T69–84. https://doi.org/10.1530/ERC-16-0277 [PubMed]
- 41. Warner E. Screening BRCA1 and BRCA2 Mutation Carriers for Breast Cancer. Cancers (Basel). 2018; 10:477. https://doi.org/10.3390/cancers10120477 [PubMed]
- 42. Gumaste PV, Penn LA, Cymerman RM, Kirchhoff T, Polsky D, McLellan B. Skin cancer risk in BRCA1/2 mutation carriers. Br J Dermatol. 2015; 172:1498–506. https://doi.org/10.1111/bjd.13626 [PubMed]
- 43. Cullinane CM, Creavin B, O’Connell EP, Kelly L, O’Sullivan MJ, Corrigan MA, Redmond HP. Risk of colorectal cancer associated with BRCA1 and/or BRCA2 mutation carriers: systematic review and meta-analysis. Br J Surg. 2020; 107:951–59. https://doi.org/10.1002/bjs.11603 [PubMed]
- 44. Zhang X, Wang J, Cheng J, Ding S, Li M, Sun S, Zhang L, Liu S, Chen X, Zhuang H, Lu F. An integrated analysis of SOCS1 down-regulation in HBV infection-related hepatocellular carcinoma. J Viral Hepat. 2014; 21:264–71. https://doi.org/10.1111/jvh.12137 [PubMed]
- 45. Natatsuka R, Takahashi T, Serada S, Fujimoto M, Ookawara T, Nishida T, Hara H, Nishigaki T, Harada E, Murakami T, Miyazaki Y, Makino T, Kurokawa Y, et al. Gene therapy with SOCS1 for gastric cancer induces G2/M arrest and has an antitumour effect on peritoneal carcinomatosis. Br J Cancer. 2015; 113:433–42. https://doi.org/10.1038/bjc.2015.229 [PubMed]
- 46. Villalobos-Hernandez A, Bobbala D, Kandhi R, Khan MG, Mayhue M, Dubois CM, Ferbeyre G, Saucier C, Ramanathan S, Ilangumaran S. SOCS1 inhibits migration and invasion of prostate cancer cells, attenuates tumor growth and modulates the tumor stroma. Prostate Cancer Prostatic Dis. 2017; 20:36–47. https://doi.org/10.1038/pcan.2016.50 [PubMed]
- 47. Ding J, Xu K, Sun S, Qian C, Yin S, Xie H, Zhou L, Zheng S, Zhang W. SOCS1 blocks G1-S transition in hepatocellular carcinoma by reducing the stability of the CyclinD1/CDK4 complex in the nucleus. Aging (Albany NY). 2020; 12:3962–75. https://doi.org/10.18632/aging.102865 [PubMed]
- 48. Shao N, Ma G, Zhang J, Zhu W. miR-221-5p enhances cell proliferation and metastasis through post-transcriptional regulation of SOCS1 in human prostate cancer. BMC Urol. 2018; 18:14. https://doi.org/10.1186/s12894-018-0325-8 [PubMed]
- 49. Liu X, Wang J, Zhang G. miR-4458 regulates cell proliferation and apoptosis through targeting SOCS1 in triple-negative breast cancer. J Cell Biochem. 2019; 120:12943–48. https://doi.org/10.1002/jcb.28565 [PubMed]
- 50. Sun K, Zhang G. Long noncoding RNA CASC2 suppresses esophageal squamous cell carcinoma progression by increasing SOCS1 expression. Cell Biosci. 2019; 9:90. https://doi.org/10.1186/s13578-019-0353-4 [PubMed]
- 51. Qin Y, Wang J, Gong W, Zhang M, Tang Z, Zhang J, Quan Z. UHRF1 depletion suppresses growth of gallbladder cancer cells through induction of apoptosis and cell cycle arrest. Oncol Rep. 2014; 31:2635–43. https://doi.org/10.3892/or.2014.3145 [PubMed]
- 52. Jung YD, Shim JW, Park SJ, Choi SH, Yang K, Heo K, Park MT. Downregulation of UHRF1 promotes EMT via inducing CXCR4 in human cancer cells. Int J Oncol. 2015; 46:1232–42. https://doi.org/10.3892/ijo.2014.2813 [PubMed]
- 53. Wu SM, Cheng WL, Liao CJ, Chi HC, Lin YH, Tseng YH, Tsai CY, Chen CY, Lin SL, Chen WJ, Yeh YH, Huang CY, Chen MH, et al. Negative modulation of the epigenetic regulator, UHRF1, by thyroid hormone receptors suppresses liver cancer cell growth. Int J Cancer. 2015; 137:37–49. https://doi.org/10.1002/ijc.29368 [PubMed]
- 54. Ge TT, Yang M, Chen Z, Lou G, Gu T. UHRF1 gene silencing inhibits cell proliferation and promotes cell apoptosis in human cervical squamous cell carcinoma CaSki cells. J Ovarian Res. 2016; 9:42. https://doi.org/10.1186/s13048-016-0253-8 [PubMed]
- 55. Takeuchi Y, Hirota K, Sakaguchi S. Impaired T cell receptor signaling and development of T cell-mediated autoimmune arthritis. Immunol Rev. 2020; 294:164–76. https://doi.org/10.1111/imr.12841 [PubMed]
- 56. Burger JA, Wiestner A. Targeting B cell receptor signalling in cancer: preclinical and clinical advances. Nat Rev Cancer. 2018; 18:148–67. https://doi.org/10.1038/nrc.2017.121 [PubMed]
- 57. Berry CT, Liu X, Myles A, Nandi S, Chen YH, Hershberg U, Brodsky IE, Cancro MP, Lengner CJ, May MJ, Freedman BD. BCR-Induced Ca2+ Signals Dynamically Tune Survival, Metabolic Reprogramming, and Proliferation of Naive B Cells. Cell Rep. 2020; 31:107474. https://doi.org/10.1016/j.celrep.2020.03.038 [PubMed]
- 58. Zikherman J, Parameswaran R, Weiss A. Endogenous antigen tunes the responsiveness of naive B cells but not T cells. Nature. 2012; 489:160–64. https://doi.org/10.1038/nature11311 [PubMed]
- 59. Merkenschlager M, Beverley PC. Evidence for differential expression of CD45 isoforms by precursors for memory-dependent and independent cytotoxic responses: human CD8 memory CTLp selectively express CD45RO (UCHL1). Int Immunol. 1989; 1:450–59. https://doi.org/10.1093/intimm/1.4.450 [PubMed]
- 60. Chong MM, Cornish AL, Darwiche R, Stanley EG, Purton JF, Godfrey DI, Hilton DJ, Starr R, Alexander WS, Kay TW. Suppressor of cytokine signaling-1 is a critical regulator of interleukin-7-dependent CD8+ T cell differentiation. Immunity. 2003; 18:475–87. https://doi.org/10.1016/s1074-7613(03)00078-5 [PubMed]
- 61. Cornish AL, Chong MM, Davey GM, Darwiche R, Nicola NA, Hilton DJ, Kay TW, Starr R, Alexander WS. Suppressor of cytokine signaling-1 regulates signaling in response to interleukin-2 and other gamma c-dependent cytokines in peripheral T cells. J Biol Chem. 2003; 278:22755–61. https://doi.org/10.1074/jbc.M303021200 [PubMed]
- 62. Ramanathan S, Gagnon J, Leblanc C, Rottapel R, Ilangumaran S. Suppressor of cytokine signaling 1 stringently regulates distinct functions of IL-7 and IL-15 in vivo during T lymphocyte development and homeostasis. J Immunol. 2006; 176:4029–41. https://doi.org/10.4049/jimmunol.176.7.4029 [PubMed]
- 63. Ilangumaran S, Ramanathan S, La Rose J, Poussier P, Rottapel R. Suppressor of cytokine signaling 1 regulates IL-15 receptor signaling in CD8+CD44high memory T lymphocytes. J Immunol. 2003; 171:2435–45. https://doi.org/10.4049/jimmunol.171.5.2435 [PubMed]
- 64. Rodriguez GM, D’Urbano D, Bobbala D, Chen XL, Yeganeh M, Ramanathan S, Ilangumaran S. SOCS1 prevents potentially skin-reactive cytotoxic T lymphocytes from gaining the ability to cause inflammatory lesions. J Invest Dermatol. 2013; 133:2013–22. https://doi.org/10.1038/jid.2013.86 [PubMed]
- 65. Hu Y, Yan C, Hsu CH, Chen QR, Niu K, Komatsoulis GA, Meerzaman D. OmicCircos: A Simple-to-Use R Package for the Circular Visualization of Multidimensional Omics Data. Cancer Inform. 2014; 13:13–20. https://doi.org/10.4137/CIN.S13495 [PubMed]
- 66. Yu G, Wang LG, Han Y, He QY. clusterProfiler: an R package for comparing biological themes among gene clusters. OMICS. 2012; 16:284–87. https://doi.org/10.1089/omi.2011.0118 [PubMed]
- 67. Subramanian A, Tamayo P, Mootha VK, Mukherjee S, Ebert BL, Gillette MA, Paulovich A, Pomeroy SL, Golub TR, Lander ES, Mesirov JP. Gene set enrichment analysis: a knowledge-based approach for interpreting genome-wide expression profiles. Proc Natl Acad Sci USA. 2005; 102:15545–50. https://doi.org/10.1073/pnas.0506580102 [PubMed]
- 68. Wang J, Tian Y, Zhu G, Li Z, Wu Z, Wei G, Zhuang L, Li Z, Chen X, Zhang X, Zheng J, Cai G. Establishment and validation of immune microenvironmental gene signatures for predicting prognosis in patients with head and neck squamous cell carcinoma. Int Immunopharmacol. 2021; 97:107817. https://doi.org/10.1016/j.intimp.2021.107817 [PubMed]
- 69. Newman AM, Liu CL, Green MR, Gentles AJ, Feng W, Xu Y, Hoang CD, Diehn M, Alizadeh AA. Robust enumeration of cell subsets from tissue expression profiles. Nat Methods. 2015; 12:453–57. https://doi.org/10.1038/nmeth.3337 [PubMed]