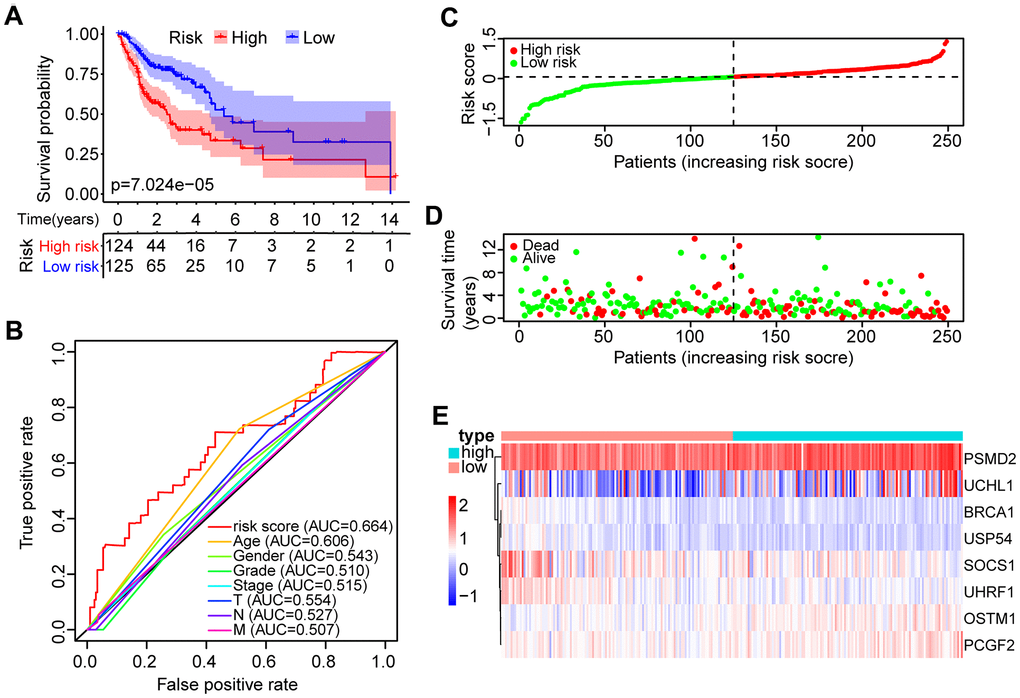
Figure 3.Identification of the prognostic risk model in HNSCC patients. (A) Kaplan-Meier survival curve with overall survival (OS) in the high- and low-risk HNSCC patients in the TCGA training set. (B) ROC curve showing AUC for the risk score and other clinical factors of HNSCC patients in the TCGA training set. (C) The risk plot distribution of the high- and low-risk HNSCC patients. (D) Scatter plot showing the survival status of HNSCC patients. (E) The expression of risk genes of HNSCC samples in the TCGA training set.