


Introduction
The aging process is associated with changes in a number of mechanisms maintaining physiology, subjected to the influence of genetics and life style, and leading to a range of outcomes that impact the quality of late life and longevity [1]. Brain health is a critical aspect of healthy aging. Neurological disorders have for several years remained as a leading cause of disability and the second leading cause of death globally [2], and an intrinsic problem of aging [2–4]. Normal aging includes reduction in the efficiency of DNA repair, inflammation, and changes in processes affecting neuronal circuitry [1]. Studies in animal models have suggested the beneficial contribution of genes that modulate lifespan by means that allow survival in conditions of energy availability [5]. In addition to the right genetic variants, acquired epigenetic control may also play a critical role. One of the genes that has been linked to longevity and successful aging, daf16, also known as FOXO, is responsive to the insulin growth factor 1 (IGF1) [6], but also to Sirtuin-1 (Sirt1) [7, 8], an epigenetic regulator, both regarded as molecular determinants of healthy aging.
Sirt1 has gained attention as a type III deacetylase acting on proteins and chromatin histones, to regulate molecular functions and to silence gene transcription in the presence of nicotinamide dinucleotide (NAD+) [9–13]. Sirt1 deacetylates histones H3, H4 and H1 and more than 50 non-histone proteins, including transcription factors and DNA repair proteins [14]. Sirt1 properties contribute to preventing disease by reverting cellular senescence, maintaining genomic integrity and promoting longevity. Increased Sirt1 expression promotes survival in a mouse model of genomic instability and suppresses age-dependent transcriptional changes [15], including of inflammatory genes. In the brain, Sirt1 levels and function have shown to be compromised in neurodegenerative conditions, particularly the ones associated with aging [16, 17]. Sirt1 is also a key factor in blood brain barrier (BBB) integrity and permeability, both directly in microvascular endothelium and indirectly via microglia [18–20]. In infections of the Central Nervous System (CNS), including with Simian Immunodeficiency Virus (SIV) [21], which is a model of Human Immunodeficiency Virus (HIV) [22–25] triggering cellular senescence markers, a drastic decrease in Sirt1 levels and changes in its activity are detectable in isolated microglia cells [21, 26]. The changes in Sirt1 dynamics identified in SIV infection were similar to what was observed in the brain of uninfected macaques with advanced age [26]. In spite of the evidence of Sirt1 as a factor in successful aging, a comparative analysis in subgroups of aged subjects, with animals that differ in health, inflammation, and longevity, has never been previously performed. Sirt1 has been suggested as one of the mediators of the benefits of calorie restriction to longevity [27], associated to decreased intracellular nicotinamide (NAM) [28, 29] and increased levels of nicotinamidases that regenerate NAD+ levels [30], linked to energy metabolism [31]. Sirt1 deficits on the other hand, show increased inflammation, cellular stress, cancer, disrupted glucose and fatty acid metabolism, and unhealthy aging phenotypes [32].
Here, we have compared brain pathogenesis and Sirt1 dynamic chromatin binding differences in brain pre-frontal cortex (PFC) from elder macaques, divided in 2 groups based on the age of necropsy and health conditions. One group consisted of shorter-lived elder animals between 18 and 20 years old (yo), equivalent to 60-70 human yo. Another group consisted of longer-lived elder animals between 23 and 29 yo, corresponding to 80-100 human yo and modeling successful aging. These groups were also compared with young adult 4-7 yo macaques’ brains. We compared neuroinflammatory markers and factors that interfere with Sirt1 levels and activity in the prefrontal cortex (PFC), which is a critical area controlling cognitive functions, including sustained and selective attention, inhibitory control, working memory, and multitasking abilities, which are all impacted by aging [33–35]. Microglia and inflammatory markers included Iba1, CD163 and also CD38, an enzyme that regulates its cellular NAD substrate with consequences to Sirt1 functional activation [36, 37]. Blood brain barrier integrity was accessed by fibrinogen. We also measured transcription of mir142-5p, a micro RNA that targets Sirt1 gene transcription [21]. Sirt1 chromatin binding patterns were compared in total PFC between the two groups of aged rhesus macaques. This allowed the identification of networks of genes and biological processes that may influence longevity in a Sirt1-dependent manner.
Materials and Methods
Monkeys
SIV-negative, simian retrovirus type D-negative, and herpes B virus-free rhesus macaques with 4-7 years old, purchased from Valley Biosystems (West Sacramento, CA, USA) as controls to other studies, were included in the comparison of molecular and pathological findings across the lifespan. At necropsy, the young animals were terminally anesthetized, and perfused intracardially with sterile PBS containing 1 U/mL of heparin, prior to brain harvest. Young brain frontal cortex samples were frozen and formalin-fixed for histology and used in this study. The brains from 8 elder macaques with ages between 18 and 29 years old were kindly donated by the NIH National Institute of Aging Non-Human Primate Tissue Repository, at the Wisconsin National Primate Center, which is a source of archived tissue from aged nonhuman primates, collected under approved protocols. Upon tissue request, animals that were found dead were excluded to prevent issues with tissue quality. Frozen tissue and paraffin embedded pre-frontal cortex (PFC) sections were made available from animals subjected to necropsy following veterinary recommendations, euthanized using Beuthanasia D (Intervet/Merck Animal Health), under Wisconsin National Primate Center guidelines that are available in primatedatabase.org. The experiments performed in at the San Diego Biomedical Research Institute using primate brain tissues were exempt from Institutional Animal Care and Use Committee, on grounds of repurposing specimens from other approved protocols, and approved by the Institutional Review Board and Biosafety Committees at SDBRI, with Biological Hazard Registration (BHR #20-001-MCM), following National Institutes of Health guidelines.
The characteristics of the animals can be visualized in Table 1.
Table 1. Animals used in this study, ages and group assignments.
| Number | Age of death (yo) | Post-mortem observations | Weight (kg) | Group assignment | |||||||||||||||||||||||||||||||||||||||||||||||||||||||||||||||||||||||||||||||||||||||||||||||
| 516 | 6.74 (scheduled) | Normal | 9.6 | Young | |||||||||||||||||||||||||||||||||||||||||||||||||||||||||||||||||||||||||||||||||||||||||||||||
| 332 | 5.48 (scheduled) | Normal | 8.5 | Young | |||||||||||||||||||||||||||||||||||||||||||||||||||||||||||||||||||||||||||||||||||||||||||||||
| 382 | 5.55 (scheduled) | Normal | 8.3 | Young | |||||||||||||||||||||||||||||||||||||||||||||||||||||||||||||||||||||||||||||||||||||||||||||||
| 357 | 4 (scheduled) | Normal | N/A | Young | |||||||||||||||||||||||||||||||||||||||||||||||||||||||||||||||||||||||||||||||||||||||||||||||
| 39 | 20.5 | Weight loss, diarrhea, dehydration, locally invasive ileocecal carcinoma | 7.65 | Shorter-lived (18-20yo) | |||||||||||||||||||||||||||||||||||||||||||||||||||||||||||||||||||||||||||||||||||||||||||||||
| 51 | 19 | Weight loss, diarrhea, small intestine membrane carcinoma, secondary amyloidosis in the gut | 15 | Shorter-lived (18-20yo) | |||||||||||||||||||||||||||||||||||||||||||||||||||||||||||||||||||||||||||||||||||||||||||||||
| 66 | 18.4 | Weight loss, dehydration, enlarged liver, amyloid deposits in liver, spleen, kidney and adrenals | 7.4 | Shorter-lived (18-20yo) | |||||||||||||||||||||||||||||||||||||||||||||||||||||||||||||||||||||||||||||||||||||||||||||||
| 81 | 18.25 | Weight loss, dehydration, diabetes mellitus, pancreatic amyloidosis, HVP2+, STLV1+ | 15.1 | Shorter-lived (18-20yo) | |||||||||||||||||||||||||||||||||||||||||||||||||||||||||||||||||||||||||||||||||||||||||||||||
| 208 | 26.75 | Weight loss, liver amyloidosis, adhesions, scoliosis of the spine | 8.3 | Longer-lived (23-29yo) | |||||||||||||||||||||||||||||||||||||||||||||||||||||||||||||||||||||||||||||||||||||||||||||||
| 213 | 23.42 | Weight loss, diarrhea, adhesions, HBV+, STLV1+ | 7.62 | Longer-lived (23-29yo) | |||||||||||||||||||||||||||||||||||||||||||||||||||||||||||||||||||||||||||||||||||||||||||||||
| 227 | 23.1 | Scrotal hernia with resection and anastomosis, small leakage to jejunum, liver cysts, spondylosis and vertebrae fusion, left accessory lung lobe pale purple | 11.8 | Longer-lived (23-29yo) | |||||||||||||||||||||||||||||||||||||||||||||||||||||||||||||||||||||||||||||||||||||||||||||||
| 325 | 29.2 | Weight loss, dermatitis, ankylosis of joints, kyphosis, tartar and arthritis, liver amyloidosis, renal cortical cyst, constriction of ceco-colonic junction, metaplastic focus on pancreas | 8.31 | Longer-lived (23-29yo) | |||||||||||||||||||||||||||||||||||||||||||||||||||||||||||||||||||||||||||||||||||||||||||||||
| N/A – Not available. | |||||||||||||||||||||||||||||||||||||||||||||||||||||||||||||||||||||||||||||||||||||||||||||||||||
qRT-PCR
RNA and miRNA were extracted from 0.5cm3 PFC tissue fragments, using RNeasy and miRNeasy kits, respectively. The qPCR primers for mir-142-5p, mir-142-3p and mir-34a were from the Qiagen miScript Primer Assay using U6 small nuclear RNA (snRNA) as housekeeping control. For qRT-PCR, the RT2 SYBR green qPCR master mix was used with Sirt1 primers and GAPDH was used as housekeeping control. All reagents were Qiagen.
ChIP-Seq
ChIP was performed in ~0.6cm3 tissue fragments by Active Motif (Carlsbad, CA, USA). A ChIP reaction was carried out with 32ug of chromatin (pooled 8ug from each animal per group in duplicate) and anti-Sirt-1 antibody (Millipore). The ChIP DNA was processed into an Illumina ChIP-Seq library and sequenced +/10000 bb, to generate >2 million reads, which were aligned to the M.mulatta genome annotation (MacaM/December 2019 assembly) and >15 million unique aligns (removed duplicates) were obtained. A signal map showing fragment densities along the genome was visualized in the Integrated Genome Browser (IGB) and MACS peak finding was used to identify peaks. Control data was derived from 5.1 million (positive control) and 5.8 million (negative control) alignments. With default settings, 307 Sirt-1 meaningful peaks genome-wide consistent to promoter regions in all samples, were identified. Raw data and metadata are available at GEO GSE95793.
Systems analysis
Pathway assignments and functional annotations were analyzed using DAVID Bioinformatics Database [38]. To complete the bioinformatics analysis, two knowledge base resources were queried: the Ingenuity Knowledge Base [39] and interaction repositories based on cpath [40–42] containing interactions that have been curated by GeneGo (http://www.genego.com), the Kyoto Encyclopedia of Genes and Genomes (KEGG - http://www.genome.jp/kegg/), and Ingenuity. Benjamini False Discovery Rate (FDR) adjusted values <0.01 and p values < 0.05 (provided by DAVID) were utilized as conservative filters for identification of true values. Cluster analysis and networks were obtained and visualized using Cytoscape 3.9.1 [43]. Pathway and genetic interaction-based connections between significantly different genes were assembled and visualized using GeneMania. Active pathways were identified using JActive Modules based on score and low (0.8) overlap threshold.
Immunohistochemistry (IHC)
Formalin-fixed, paraffin embedded brain tissue sectioned in 7u slices was used for the detection of molecular markers using antibodies against Iba-1 (AIF1 - WAKO, Richmond, VA, USA), CD163 (Invitrogen), Fibrinogen (Millipore, Temecula, CA, USA) and CD38 (Novus Biologicals, Centenial, CO, USA), using standard procedures [44]. The incubation with biotinylated secondary antibodies (Vector Labs, Burlingame, CA, USA) was followed by Streptavidin-HRP, and development was performed using NovaRed (Vector Labs), and counterstaining with Gill’s hematoxylin.
Statistical analysis
Results are expressed as Mean ± SD. One-way analysis of variance with Bonferroni post hoc test and Student’s t test were performed in Prism 8 (GraphPad Software LLC). Pearson analysis, graph builder properties and full factorial analysis were performed in JMP Pro15. P < 0.05 was considered significant.
Results
Inflammation markers differentiate between young, shorter- and longer-lived elder animals
Paraffin-embedded tissue from animals in Table 1 was used for identifying differences in the expression of microglia markers using IHC (Figure 1). Iba-1 (AIF1), and CD38 were measured and quantified using Image J. We found that PFC from elder animals, regardless of group assignment, differed significantly from young PFC (Figure 1). However, these differences occurred in different ways within the aged group, in an age-dependent fashion. For instance, shorter-lived elder animals, which died between 18 and 20 years of age, showed a significantly smaller number of Iba1+ cells compared to young ones, and to longer-lived animals, indicating that severe microglial loss was a characteristic of the group with shorter lifespan (F2,12=189.2, p<0.0001). Microglia morphology and Iba1 quantification in longer-lived elder animals indicated some impact of age, with significant although less severe microglial loss compared to shorter-lived animals. The results of Iba1+ cell morphology and density suggested that the ability to maintain the microglia population may be important for longevity.
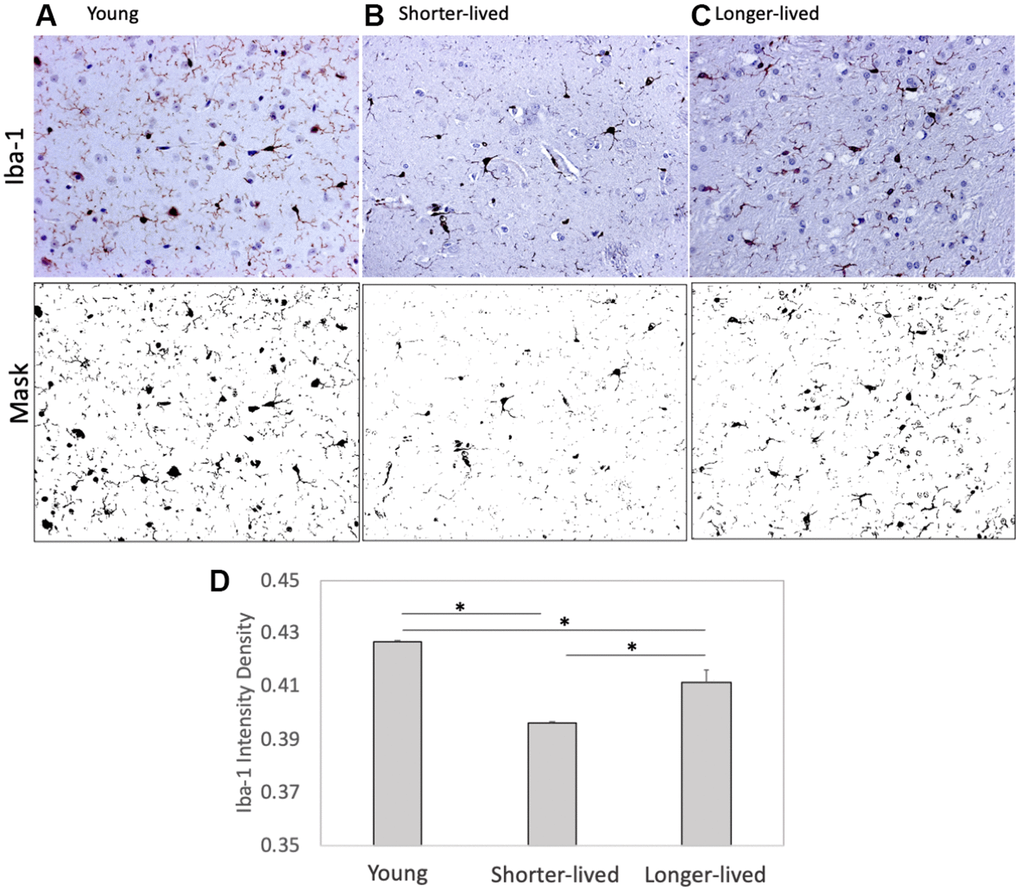
Figure 1. Expression of the microglia marker Iba1 in PFC from young animals and animals that lived to age. Paraffin-embedded tissue sections were stained with antibody anti- Iba-1 (AIF1, dark brown staining) and digitally imaged for density intensity quantification in whole section digital 8-bit images and binary masks using Image J (NIH). (A) Representative image taken from a young (4-7 yo) monkey, (B) representative shorter-lived (18-20 yo) group image, from an 18 yo monkey (M66), (C) representative longer-lived (23 – 29 yo) group image, from a 27 yo monkey (M208). (D) Iba-1 intensity density measured in ImageJ Fiji, using mask features. N=4/group. All representative images are 20X magnification. *p<0.0001 in multiple comparisons.
CD38 is a marker of immune activation and a NAD limiting factor. We found an effect of age on the expression of CD38 measured by IHC on PFC sections (F2,12=4.995, p=0.0347). This marker expressed at higher levels in all elder animals compared to young controls (Figure 2D). Young animals had few CD38+ cells associated with vessels and few diffuse in the parenchyma (Figure 2A). Although the two elder groups expressed similar CD38 intensity levels (p=0.998), which were higher than young (p=0.05), distribution patterns differed significantly between them (Figure 2B–2D). In shorter-lived elders, CD38+ cells were strongly stained and were mostly clustered in perivascular foci, associated with signs of edema and tissue damage. On the other hand, in longer-lived animals these cells were diffuse, some perivascular, but no severe pathology. CD163 expression in myeloid cells characterizes response to inflammation and was restricted to the perivascular domain (Figure 2E–2G). Although blood vessels were enlarged in both elder groups, shorter-lived animals had significantly more detectable CD38+ cells compared to young, while in longer-lived animals the increase was not significantly different from the other groups (Figures 2H).
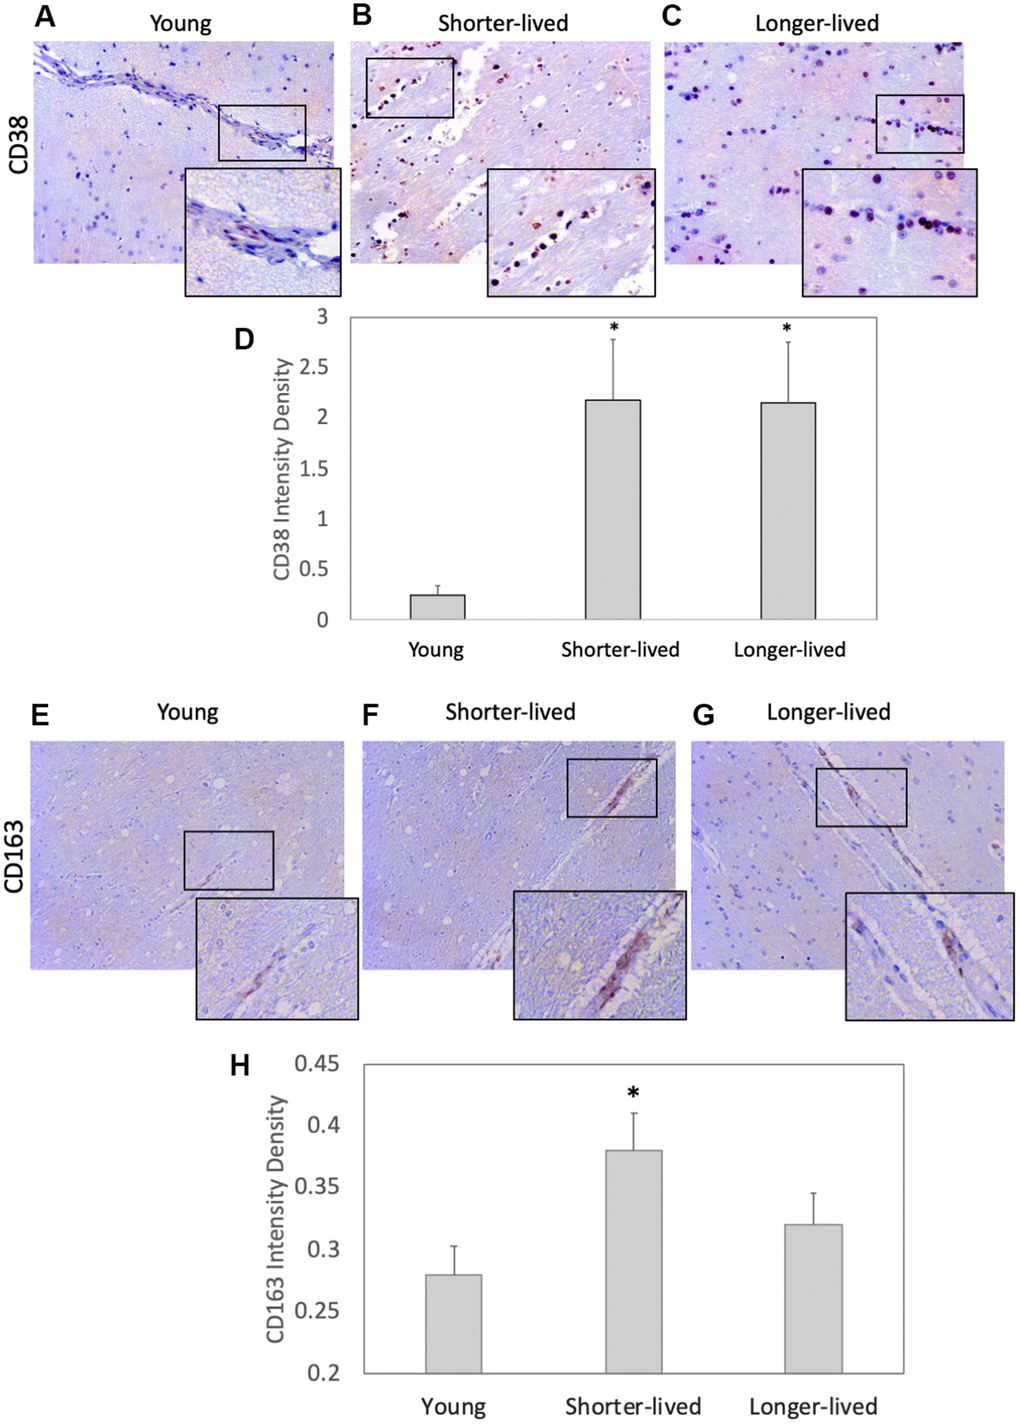
Figure 2. Expression of the inflammation markers CD38 and CD163 in PFC from young and elder animals. Paraffin-embedded PFC sections were stained with (A–C) antibody anti- CD38 (observed in brown color) and (E–G) anti- CD163, which were (D, H) digitally imaged for density intensity quantification in 8-bit binary masks using Image J (NIH). Rectangles indicate areas expanded for detail. (A) Representative CD38 image of young (4-7 yo) group, (B) representative CD38 image of shorter-lived elder animals. (C) Representative CD38 image of longer-lived elders. (D) CD38 staining density intensity measured in 8-bit digital whole section images and binary masks, using ImageJ. (E) Representative CD163 image of young (4-7 yo) group, (F) representative CD163 image of shorter-lived elder animals. (G) Representative CD163 image of longer-lived elders. (H) CD163 staining density intensity measured in 8-bit digital whole section images and binary masks, using ImageJ. All images are 40X magnification. N=4/group. *p<0.05 in multiple comparisons.
The loss of integrity of the BBB is a critical component of aging, which can be detectable in tissue sections by the staining against fibrinogen, which is normally maintained within blood vessels by strong endothelial junctions [45]. Fibrinogen staining marked the microvasculature and, when found in the extravascular space, it indicated loss of BBB integrity and leaks (Figure 3). In both elder groups, extravascular fibrinogen was occasionally detected, showing leaks from blood vessels to the brain tissue (Figure 3B, 3C). Larger leaks were observed in the longer-lived group (Figure 3C), compared to the shorter-lived group (Figure 3B).
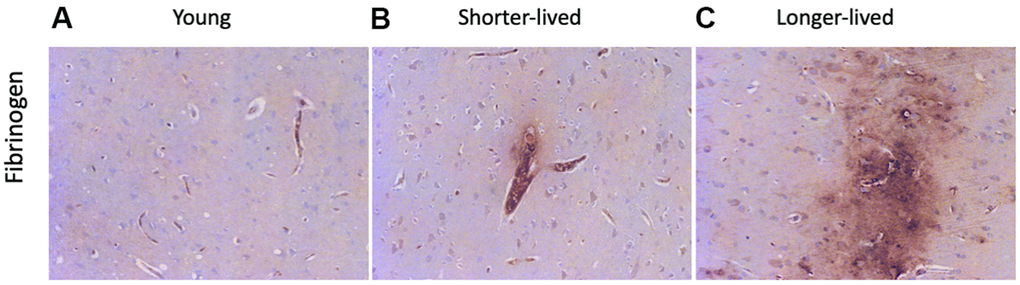
Figure 3. BBB integrity via detection of fibrinogen in PFC from young and elder animals. Paraffin-embedded PFC sections were stained with antibody anti- fibrinogen. (A) representative image from young (4-7 yo) group, (B) representative image from the shorter-lived group, (C) representative image from longer-lived animals. All images are 20X magnification.
Mir-142-5p increased with age while Sirt1 transcription decreased in PFC of long-lived aged animals
We previously identified mir142 as a critical contributor to the collapse of Sirt1 transcription and function in macaques that develop neuropathology as a result of infection with the Simian Immunodeficiency Virus [21]. Given the role of Sirt1 in aging, we examined the transcription of mir-142-5p, mir-142-3p and Sirt1 genes in mRNA extracted from the PFC of all young and long-lived aged animals, which were made available to us by the NIA Non-Human Primate Tissue Repository (n=4/group). Mir-142-3p was not detectable (data not shown). Regarding mir-142-5p, shorter-lived elder animals did not differ in its transcription compared to young animals, while longer-lived ones showed significantly higher transcription compared to both young and shorter-lived elders (Figure 4A). Sirt1 transcription was decreased in both elder groups compared to young, however shorter-lived elders had a significantly lower Sirt1 expression compared to longer-lived animals (Figure 4B), indicating a correlation between longevity and maintenance of Sirt1 transcriptional activity.
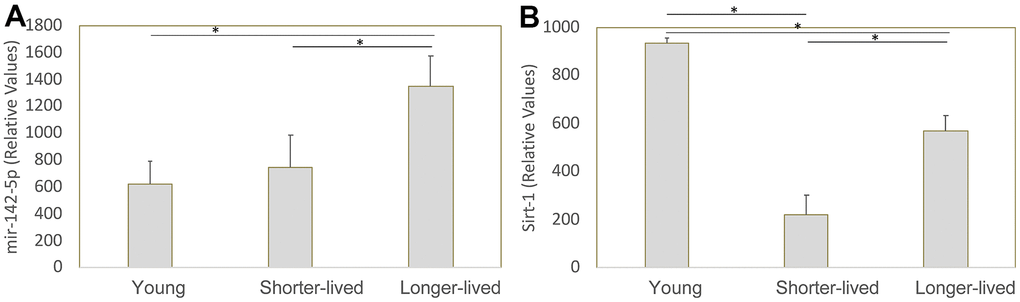
Figure 4. Transcription of mir-142-5p and Sirt1 genes in PFC from young animals and animals that lived to age. The expression of these genes was measured by qRT-PCR in total PFC extracted mRNA and normalized against GAPDH. Relative values of (A) mir142-5p and (B) Sirt1 were compared between young (4-7 yo), shorter-lived (18-20yo) and longer-lived (23 – 29 yo) elder groups. *p<0.05 in Bonferroni’s multiple comparisons.
Signature changes in Sirtuin -1 binding to chromatin distinguish shorter- and longer-lived elder groups
In order to estimate the link between longevity, Sirt1 transcription and chromatin binding activity, we examined differences in Sirt1 dynamics and binding to chromatin in both groups of elder animals. The comparison and analysis of Sirt1 binding patterns and target genes was indicative of epigenetic silencing activity and signatures associated with longevity and maintenance of microglia cells, in spite of inflammation and vascular leaks.
In spite of higher transcription of Sirt1, the absolute number of Sirt1 peaks was reduced in long-lived aged (>23yo) animals compared to old (18-20) (Table 2). However, the distribution of peaks indicated a smaller diversity in the genes regulated by Sirt1 in long-lived animals compared to old, characterized by gaps in the genomic intervals presenting Sirt1 peak reads in long-lived animals (Figure 5A). On the other hand, the detailed analysis of intervals also indicated and enrichment of in-gene binding sites in old animals compared to long-lived (Figure 5B). The implications of these differences are unknown but may reflect more frequent disruptions in the transcriptional process occurring in old PFC, in addition to the active silencing at regulatory regions. Figure 5C shows an example of these functional amendments in the AIF1 gene that encodes Iba1, indicating a concentration of Sirt1 peak signal on promoter and regulatory regions (resembling controls [26]) in long-lived animals, and a spread of Sirt1 signal in the same gene in old PFC.
Table 2. Characterization of Sirt1 peak signal and interval distribution in PFC from shorter- (18-20yo) and longer-lived (>23 yo) elder rhesus macaques.
| Description | Act regions | Shorter- Sirt1 Rh | Shorter- Sirt1 Rh (%) | Longer- Sirt1 Rh | Longer- Sirt1 Rh (%) | Input overlap | Input overlap (%) |
| Total # Intervals in Build | 307 | 110 | 34 | ||||
| # Intervals within -10000/+10000 bp of Genes | 274 | 226 | 73.62% | 75 | 68.18% | 12 | 35.29% |
| # Intervals NOT within -10000/+10000 bp of Genes | 137 | 81 | 26.38% | 35 | 31.82% | 22 | 64.71% |
| # NCBI Genes with Intervals within -10000/+10000 bp | 411 | 347 | 107 | 10 | |||
| # Intervals within Promoter Region (-7500/+2500 bp of NCBI Gene Start) | 208 | 181 | 58.96% | 52 | 47.27% | 6 | 17.65% |
| # Intervals 500 bp of NCBI Tx Start | 145 | 129 | 42.02% | 37 | 33.64% | 1 | 2.94% |
| # NCBI Genes with intervals in Promoters (-7500/2500 bp of start) | 304 | 267 | 69 | 10 |
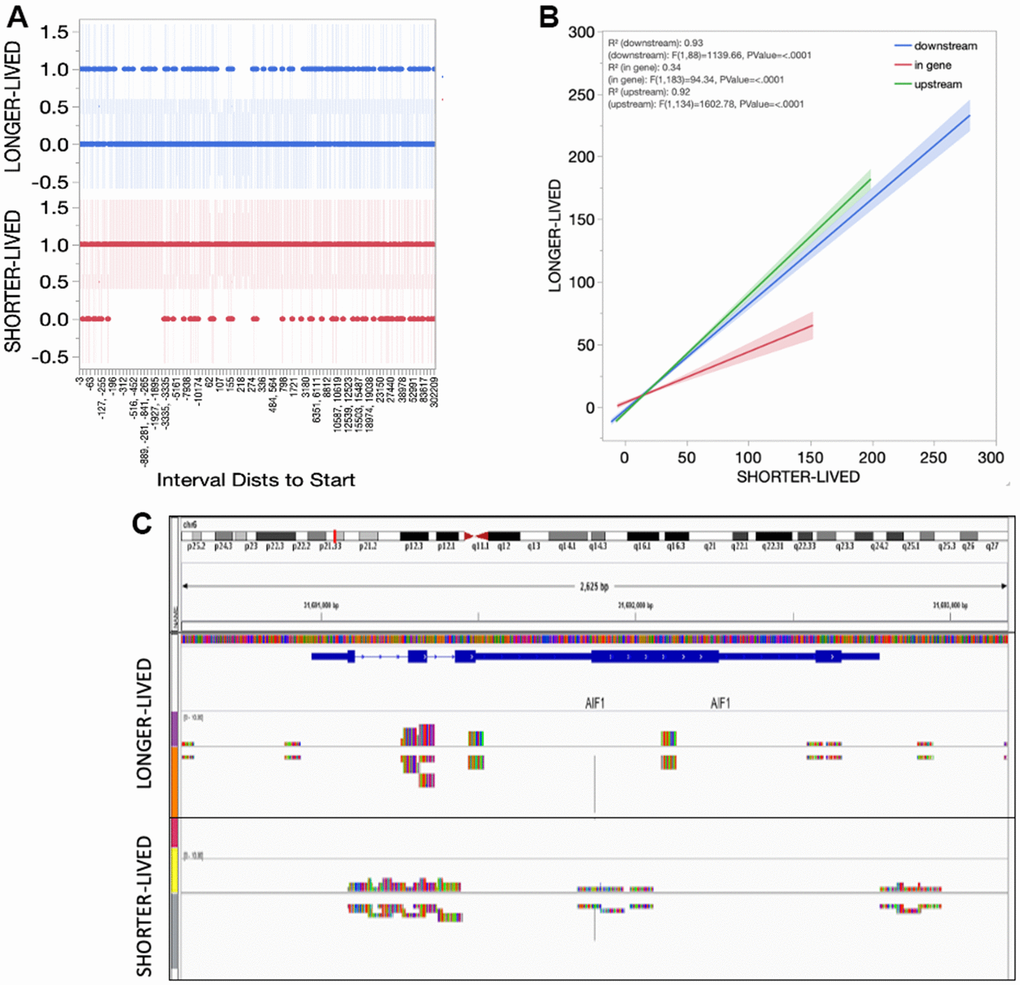
Figure 5. Sirt1 distribution in the PFC tissue from shorter- and longer- lived elder animals. (A) Interval distances from start where Sirt1 peaks are observed in chromatin preparations from PFC bulk tissue indicating presence (1) versus absence (0). (B) Interval positions of Sirt1 binding in PFC from shorter- and longer-lived animals. (C) Example of Sirt1 peak signal in the AIF1 gene, indicating a spread in shorter animals.
A detailed analysis of changes in Sirt1 binding between PFCs from shorter- and from longer-lived elder animals, regardless of position, indicated differences in the activity of Sirt1 on genes strongly associated by pathway (Figure 6), visualized as fold change (old/long-lived) in Genemania and analyzed using JActive Modules for the identification of active pathway connections between gene clusters with low overlapping threshold. Two main modular networks were identified (Figure 6). Module A connected 90 genes with a score 5.9 (Figure 6A). Module B connected 99 genes with a score 5.52 (Figure 6B). The enrichment in Sirt1 activity in these networks may signify processes that are actively disrupted or downregulated in shorter-lived animals compared to longed-lived elders, and vice-versa.
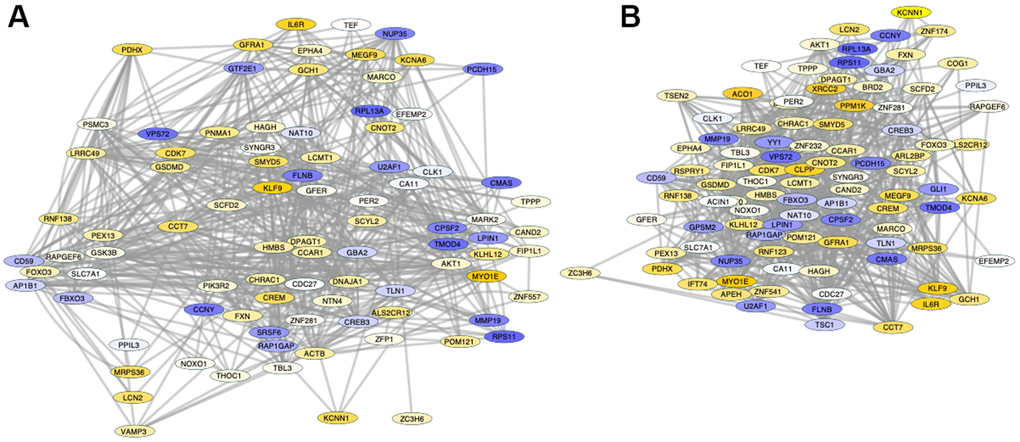
Figure 6. Pathway-based gene networks with differences in Sirt1 binding in PFC chromatin between shorter- and longer-lived elder animals. Significant differences in Sirt1 bind peak binding and intensity were introduced in GeneMania for fold-change visualization regardless of genomic region between pooled shorter-lived versus longer-lived elder PFCs. A network of interacting genes consistent in all animals was subjected to JActiveModules for the identification of pathway based modular clusters with minimal overlap. Two pathway -based modular clusters were identified: (A) Module 1 (detail in Supplementary Material Module 1 and Table 3). (B) Module 2 (detail in Supplementary Material Module 2 and Table 4). Tones of yellow indicate increase, and tones of blue indicate decrease in Sirt1 peaks in shorter-lived animals compared to longer-lived ones, indicating differences in silencing between the groups.
Module A (Figure 6A) contained 47 out of 90 genes that interacted through pathway which exhibited Sirt1 binding activity significantly increased above 1.5-fold in shorter- compared to longer-lived, indicating that they are more likely to being silenced in shorter-lived animals but active in longer-lived ones. These genes were annotated to transferase molecular functions (p=0.0063), mitochondrion as a cellular component (p=0.0068), and several biological processes, including transport (p=0.0011), heme biosynthesis (p=0.0033(p=0.0046) and protein transport (p=0.0052). KEGG pathway assessments indicated that these genes were involved in EGFR tyrosine kinase inhibitor resistance, endometrial cancer, longevity regulation, prolactin signaling, HIF-1 signaling, Neurotrophin signaling, Thyroid hormone signaling, FoxO signaling, cellular senescence, and the JAK/STAT pathway (Table 3). In the same module A, 17 genes had a -1.5 decrease in Sirt1 binding in shorter- versus longer-lived animals, indicating that these genes are more active in shorter-lived animals, but being more tightly regulated in longer-lived PFCs. These were annotated to pathways such as RNA binding molecular functions (p=0.0035), nucleus as a cellular component (p=0.039), and mRNA processing biological process (p=0.0058).
Table 3. KEGG pathway annotations for module 1.
| Pathways | P-Value |
| EGFR tyrosine kinase inhibitor resistance | 0.003 |
| Focal adhesions | 0.009 |
| Endometrial cancer | 0.015 |
| Longevity regulating pathway | 0.017 |
| GnRH secretion | 0.018 |
| Prolactin signaling pathway | 0.021 |
| Non-small cell lung cancer | 0.022 |
| Neutrophil extracellular trap formation | 0.022 |
| Shigellosis | 0.043 |
| HIF-1 signaling pathway | 0.047 |
| Neurotrophin signaling pathway | 0.047 |
| AMPK signaling pathway | 0.048 |
| Thyroid hormone signaling pathway | 0.049 |
| FoxO signaling pathway | 0.05 |
| Cellular senescence | 0.051 |
| JAK-STAT signaling pathway | 0.052 |
Module B contained 57 out of 99 genes interacting through pathway (Table 4) which exhibited Sirt1 binding activity increased above 1.5-fold, indicating that they may be silenced in shorter-lived PFCs but active in longer-lived ones. Mitochondrion was annotated as a cellular component (p=0.011). Biological processes associated with these genes (Table 4) were protein kinase activity (p=0.009), heme biosynthesis (p=0.04) and iron transport (p=0.049). The EGFR tyrosine kinase biosynthesis was the only pathway annotation identified for these genes (p=0.02). In module B, 19 genes had a -1.5 decrease in Sirt1 binding, indicating that they were active in shorter-lived animals but being likely regulated in longer-lived PFC. Similar to module A, these were annotated to nucleus as a cellular component (p=0.008), with differentiation as a biological process (p=0.0052).
Table 4. KEGG pathway annotations for module 2.
| Pathways | P-Value |
| Longevity regulating pathway | 0.002 |
| Cytoplasmic transport | 0.003 |
| AMPK signaling pathway | 0.004 |
| EGFR tyrosine kinase inhibitor resistance | 0.008 |
The genes with highest Sirt1 peaks in shorter-lived PFCs compared to longer-lived ones (most likely silenced) included Myosin 1E (MYO1E, 4-fold), Kruppel-like factor 9 (KLF9, 3.75-fold), Forkhead box O3 (FOXO3, 2.86-fold) and Interleukin 6 Receptor (IL6R, 3.6-fold). Genes with highest Sirt1 peaks in longer-lived animals compared to shorter-lived (indicating likely suppression in longer-lived) included the ribosomal protein 13a (RPL13A, 0.13-fold), the ribosomal protein S11 (RPS11, 0.13-fold), the matrix metallopeptidase 19 (MMP19, 0.19-fold), Tropomodulin 4 (TMOD4, 0.19-fold), N-acylneuraminate cytidylyltransferase (CMAS, 0.23-fold) and Cyclin Y (CCNY, 0.25-fold), associated with RNA binding (p=0.011) and acetylation processes (p=0.053), all regulated by Sirt1.
Of interest to the regulation of the longevity process, FOXO3 (2.86-fold) and AKT serine/threonine kinase (AKT1, 1.9-fold) had Sirt1 peaks in shorter- versus longer-lived animals. The TSC complex subunit 1 (TSC1) and cAMP responsive element binding protein 3 (CREBP3) had significantly less (0.7-fold) Sirt1 binding in shorter- versus longer-lived PFCs.
Discussion
Differences in the Iba1 microglia compartment between shorter – and longer-lived PFC and compared to young indicated that microglia loss may be a component affecting longevity. Shorter-lived animals not only had significantly less microglial cells than longer-lived and young, but also showed more signs of tissue damage with edema and perivascular CD163+ cells, as well as lower transcription of Sirt1. Interestingly, both elder groups had similar levels of CD38+ cells, which was higher than young, and BBB leaks.
Microglia activation and BBB integrity both contribute to small vessel disease that is commonly found in aging, although not necessarily in an interdependent manner [46]. However, microglial activation has been observed around vascular leaks, including in models that replicate the aging brain such as mild hypoxia [47]. Importantly, microglial depletion drastically increases loss of tight junction proteins that characterize vascular integrity, largely aggravating leaks [48]. Microglia cells may interact with extravascular fibrinogen to promote protective signals [48], balancing pro-inflammatory responses. Paradoxically, occasional but larger leaks were observed in longer-lived animals, which had microglial cell at levels that were higher than shorter-lived ones. This observation could support a role for fibrinogen and microglia signal interactions on maintaining the homeostasis of brain cell populations and BBB integrity. Whether microglial cell numbers and Sirt1 transcription and activity determine protection and survival outcomes, remains to be addressed.
The CD38+ cells, previously linked to neurodegenerative and neuroinflammatory insults of aging [49], were present in both elderly groups at levels that were higher than in young PFC. Yet, their distribution differed considerably, being associated to perivascular edema and tissue damage in shorter-lived animals, but diffuse and lightly stained in longer-lived animals. CD38 can be expressed by both T cells and macrophages, playing a critical role in pro-inflammatory responses strongly linked to its enzymatic activity over NAD, and as a prognosis of pathogenic outcome [50, 51]. Importantly, NAD serves as a neuroprotective agent [36] by activating Sirtuins activity [52].
The regulation of Sirt1 and its gene silencing functions, can result from both transcriptional changes, as well as changes impacting its functional dynamics. We have previously described the role of mir-142 in controlling Sirt1 transcription in microglia [21]. However, the results indicate that mir-142 may be one of the factors controlling Sirt1 transcription. For instance, longer-lived animals had higher levels of mir-142, yet Sirt1 transcription was lowest in shorter-lived animals. Other microRNAs have been suggested to regulate Sirt1, such as mir-34a [53], which occurred at low levels in these specimens and did not differ between groups (data not shown). Sirt1 transcription could be influenced by transcription factors not addressed in this study, such as E2F1 and HIC1, particularly in conditions of oxidative stress [54, 55].
The comparison between elderly groups of Sirt1 chromatin binding sites and frequency in bulk PFC tissue by ChIP-seq served as an indirect measure of epigenetic function and silencing activity. Chromatin binding peaks differed significantly in quality, as well as in numbers, between the two elderly groups indicating divergent patterns and regulated processes. The comparison between PFC of shorter-lived animals, young (4-7yo) controls, as well as young rhesus macaques infected with SIV, has been previously described by us [26]. That comparison indicated that a decrease in Sirt1 activity in conditions of SIV infection was similar to age [26]. The comparison of aging subgroups performed here indicated qualitative differences associated with longevity outcomes in uninfected animals. Interestingly, shorter- and longer-lived animals showed Sirt1 peak differences in genes associated with aging, metabolism and nuclear activity. Sirt1 binding to in-gene sequences was significantly enriched in shorter-lived elder animals, with no changes in upstream and downstream activity was similar between the elder groups. The implications of in-gene silencing are not well defined. It is possible that this may serve as a mechanism of transcriptional disruption, generating truncated or non-functional RNA, in addition to the active silencing in promoters and regulatory intron regions, and resulting in transcript degradation [56]. Whether this is a factor that results from or contributes to the lack of microglia cells, remains to be addressed.
Although Sirt1 activity was concentrated in genes involved in aging pathways (HIF, senescence, longevity, etc.), interesting differences were detected in individual genes between the two elder groups. Shorter-lived animals, for example, had strong Sirt1 enrichment in the IL6R gene, indicating its silencing. This could be a consequence of lower microglia cell numbers, or defective inflammatory responses. Enrichment patterns indicate that longer-lived animals have Sirt1 activity in RNA binding and acetylation genes, but lower activity in nuclear and differentiation pathways.
Microglia are the first cells to populate the brain during development [57, 58], preceding neurogenesis and the formation of BBB [59, 60]. RNAseq studies have suggested that subsets of microglia become more prevalent with age, which may be associated with protection [61].
This study has limitations due to the small number of animals. Moreover, the differences between elderly groups could be linked to clinical observations leading to necropsy and to post-mortem findings. For instance, long-lived animals had compromised bones and joints, and internal adhesions, but did not have tumors, diabetes or signs of metabolic disorders, which were rather found in the shorter-lived elderly group. Thus, microglial loss could also result from systemic disease more frequently observed in shorter-lived animals. Age-matching controls, particularly to the shorter-lived animals’ group was not available, limiting conclusions. Yet, it is unlikely that the loss of microglia is just a transient age-effect, while the maintenance of microglia numbers in animals that lived longer suggests this may be a hallmark of healthy aging. The correlation between microglia and age was striking, suggesting that supporting this population may be critical to longevity.
Successful aging is largely associated with preserved cognition [62], for which data is not available in the animals studied here. This work suggests that preservation of microglia and Sirt1 binding activity and patterns, as well as the directionality of pathways regulated by Sirt1, are prognostic of long-living. This work suggests the importance of microglia and epigenetic cross-talk in aging processes, influenced by and influencing pathogenesis.
Author Contributions
LB performed all the transcriptional studies, pathway analysis and helped write the manuscript. NB performed all the ChIP studies and proofread the manuscript. BC participated in the conception of the study and was present to all the discussions. HSF participated in all the discussions and provided the specimens for controls. RM contributed to studies on BBB leaks and participated in the discussions. MCGM conceptualized the study, obtained specimens from aging macaques, participated in the preparation of specimens for the assays, performed statistical analysis and systems biology, wrote the manuscript and obtained funding.
Acknowledgments
The authors thank Dr. Douglas Galasko (University of California, San Diego) for helpful discussions. We thank the National Institute of Aging, Non-Human Primate Tissue Bank for specimens, especially Jennifer Stone (Wisconsin National Primate Center, Madison), Heidi Brogdon (Biological Resources Branch, Division of Aging Biology, National Institute on Aging) and Tracy Cope (Division of Aging Biology, National Institute on Aging) for help with acquisition and selection of aging primate specimens, animal history and primate records, Dr. Brenda Morsey (University of Nebraska Medical Center) for help with young primate records. We also thank Krista Scrivner and Christine Auciello for administrative assistance.
Conflicts of Interest
The authors declare that they have no conflicts of interest.
Ethical Statement
This study was conducted according to national and international guidelines and approved by SDBRI institutional review board under IRB#001-21-MCM.
Funding
This study was performed with funding from R21AG054240, R01DA036164 and R01DA047822 to MCGM.
References
- 1. Wahl D, Solon-Biet SM, Cogger VC, Fontana L, Simpson SJ, Le Couteur DG, Ribeiro RV. Aging, lifestyle and dementia. Neurobiol Dis. 2019; 130:104481. https://doi.org/10.1016/j.nbd.2019.104481 [PubMed]
- 2. Avan A, Hachinski V. Stroke and dementia, leading causes of neurological disability and death, potential for prevention. Alzheimers Dement. 2021; 17:1072–6. https://doi.org/10.1002/alz.12340 [PubMed]
- 3. Chin JH, Vora N. The global burden of neurologic diseases. Neurology. 2014; 83:349–51. https://doi.org/10.1212/WNL.0000000000000610 [PubMed]
- 4. Shubhakaran KP, Chin JH. The global burden of neurologic diseases. Neurology. 2015; 84:758. https://doi.org/10.1212/WNL.0000000000001251 [PubMed]
- 5. Passarino G, De Rango F, Montesanto A. Human longevity: Genetics or Lifestyle? It takes two to tango. Immun Ageing. 2016; 13:12. https://doi.org/10.1186/s12979-016-0066-z [PubMed]
- 6. Ogg S, Paradis S, Gottlieb S, Patterson GI, Lee L, Tissenbaum HA, Ruvkun G. The Fork head transcription factor DAF-16 transduces insulin-like metabolic and longevity signals in C. elegans. Nature. 1997; 389:994–9. https://doi.org/10.1038/40194 [PubMed]
- 7. Kobayashi Y, Furukawa-Hibi Y, Chen C, Horio Y, Isobe K, Ikeda K, Motoyama N. SIRT1 is critical regulator of FOXO-mediated transcription in response to oxidative stress. Int J Mol Med. 2005; 16:237–43. [PubMed]
- 8. Susanti VY, Sasaki T, Yokota-Hashimoto H, Matsui S, Lee YS, Kikuchi O, Shimpuku M, Kim HJ, Kobayashi M, Kitamura T. Sirt1 rescues the obesity induced by insulin-resistant constitutively-nuclear FoxO1 in POMC neurons of male mice. Obesity (Silver Spring). 2014; 22:2115–9. https://doi.org/10.1002/oby.20838 [PubMed]
- 9. Guarente L. Diverse and dynamic functions of the Sir silencing complex. Nat Genet. 1999; 23:281–5. https://doi.org/10.1038/15458 [PubMed]
- 10. Guarente L. Sir2 links chromatin silencing, metabolism, and aging. Genes Dev. 2000; 14:1021–6. [PubMed]
- 11. Imai S, Johnson FB, Marciniak RA, McVey M, Park PU, Guarente L. Sir2: an NAD-dependent histone deacetylase that connects chromatin silencing, metabolism, and aging. Cold Spring Harb Symp Quant Biol. 2000; 65:297–302. https://doi.org/10.1101/sqb.2000.65.297 [PubMed]
- 12. North BJ, Verdin E. Sirtuins: Sir2-related NAD-dependent protein deacetylases. Genome Biol. 2004; 5:224. https://doi.org/10.1186/gb-2004-5-5-224 [PubMed]
- 13. Toiber D, Sebastian C, Mostoslavsky R. Characterization of nuclear sirtuins: molecular mechanisms and physiological relevance. Handb Exp Pharmacol. 2011; 206:189–224. https://doi.org/10.1007/978-3-642-21631-2_9 [PubMed]
- 14. Michan S, Sinclair D. Sirtuins in mammals: insights into their biological function. Biochem J. 2007; 404:1–13. https://doi.org/10.1042/BJ20070140 [PubMed]
- 15. Oberdoerffer P, Michan S, McVay M, Mostoslavsky R, Vann J, Park SK, Hartlerode A, Stegmuller J, Hafner A, Loerch P, Wright SM, Mills KD, Bonni A, et al. SIRT1 redistribution on chromatin promotes genomic stability but alters gene expression during aging. Cell. 2008; 135:907–18. https://doi.org/10.1016/j.cell.2008.10.025 [PubMed]
- 16. Ng F, Wijaya L, Tang BL. SIRT1 in the brain-connections with aging-associated disorders and lifespan. Front Cell Neurosci. 2015; 9:64. https://doi.org/10.3389/fncel.2015.00064 [PubMed]
- 17. Lutz MI, Milenkovic I, Regelsberger G, Kovacs GG. Distinct patterns of sirtuin expression during progression of Alzheimer’s disease. Neuromolecular Med. 2014; 16:405–14. https://doi.org/10.1007/s12017-014-8288-8 [PubMed]
- 18. Stamatovic SM, Martinez-Revollar G, Hu A, Choi J, Keep RF, Andjelkovic AV. Decline in Sirtuin-1 expression and activity plays a critical role in blood-brain barrier permeability in aging. Neurobiol Dis. 2019; 126:105–16. https://doi.org/10.1016/j.nbd.2018.09.006 [PubMed]
- 19. Zhang Y, Cui G, Wang Y, Gong Y, Wang Y. SIRT1 activation alleviates brain microvascular endothelial dysfunction in peroxisomal disorders. Int J Mol Med. 2019; 44:995–1005. https://doi.org/10.3892/ijmm.2019.4250 [PubMed]
- 20. Chen T, Dai SH, Li X, Luo P, Zhu J, Wang YH, Fei Z, Jiang XF. Sirt1-Sirt3 axis regulates human blood-brain barrier permeability in response to ischemia. Redox Biol. 2018; 14:229–36. https://doi.org/10.1016/j.redox.2017.09.016 [PubMed]
- 21. Chaudhuri AD, Yelamanchili SV, Marcondes MC, Fox HS. Up-regulation of microRNA-142 in simian immunodeficiency virus encephalitis leads to repression of sirtuin1. FASEB J. 2013; 27:3720–9. https://doi.org/10.1096/fj.13-232678 [PubMed]
- 22. Burudi EM, Marcondes MC, Watry DD, Zandonatti M, Taffe MA, Fox HS. Regulation of indoleamine 2,3-dioxygenase expression in simian immunodeficiency virus-infected monkey brains. J Virol. 2002; 76:12233–41. https://doi.org/10.1128/jvi.76.23.12233-12241.2002 [PubMed]
- 23. Marcondes MC, Burdo TH, Sopper S, Huitron-Resendiz S, Lanigan C, Watry D, Flynn C, Zandonatti M, Fox HS. Enrichment and persistence of virus-specific CTL in the brain of simian immunodeficiency virus-infected monkeys is associated with a unique cytokine environment. J Immunol. 2007; 178:5812–9. https://doi.org/10.4049/jimmunol.178.9.5812 [PubMed]
- 24. Marcondes MC, Burudi EM, Huitron-Resendiz S, Sanchez-Alavez M, Watry D, Zandonatti M, Henriksen SJ, Fox HS. Highly activated CD8(+) T cells in the brain correlate with early central nervous system dysfunction in simian immunodeficiency virus infection. J Immunol. 2001; 167:5429–38. https://doi.org/10.4049/jimmunol.167.9.5429 [PubMed]
- 25. Marcondes MC, Penedo MC, Lanigan C, Hall D, Watry DD, Zandonatti M, Fox HS. Simian immunodeficiency virus-induced CD4+ T cell deficits in cytokine secretion profile are dependent on monkey origin. Viral Immunol. 2006; 19:679–89. https://doi.org/10.1089/vim.2006.19.679 [PubMed]
- 26. Bortell N, Basova L, Najera JA, Morsey B, Fox HS, Marcondes MC. Sirtuin 1-Chromatin-Binding Dynamics Points to a Common Mechanism Regulating Inflammatory Targets in SIV Infection and in the Aging Brain. J Neuroimmune Pharmacol. 2018; 13:163–78. https://doi.org/10.1007/s11481-017-9772-3 [PubMed]
- 27. Cantó C, Auwerx J. Caloric restriction, SIRT1 and longevity. Trends Endocrinol Metab. 2009; 20:325–31. https://doi.org/10.1016/j.tem.2009.03.008 [PubMed]
- 28. Anderson RM, Bitterman KJ, Wood JG, Medvedik O, Sinclair DA. Nicotinamide and PNC1 govern lifespan extension by calorie restriction in Saccharomyces cerevisiae. Nature. 2003; 423:181–5. https://doi.org/10.1038/nature01578 [PubMed]
- 29. Bitterman KJ, Anderson RM, Cohen HY, Latorre-Esteves M, Sinclair DA. Inhibition of silencing and accelerated aging by nicotinamide, a putative negative regulator of yeast sir2 and human SIRT1. J Biol Chem. 2002; 277:45099–107. https://doi.org/10.1074/jbc.M205670200 [PubMed]
- 30. Ghislain M, Talla E, François JM. Identification and functional analysis of the Saccharomyces cerevisiae nicotinamidase gene, PNC1. Yeast. 2002; 19:215–24. https://doi.org/10.1002/yea.810 [PubMed]
- 31. Okabe K, Yaku K, Tobe K, Nakagawa T. Implications of altered NAD metabolism in metabolic disorders. J Biomed Sci. 2019; 26:34. https://doi.org/10.1186/s12929-019-0527-8 [PubMed]
- 32. Herranz D, Serrano M. SIRT1: recent lessons from mouse models. Nat Rev Cancer. 2010; 10:819–23. https://doi.org/10.1038/nrc2962 [PubMed]
- 33. Zanto TP, Gazzaley A. Aging of the frontal lobe. Handb Clin Neurol. 2019; 163:369–89. https://doi.org/10.1016/B978-0-12-804281-6.00020-3 [PubMed]
- 34. Solbakk AK, Fuhrmann Alpert G, Furst AJ, Hale LA, Oga T, Chetty S, Pickard N, Knight RT. Altered prefrontal function with aging: insights into age-associated performance decline. Brain Res. 2008; 1232:30–47. https://doi.org/10.1016/j.brainres.2008.07.060 [PubMed]
- 35. Nyberg L, Salami A, Andersson M, Eriksson J, Kalpouzos G, Kauppi K, Lind J, Pudas S, Persson J, Nilsson LG. Longitudinal evidence for diminished frontal cortex function in aging. Proc Natl Acad Sci USA. 2010; 107:22682–6. https://doi.org/10.1073/pnas.1012651108 [PubMed]
- 36. Camacho-Pereira J, Tarragó MG, Chini CC, Nin V, Escande C, Warner GM, Puranik AS, Schoon RA, Reid JM, Galina A, Chini EN. CD38 Dictates Age-Related NAD Decline and Mitochondrial Dysfunction through an SIRT3-Dependent Mechanism. Cell Metab. 2016; 23:1127–39. https://doi.org/10.1016/j.cmet.2016.05.006 [PubMed]
- 37. Chini EN. CD38 as a regulator of cellular NAD: a novel potential pharmacological target for metabolic conditions. Curr Pharm Des. 2009; 15:57–63. https://doi.org/10.2174/138161209787185788 [PubMed]
- 38. Huang da W, Sherman BT, Lempicki RA. Systematic and integrative analysis of large gene lists using DAVID bioinformatics resources. Nat Protoc. 2009; 4:44–57. https://doi.org/10.1038/nprot.2008.211 [PubMed]
- 39. Calvano SE, Xiao W, Richards DR, Felciano RM, Baker HV, Cho RJ, Chen RO, Brownstein BH, Cobb JP, Tschoeke SK, Miller-Graziano C, Moldawer LL, Mindrinos MN, et al, and Inflamm and Host Response to Injury Large Scale Collab. Res. Program. A network-based analysis of systemic inflammation in humans. Nature. 2005; 437:1032–7. https://doi.org/10.1038/nature03985 [PubMed]
- 40. Cline MS, Smoot M, Cerami E, Kuchinsky A, Landys N, Workman C, Christmas R, Avila-Campilo I, Creech M, Gross B, Hanspers K, Isserlin R, Kelley R, et al. Integration of biological networks and gene expression data using Cytoscape. Nat Protoc. 2007; 2:2366–82. https://doi.org/10.1038/nprot.2007.324 [PubMed]
- 41. Cerami EG, Gross BE, Demir E, Rodchenkov I, Babur O, Anwar N, Schultz N, Bader GD, Sander C. Pathway Commons, a web resource for biological pathway data. Nucleic Acids Res. 2011; 39:D685–90. https://doi.org/10.1093/nar/gkq1039 [PubMed]
- 42. Cerami EG, Bader GD, Gross BE, Sander C. cPath: open source software for collecting, storing, and querying biological pathways. BMC Bioinformatics. 2006; 7:497. https://doi.org/10.1186/1471-2105-7-497 [PubMed]
- 43. Shannon P, Markiel A, Ozier O, Baliga NS, Wang JT, Ramage D, Amin N, Schwikowski B, Ideker T. Cytoscape: a software environment for integrated models of biomolecular interaction networks. Genome Res. 2003; 13:2498–504. https://doi.org/10.1101/gr.1239303 [PubMed]
- 44. Bortell N, Morsey B, Basova L, Fox HS, Marcondes MC. Phenotypic changes in the brain of SIV-infected macaques exposed to methamphetamine parallel macrophage activation patterns induced by the common gamma-chain cytokine system. Front Microbiol. 2015; 6:900. https://doi.org/10.3389/fmicb.2015.00900 [PubMed]
- 45. Ryu JK, McLarnon JG. A leaky blood-brain barrier, fibrinogen infiltration and microglial reactivity in inflamed Alzheimer’s disease brain. J Cell Mol Med. 2009; 13:2911–25. https://doi.org/10.1111/j.1582-4934.2008.00434.x [PubMed]
- 46. Edison P. Microglial activation and blood-brain barrier leakage: chicken and egg? Brain. 2021; 144:1284–5. https://doi.org/10.1093/brain/awab149 [PubMed]
- 47. Halder SK, Milner R. Mild hypoxia triggers transient blood-brain barrier disruption: a fundamental protective role for microglia. Acta Neuropathol Commun. 2020; 8:175. https://doi.org/10.1186/s40478-020-01051-z [PubMed]
- 48. Halder SK, Milner R. A critical role for microglia in maintaining vascular integrity in the hypoxic spinal cord. Proc Natl Acad Sci USA. 2019; 116:26029–37. https://doi.org/10.1073/pnas.1912178116 [PubMed]
- 49. Guerreiro S, Privat AL, Bressac L, Toulorge D. CD38 in Neurodegeneration and Neuroinflammation. Cells. 2020; 9:471. https://doi.org/10.3390/cells9020471 [PubMed]
- 50. Piedra-Quintero ZL, Wilson Z, Nava P, Guerau-de-Arellano M. CD38: An Immunomodulatory Molecule in Inflammation and Autoimmunity. Front Immunol. 2020; 11:597959. https://doi.org/10.3389/fimmu.2020.597959 [PubMed]
- 51. Moin AS, Sathyapalan T, Diboun I, Atkin SL, Butler AE. Identification of macrophage activation-related biomarkers in obese type 2 diabetes that may be indicative of enhanced respiratory risk in COVID-19. Sci Rep. 2021; 11:6428. https://doi.org/10.1038/s41598-021-85760-y [PubMed]
- 52. Imai S, Guarente L. NAD+ and sirtuins in aging and disease. Trends Cell Biol. 2014; 24:464–71. https://doi.org/10.1016/j.tcb.2014.04.002 [PubMed]
- 53. Zhao T, Li J, Chen AF. MicroRNA-34a induces endothelial progenitor cell senescence and impedes its angiogenesis via suppressing silent information regulator 1. Am J Physiol Endocrinol Metab. 2010; 299:E110–6. https://doi.org/10.1152/ajpendo.00192.2010 [PubMed]
- 54. Chen WY, Wang DH, Yen RC, Luo J, Gu W, Baylin SB. Tumor suppressor HIC1 directly regulates SIRT1 to modulate p53-dependent DNA-damage responses. Cell. 2005; 123:437–48. https://doi.org/10.1016/j.cell.2005.08.011 [PubMed]
- 55. Wang C, Chen L, Hou X, Li Z, Kabra N, Ma Y, Nemoto S, Finkel T, Gu W, Cress WD, Chen J. Interactions between E2F1 and SirT1 regulate apoptotic response to DNA damage. Nat Cell Biol. 2006; 8:1025–31. https://doi.org/10.1038/ncb1468 [PubMed]
- 56. El-Sappah AH, Yan K, Huang Q, Islam MM, Li Q, Wang Y, Khan MS, Zhao X, Mir RR, Li J, El-Tarabily KA, Abbas M. Comprehensive Mechanism of Gene Silencing and Its Role in Plant Growth and Development. Front Plant Sci. 2021; 12:705249. https://doi.org/10.3389/fpls.2021.705249 [PubMed]
- 57. Alliot F, Godin I, Pessac B. Microglia derive from progenitors, originating from the yolk sac, and which proliferate in the brain. Brain Res Dev Brain Res. 1999; 117:145–52. https://doi.org/10.1016/s0165-3806(99)00113-3 [PubMed]
- 58. Alliot F, Lecain E, Grima B, Pessac B. Microglial progenitors with a high proliferative potential in the embryonic and adult mouse brain. Proc Natl Acad Sci USA. 1991; 88:1541–5. https://doi.org/10.1073/pnas.88.4.1541 [PubMed]
- 59. Monier A, Evrard P, Gressens P, Verney C. Distribution and differentiation of microglia in the human encephalon during the first two trimesters of gestation. J Comp Neurol. 2006; 499:565–82. https://doi.org/10.1002/cne.21123 [PubMed]
- 60. Menassa DA, Gomez-Nicola D. Microglial Dynamics During Human Brain Development. Front Immunol. 2018; 9:1014. https://doi.org/10.3389/fimmu.2018.01014 [PubMed]
- 61. Benmamar-Badel A, Owens T, Wlodarczyk A. Protective Microglial Subset in Development, Aging, and Disease: Lessons From Transcriptomic Studies. Front Immunol. 2020; 11:430. https://doi.org/10.3389/fimmu.2020.00430 [PubMed]
- 62. Rowe JW, Kahn RL. Human aging: usual and successful. Science. 1987; 237:143–9. https://doi.org/10.1126/science.3299702 [PubMed]