Altering ceramide metabolism affects oxidative stress responses and lipid abundance
Previous work has shown that C. elegans with abnormal ceramide metabolism have altered lifespans and stress response. For example, genetic manipulations leading to the loss of hyl-2/CER synthase - which makes ceramide (Figure 1A) - result in shortened lifespans, hypersensitivity to anoxia, and poor survival to heat stress [34, 38, 40]. On the other hand, genetic and pharmacological manipulations that inhibit asm-3/acid sphingomyelinase - which converts sphingomyelin to ceramide - increase lifespan [24, 25]. Here, we explored the age-related response of hyl-2 and asm-3 mutants to oxidative stress induced by juglone (JG). We found that hyl-2 mutants at both young and old ages are more sensitive to oxidative stress compared to wildtype (N2) animals. Specifically, survival of hyl-2 animals exposed to 150μM juglone decreased significantly from wildtype animals at 1 and 10 days of age (Kaplan-Meier estimate and log rank test; p=8.5e-11 and p=0.01455 respectively), while asm-3 mutants did not differ from wildtype animals at either age (p>0.05 for both; Figure 1B). hyl-2 mutants showed a similar response to paraquat (PQ) (Supplementary Figure 1).
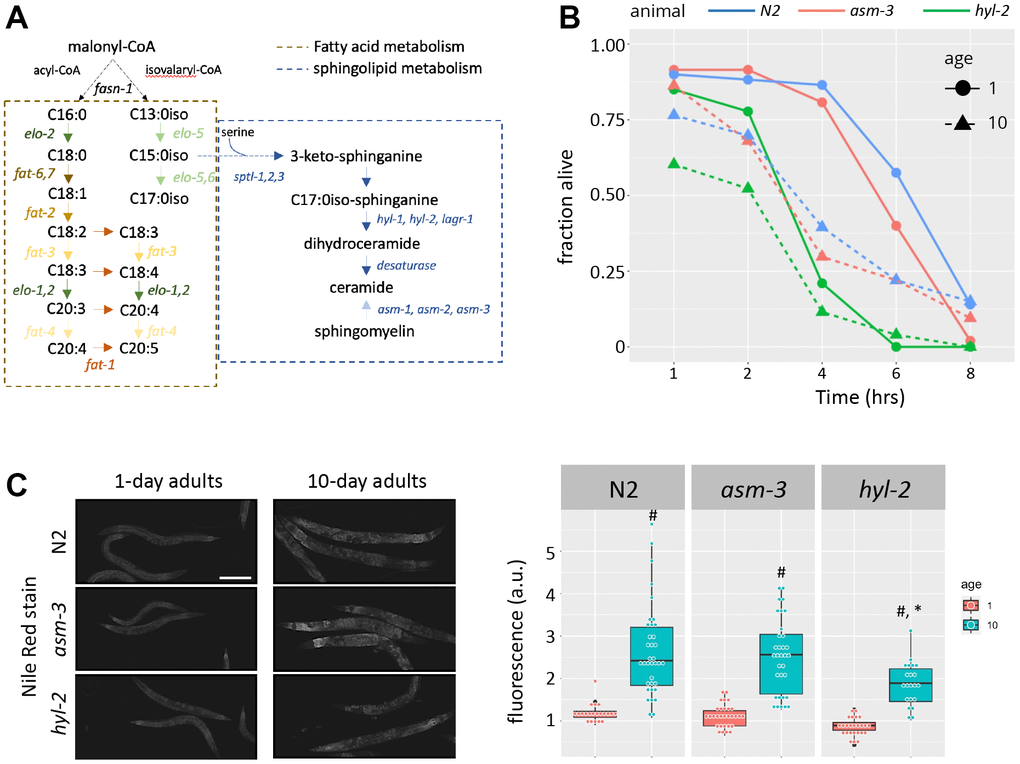
Figure 1. Loss of hyl-2/CER synthase results in poor oxidative stress responses. (A) Diagram showing the lipid pathways and metabolic enzymes producing free fatty acids (FFAs) and sphingolipids (SLs). (B) Survival of 1-, 5-, and 10-day old N2 (blue), asm-3 (red), and hyl-2 (green) worms treated with 150μM juglone. Worms were treated with juglone in 96 well plates, and survival was determined by a movement response to agitation. Survival curves were analyzed using Kaplan-Meier estimate and pairwise differences were determined using log-rank tests (n=49 for N2 1 day; n=48 for N2 10 day; n=46 for asm-3 1 day; n=35 for asm-3 10 day; n=28 for hyl-2 1 day; n=44 for hyl-2 10 day). (C) Representative images (left) and fluorescence quantification (right) of Nile Red lipid staining in 1-day and 10-day old N2, asm-3, and hyl-2 animals. #indicates p<0.05 compared to 1-day counterpart of the same genotype and *indicates p<0.05 compared to N2 counterpart of the same age.
Given the links between lipid profiles and aging, we next tested whether loss of hyl-2 or asm-3 altered lipid abundance using Nile red, a stain primarily for neutral lipids such as triglycerides, and may particularly label lysosomal related organelles [41, 42]. We found that 10-day old animals had greater Nile red staining compared to their 1-day counterparts (p<0.001 for all genotypes). Comparing across genotypes showed that 10-day hyl-2 mutants had significantly less Nile red staining than N2 animals (p=9.8e-4) but not at the 1-day timepoint (p=0.61); contrary, asm-3 animals were not statistically different from N2 on either day. These findings suggest that manipulations in ceramide metabolism may produce broad lipid changes in older animals.
Lipidomes of hyl-2 and asm-3 mutants show differential lipid changes
To explore specific lipid changes in asm-3 and hyl-2 mutants, we used a lipidomics approach to evaluate changes in specific lipid molecules and classes of lipids. Using shotgun lipidomics by electrospray ionization (ESI) and mass spectrometry, we sampled six independent replicates of 1-, 5-, and 10-day old adult worms of different genotypes. We profiled N2, asm-3, and hyl-2 animals as well as two well-studied mutant models of aging (the short-lived daf-16/FOXO mutant and the long-lived, calorically restricted eat-2/mAChR mutant). Overall, 701 lipids were identified and analyzed covering phosphatidylcholines (PC), phosphatidylethanolamines (PE), lysophosphatidylcholines (LPC), lysophosphatidylethanolamine (LPE), sphingomyelins (SM), cholesterol esters (CE), ceramides (CER), free fatty acids (FFA), diacylglycerols (DAG), and triacylglycerols (TAG). We detected significant differences in class composition between the different strains and age groups compared to 1-day old N2 adults (Supplementary Figure 2). Interestingly, TAG increased in 10-day old animals compared to 1-day old animals in N2, daf-16, and hyl-2 animals. However, this increase was not observed in long-lived eat-2 or asm-3 animals. Overall, we found that our samples had 12.1% FFA, 26.1% TAG, 2.0% DAG, 35.0% PEs, and 16.0% PCs, which is somewhat comparable to that observed in yolk (16.2%, 26.4%, 3.2%, 28.2% and 23%, reference [43]). However, lipid composition is likely to vary by technique and tissue preparation [44].
To visualize how age affects lipidome changes, we first examined how well lipidomes clustered by age or genotype using principal components analysis (PCA). For this analysis, raw concentrations of each lipid were log2 transformed and analyzed. We found that within each genotype, animals from each age group clustered most closely with animals from the same age group (Figure 2A–2F). This suggests that age is a major driver of lipid profiles regardless of genotype. Interestingly, when analyzing the PCA plots by age, genotypes appear to cluster more closely at 1-day, except daf-16 mutants which appear to cluster away from the rest (Figure 2G, 2H). This visual representation suggests that as animals age, their lipid profile may become more distinct by genotype. Thus, we performed more detailed analysis of specific changes.
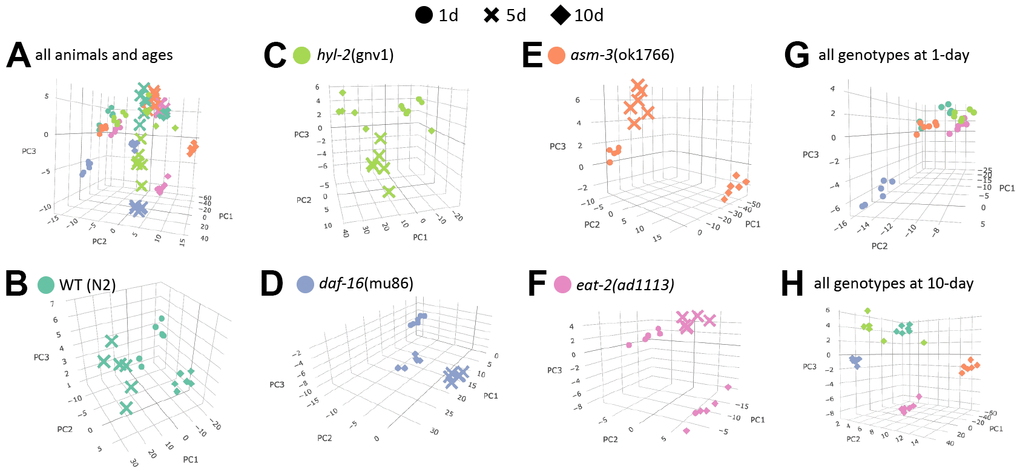
Figure 2. Age is a major determinant of lipid profiles in C. elegans. Principal component analysis (PCA) graphs show lipid profiles by 1-day (circles), 5-day (cross bars), and 10-day (diamonds). (A) PCA graph showing variation all groups, by strain and age. (B–F) PCA graphs showing variations in age by strain (different colors as indicated). (G–H) PCA graphs showing variations by 1-day old animals (G) and 10-day old animals (H).
Next, we determined whether age affected the lipidome within specific classes of lipids. To do this, we visualized lipid concentrations through heatmaps of free fatty acids (FFA) in N2, asm-3, and hyl-2 mutants (Figure 3A). Wildtype N2 animal show decreases in many shorter chained FFAs, particularly saturated FFA. The largest decreases were in FFA(20:0) (log2FC = -2.6, FDR=1.60e-15), FFA(18:0) (log2FC = -2.5, FDR=2.61e-19) (Supplementary Tables 2, 5). This observation is more pronounced in asm-3 mutants. However, hyl-2 mutants show increases in FFA of most types from 1 to 10 days, including many of shorter chained saturated and unsaturated FFAs; this is similar to the short-lived daf-16 mutant. Interestingly, long-lived eat-2 and daf-2 mutants have been shown to have lower amounts of shorter chained fatty acids (C14:0 - C20:0) [6], suggesting that shorter chain FA may contribute to aging. However, very long chain polyunsaturated FFAs increase with age in wildtype animals (Figure 3 and Supplementary Tables 2, 5). The largest changes of FFA from 1 day to 10 day N2 were in polyunsaturated FFA(20:2) (log2FC = 2.3, FDR=1.99e-34) and FFA(22:5) (log2FC = 1.30, FDR=1.75e-14). Interestingly, asm-3 mutants exhibit increases in many of the longer chained FFAs at 10 days compared to 1 day (Figure 3A and Supplementary Tables 3, 8).
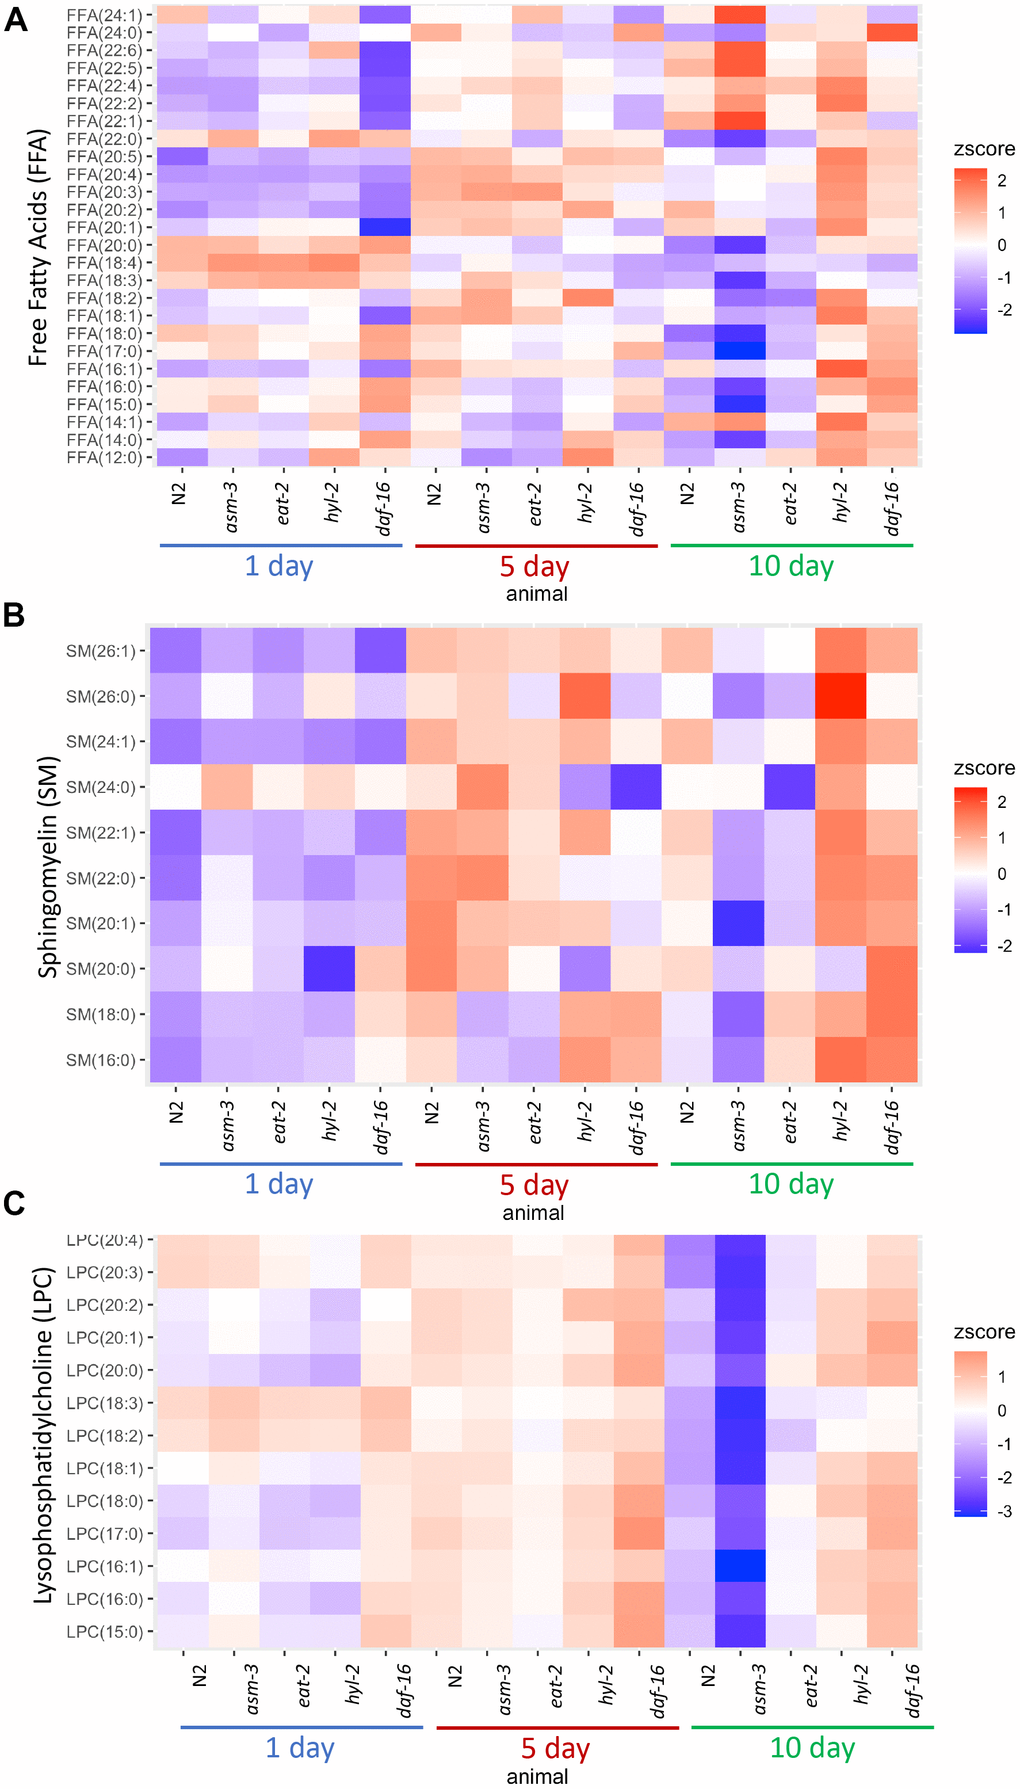
Figure 3. Lipid profiles vary by age and genotype. Heatmaps showing average z-score of log2 concentration for (A) free fatty acids (FFA), (B) sphingomyelins, and (C) lysophosphatidylcholines (LPCs). For sphingomyelins, the lipid ID does not include the 18:1 fatty acid chain, and LIPIDMAPS nomenclature is reported in Supplementary Table 11. Wildtype, asm-3, eat-2, hyl-2, and daf-16 worms were analyzed at 1-, 5- and 10-days old. For all, the heatmaps show averaged z scores for the six replicates in each group.
We then examined sphingomyelin (SM) profiles and found that, in general, SMs increase with age in N2 animals (Figure 3B and Supplementary Figure 3). This was also found by Cutler et al. (2014) that analyzed SM levels from egg to 11-day adults [25]. However, our analysis was different as we did not directly examine the d17:1 iso-sphingoid base that is most prominent in C. elegans [45]. Of the SMs we identified, we found that asm-3 mutants had higher total SMs compared to N2 at 1 day (p=0.03) but then was lower at 10 days compared to N2 (p<0.00001). In C. elegans, there are three acid sphingomyelinases genes (asm-1, 2, 3) and an uncharacterized neutral sphingomyelinase (T27F6.6). However, their adult expression patterns are unknown, and therefore, the different enzymes may differentially contribute to sphingolipid metabolism and total sphingomyelin levels throughout the worm’s life. Indeed, asm-1, asm-2, and asm-3 knockdown by RNAi lead to small increases in lifespan independently, and asm-1 and asm-2 knockdown by RNAi can further increase lifespan of asm-3 mutants [24].
Of the SMs we observed, which are more similar to mammalian SMs, the largest increases observed in N2 animals from 1-day to 10-day adults are in several monosaturated sphingomyelins, specifically SM(24:1) (log2FC = 2.6, FDR=2.43e-28), SM(22:1) (log2FC = 1.9, FDR=4.54e-10) and SM(26:1) (log2FC = 1.6, FDR=2.10e-8). Intriguingly, SM(24:1) abundance is low at 1-day in both N2 and hyl-2 mutants, and increases at both 5 and 10-days. However, in asm-3 mutants, SM(24:1) abundance is low at 1-day, increases at 5-days, and then decreases again at 10-days. Furthermore, asm-3 mutants exhibit different 10-to-1 day changes compared to N2; for example, whereas N2 show increases in the saturated sphingomyelins SM(16:0), SM(18:0), SM(22:0), asm-3 show decreases (Supplementary Tables 3, 8). Interestingly, the saturated sphingomyelins SM(16:0) (log2FC=1.9, FDR=2.38e-8), SM(18:0) (log2FC=1.3, FDR=0.026), and SM(22:0) (log2FC=0.47, FDR=0.0293) show even greater increases from 1 to 10 days in hyl-2 mutants than N2. Given the role of SMs on membrane fluidity, these age dependent changes may affect membrane properties in asm-3 and hyl-2 mutants that affect cell physiology.
To explore specific lipid changes associated with age, we next examined fold changes of each lipid molecule using volcano plots, plotting their concentration to their false discovery rate (FDR, or adjusted p value). Those lipids with greater than a 4-fold change (log2 FC > 2) are highlighted in Figure 4 (and Supplementary Tables 2–9). First, we examined changes in 10-day old N2 animals compared to 1-day old animals (10d/1d; Figure 4A); many of the lipids that are lower at 10 days compared to 1 day were LPCs, whereas many of the lipids that were higher at 10 days were triacylglycerols (Figure 4A). When examining changes in 5-day old N2 animals compared to 1-day animals, we observed similar changes in triacylglycerols, but not LPCs (Figure 4B). Next, we compared lipidomes of 10-day old animals of hyl-2, asm-3, daf-16, and eat-2 backgrounds to that of wildtype 10-day animals (Figure 4C–4F). Strikingly, the lipid changes in asm-3 to N2 were similar to that of the long-lived eat-2 to N2. Most of the highly significant changes were found to be lower levels of TAGs. Indeed, eat-2 animals exhibit reduced TAG levels by Nile Red, Oil red O, and Sudan black staining, as well as gas chromatography [46, 47]. On the other hand, the profile of lipid changes in hyl-2 to N2 was similar to that of the short-lived daf-16 to N2. Both 10-day old hyl-2 and daf-16 showed increases in LPCs compared to 10-day wildtype, sharing many common LPCs including LPC(16:1), LPC(18:3) and LPC(20:0).
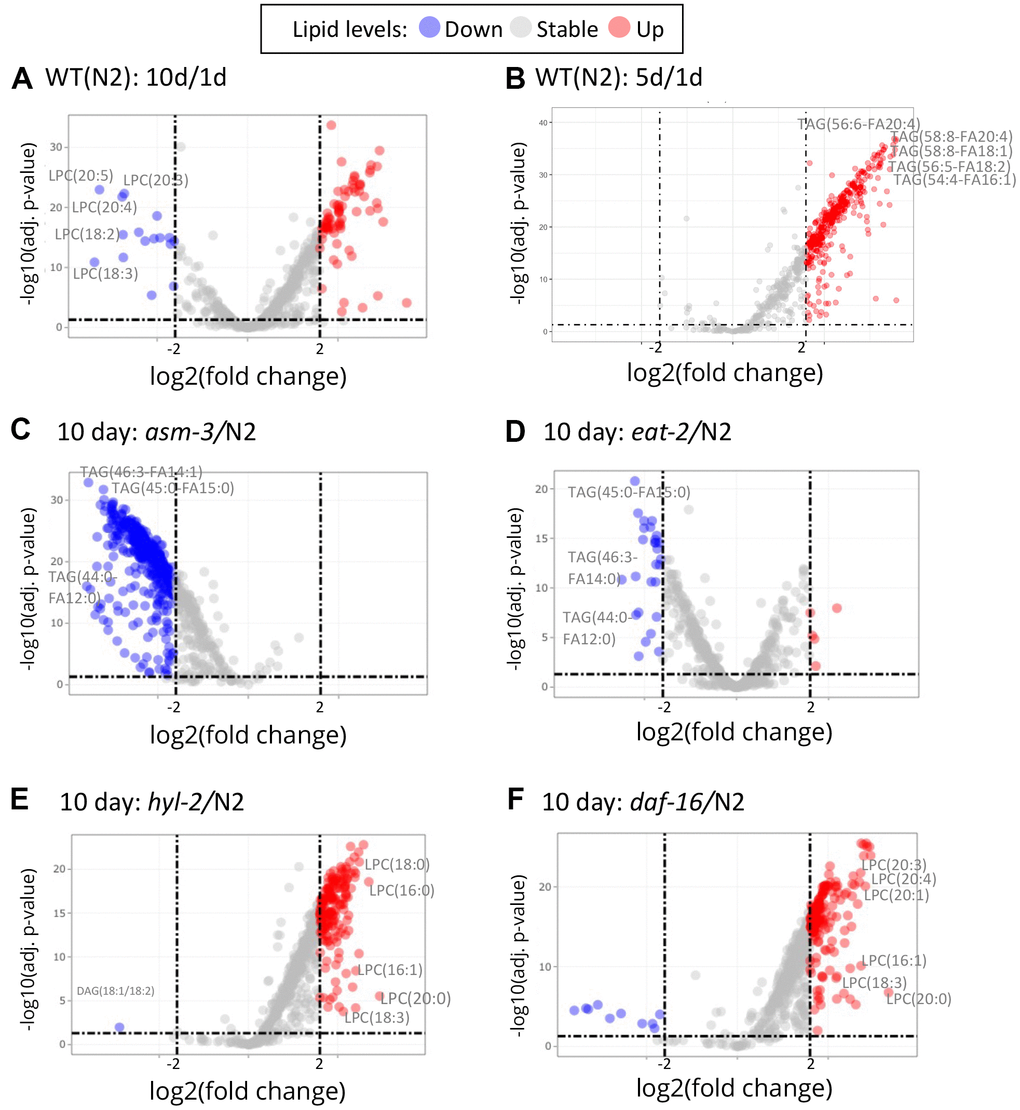
Figure 4. Volcano plots show that specific lipids change by age and genotype. Log2 fold changes between groups are graphed by adjusted P values. Red indicates a greater than 2 log2 fold increase of specific lipid, and blue indicates greater than -2 log2 fold decrease (dashed lines). (A) Comparison of 10-day old N2 animals versus 1-day old N2 animals (10d/1d). 10-day old N2 animals have many decreased LPCs compared to 1-day. (B) Comparison of 5-day old N2 animals versus 1-day old N2 animals. (C) Comparison of 10-day old asm-3 animals versus 10-day old N2 animals. (D) Comparison of 10-day old eat-2 animals versus 10-day old N2 animals. (E) Comparison of 10-day old hyl-2 animals versus 10-day old N2 animals. (F) Comparison of 10-day old daf-16 animals versus 10-day old N2 animals.
Given the changes in LPCs, we visualized differences in LPC levels across all animals in a heatmap (Figure 3C). We find that asm-3 and eat-2 show normal levels of LPCs at younger ages, but have much lower levels of LPCs at 10-days old. On the other hand, hyl-2 and daf-16 show increased LPC levels at younger and older ages. In humans, elevated levels of LPCs in circulating low density lipoprotiens (LDLs) are associated with disease [48], and elevated LPC levels are observed in stress conditions, particularly inflammatory disease [49].
Saturated and unsaturated fatty acid changes in hyl-2/CER synthase and daf-16/FOXO mutants
Fatty acid chain desaturation has been of interest in aging because polyunsaturated fatty acids (PUFAs) may be more susceptible to oxidation and cellular damage, suggesting that high levels of PUFAs may be detrimental to health. Indeed, older animals have a decreased monosaturated fatty acid to polyunsaturated fatty acid (MUFA:PUFA) ratio, suggesting that there are more PUFAs, or less MUFAs, with age; in addition, long-lived animals generally have a higher MUFA:PUFA ratio compared to short-lived animals [35, 36, 50]. We analyzed TAG and FFA and found that the MUFA:PUFA ratio declined in older ages for all genotypes (Figure 5A). However, when we analyzed total PUFAs, we found that both hyl-2 and daf-16 mutants had higher amounts of PUFAs than 10-day N2 animals (Figure 5B, 3.46 fold and 3.22 fold, p<1.0e-7 respectively). Both hyl-2 and daf-16 had PUFA levels at 1 day comparable to N2, but PUFA levels continued to increase significantly at each timepoint. Both asm-3 and eat-2 had non-significant changes at 10 days compared to N2. The changes in MUFA:PUFA ratio in older animals was not observed when we analyzed saturation levels in PC and PE (Figure 5B). However, we did find that hyl-2 and daf-16 mutants also had increased amounts of saturated lipids found in PC and PE (Figure 5D, 3.96 fold, and 5.28 fold increase respectively; p<1.0e-7 for both).
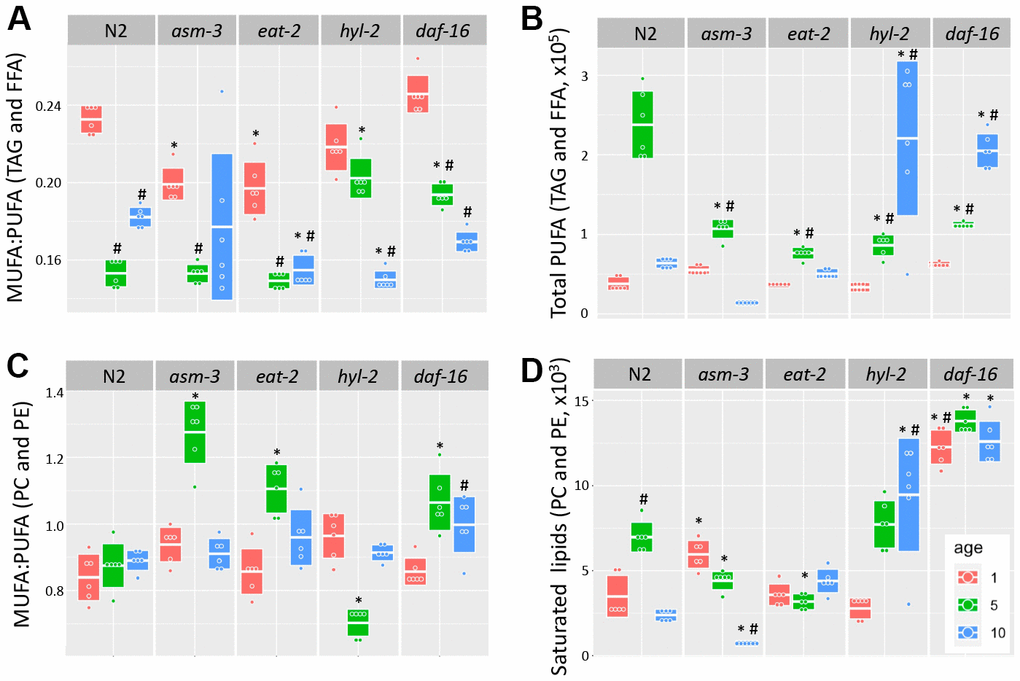
Figure 5. Analysis of acyl chain saturation during young and old asm-3 and hyl-2 mutants. Chain saturation was analyzed and compared between 1-day (red), 5-day (green), and 10-day (blue) old N2, asm-3, eat-2, hyl-2, and daf-16 animals. Total (A) MUFA:PUFA ratios in TAG and FFA, (B) total polyunsaturated chains in in TAG and FFA, (C) MUFA:PUFA ratios in PC and PE, and (D) saturated PC and PE were summed for each group (n=6). Boxes in graphs represent the middle quartile for the data points in each group. For all, # indicates p<0.05 compared to 1-day counterpart and * indicates p<0.05 compared to N2 counterpart.
Metabolic enzymes that produce elongated and desaturated fatty acids (Figure 1A) have been implicated in lifespan regulation [1, 13, 17, 31, 50]. Thus, we next explored whether aging affects gene expression of key enzymes in fatty acid lipid metabolism. Fatty acid metabolism starts with the fatty acid synthase FASN-1, which modifies malonyl-CoA to generate either C16 straight chain fatty acids by using Acetyl-CoA, or C13iso-branched fatty acid by using isovalaryl-CoA. From there, C16:0 can be elongated by fatty acid elongases or desaturated by fatty acid desaturases. We examined by qPCR whether elongases or desaturates are regulated by age or by mutations in hyl-2 and asm-3. We found that two fatty acid elongases (elo-1 and elo-2) did not change when comparing 1-day and 10-day old animals of any genotype (Figure 6A and Supplementary Table 10). When then analyzed fatty acid desaturases in the pathway (fat-1, fat-2, fat-4, fat-6, and fat-7). We found that 10-day old animals of all genotypes have very low expression of fat-7, which is a FA desaturase that converts FFA(18:0) to FFA(18:1). We did not observe changes in fat-6 expression or other fatty acid desaturases examined.
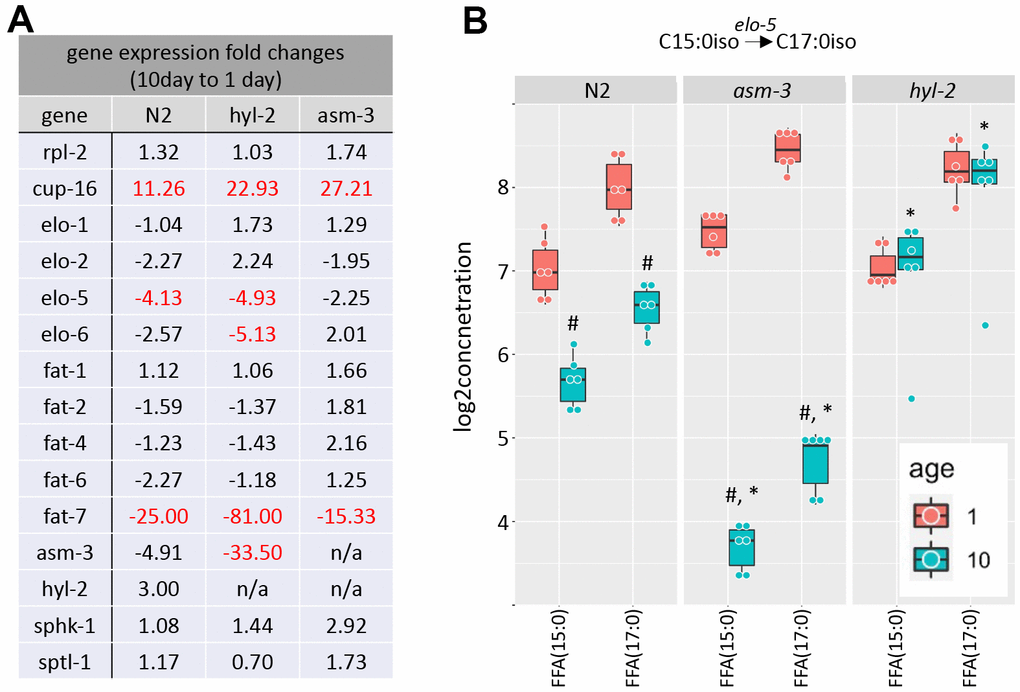
Figure 6. Saturated and polyunsaturated fatty acids metabolism. (A) Table of gene expression for fatty acid for elongases and desaturates examined in 1-day and 10-day old N2, asm-3, and hyl-2 animals by quantitative PCR. Data are represented by 2-ddCT fold change of 10-day N2 compared to 1-day values (n=3 for each group, red indicates fold changes that are p<0.01). The reference gene was rps-2, and rpl-2 and cup-16 are control genes known to remain unchanged and increase, respectively, in older animals. (B) Log2 concentrations of FFA(15:0) and FFA(17:0) are shown at 1- and 10-day old N2, asm-3, and hyl-2 animals (n=6 for each group). For all, #indicates p<0.05 compared to 1-day counterpart of the same genotype. *indicates p<0.05 compared to N2 counterpart of the same age.
C13:0iso-branched fatty acid leads to the synthesis of monomethyl branched chain fatty acids (mmBCFA), which are involved in growth and survival [51, 52]. ELO-5 and ELO-6 specifically transfer acyl groups to C13iso and C15iso fatty acids [51, 53]. We examined whether there were gene expression changes in elo-5 and elo-6 in 1- and 10-day old N2, hyl-2, and asm-3 animals. Interestingly, elo-5 showed significant decreases in wildtype and hyl-2 animals, and non-significant changes in asm-3 animals (Figure 6A). hyl-2 further shows significant downregulation of elo-6. The downregulation of elo-5 in N2 and asm-3 animals may contribute to the lower levels of FFA(17:0) (Figure 6B). However, it is not clear why hyl-2 mutants exhibit low expression of elo-5 and elo-6 despite sustained levels of FFA(17:0). It is possible some feedback mechanisms exist to decrease their expression, or that early steps in mmBCA synthesis are increased to affect sphingolipid metabolism in hyl-2. Indeed, many sphingomyelin species are higher in 10-day old hyl-2 mutants (Figure 3B) compared to both 1-day hyl-2 or N2 animals.
We found that the lipid levels of the FFA(15:0) and FFA(17:0) is increased in 10-day hyl-2 (log2FC=1.28, p=1.66e-10; Figure 6B) and daf-16 (log2FC=2.55, p=2.50e-23) mutants compared to N2. On the other hand, asm-3 animals showed decreases in FFA(15:0) and FFA(17:0) (log2FC=-1.98, p=1.10e-18) (Figure 6B). We were interested in whether the differences in these chains are also observed in triacylglycerols (TAGs). When analyzing FA15:0 and FA17:0 chains that are part of TAGs in asm-3 animals, we found that they also exhibited decreased TAGs containing FA15:0 and FA17:0 at 10-day compared to 1-day; hyl-2 mutants showed a general increase in in these TAGs compared to N2, but not in either specific day (Supplementary Figure 4). Although our lipidomics detection could not identify the iso-branched species specifically, this suggests that hyl-2 might have higher mmBCFAs at older ages, whereas asm-3 mutants have lower.
To determine whether sphingolipid metabolism itself is altered by age, we examined key enzymes in the production of sphingolipids from mmBCFAs. The mmBCFA C15iso and C17iso fatty acids can be made into C17iso-sphinganine or its precursors through serine palmitoyl transferase (sptl-1) in C. elegans (Figure 1A) [54, 55]. We found that sptl-1/serine palmitoyltransferase does not change with age or strain (Figure 6A). The addition of fatty acid to C17iso-sphinganine to make dihydroceramide is mediated by hyl-2, as well as other ceramide synthases (Figure 1A). hyl-2 specifically transfers fatty acids of shorter chains (C20-22) [40]. We further explored gene expression changes of hyl-2 and asm-3 itself, and found that asm-3 showed a trend to decrease in N2 animals at 10-days compared to 1-day (Figure 6A). However, we observed that, in general, asm-3 had low expression in all genotypes at 10-days. Interestingly, there was a large 10-day to 1-day decrease in asm-3 expression observed in hyl-2 animals. Thus, it is possible that hyl-2 animals, and old animals in general, have reduced breakdown of sphingomyelin at older ages that contribute to their poor stress response and reduced lifespan. However, given that asm-3 mutants have increased lifespan, it is not clear how reduced asm-3 expression at later ages may specifically modify aging processes differently than complete knockouts. Together, these data support a model where increased abundance of sphingolipid precursors and sphingomyelin may contribute to poor aging phenotypes. Indeed, our findings support lipidomic analyses of human longevity suggesting that centenarians upregulate mechanisms to upregulate sphingomyelins to ceramide-containing glycosphingolipids [56, 57].