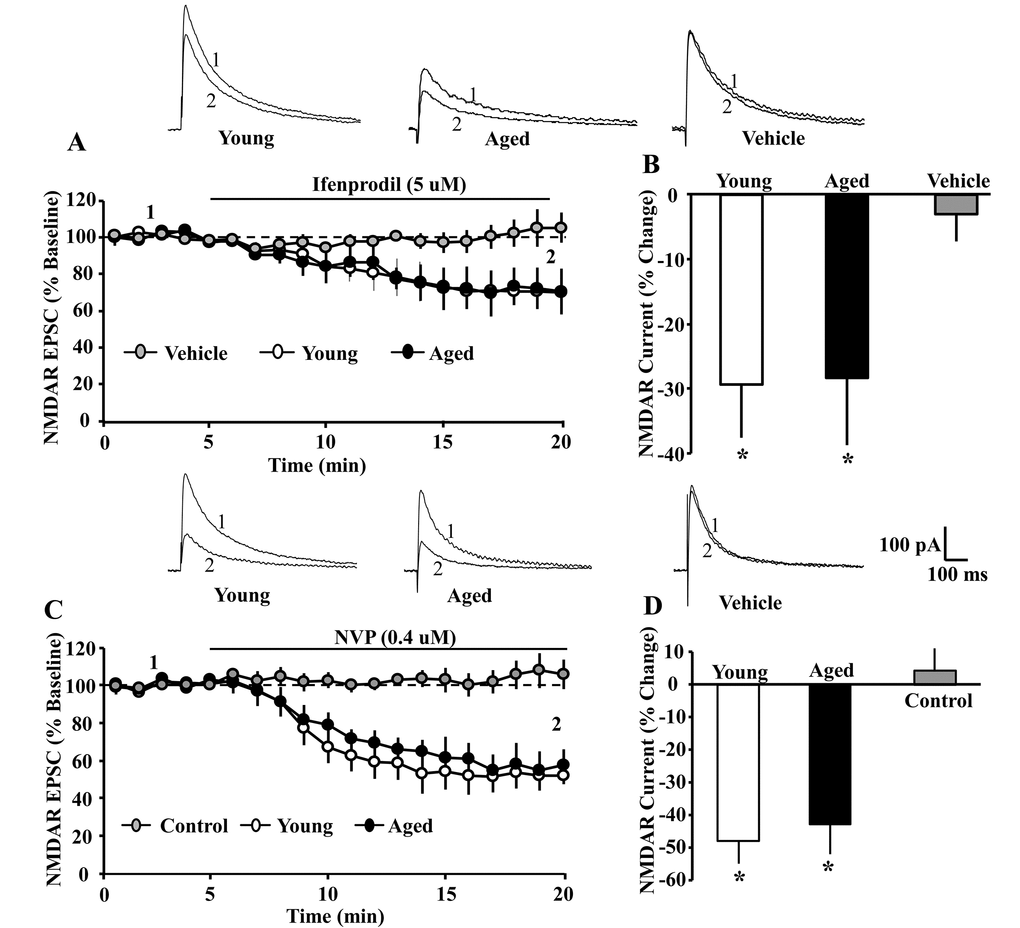
Figure 2.The GluN2A and GluN2B selective antagonists attenuated the NMDAR EPSC amplitude to a similar extent in young and aged CA1 pyramidal neurons. For each cell, the peak response was normalized to the 5 min pre-drug baseline. (A) Time course of the decrease in the NMDAR EPSCs recorded from CA1 hippocampal pyramidal neurons 5 min before and 15 min after bath application of ifenprodil (5 µM, solid line) in young (open circle, n = 4/4 cells/animals) and aged (filled circle, n = 6/5 cells/animals) animals. For the control condition (gray circle, n = 7/6 cells/animals, young-aged combined) recordings were obtained before and after application of ethanol vehicle. (B) Bar graph demonstrates percentage decrease in NMDAR EPSCs for young and aged animals following application of ifenprodil or vehicle. Asterisks indicate a significant difference from baseline. The top panel provides representative traces illustrating the NMDAR EPSC at baseline (1) and at the end of a 15 min of ifenprodil application (2) recorded from a young (left) or aged (middle) cell, and for a cell recorded in the vehicle control condition (right). The GluN2A selective antagonist, NVP, attenuated the NMDAR EPSC to a similar extent in young and aged CA1 pyramidal neurons. For each cell, the peak response was normalized to the 5 min pre-drug baseline. (C) Time course of the decrease in the NMDAR EPSCs recorded from CA1 hippocampal pyramidal neurons 5 min before and 15 min after bath application of NVP (0.4 µM, solid line) in young (open circle, n = 4/4 cells/animals) and aged (filled circle, n = 5/5 cells/animals) animals. For the control condition (gray circle, n = 6/6 cells/animals, young-aged combined) recordings were maintained for the same duration in the absence of NVP application. (D) Bar graph demonstrates percentage decrease in NMDA EPSCs during the last 5 min of recording. Asterisks indicate a significant difference from baseline. Representative traces on the top illustrating the NMDAR EPSC at baseline (1) and at the end of a 15 min NVP application (2) recorded from a young (left) or aged (middle) cell, and for a cell in the control condition (right).