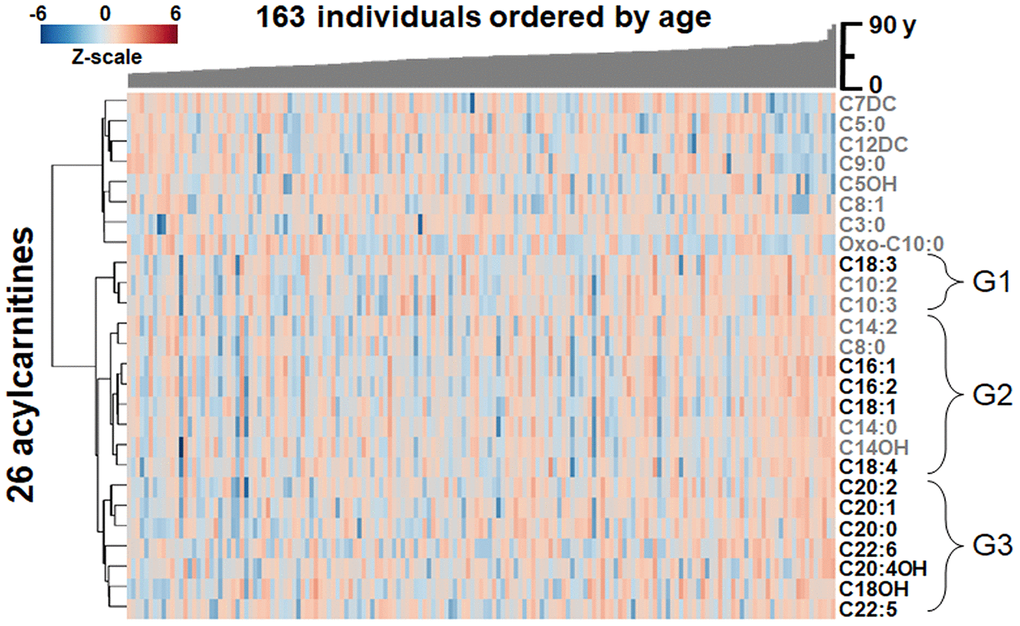
Figure 3.Heat map of one-way hierarchical clustering analysis (HCA) of the 26 acylcarnitines significantly associating with age. Along the x-axis, individuals are organized by age, with youngest on the left. The y-axis is comprised of the one-way HCA of acylcarnitines. Each column represents an individuals’ metabolic profile of the 35 acylcarnitines. Degree of deviation of acylcarnitine concentration below the mean of the study population are indicated by saturation of blue coloration, and degree of deviation of acylcarnitine concentration above the mean of the study population are indicated by saturation of red coloration. Short-chain and medium-chain acylcarnitines are labeled in gray, and long-chain and very-long-chain acylcarnitines are highlighted by labeling in black. For acylcarnitines detected on both C18 and anion exchange columns, only the C18 data was included in the HCA. The lower major acylcarnitine cluster is labeled by its subgroups, G1-3.