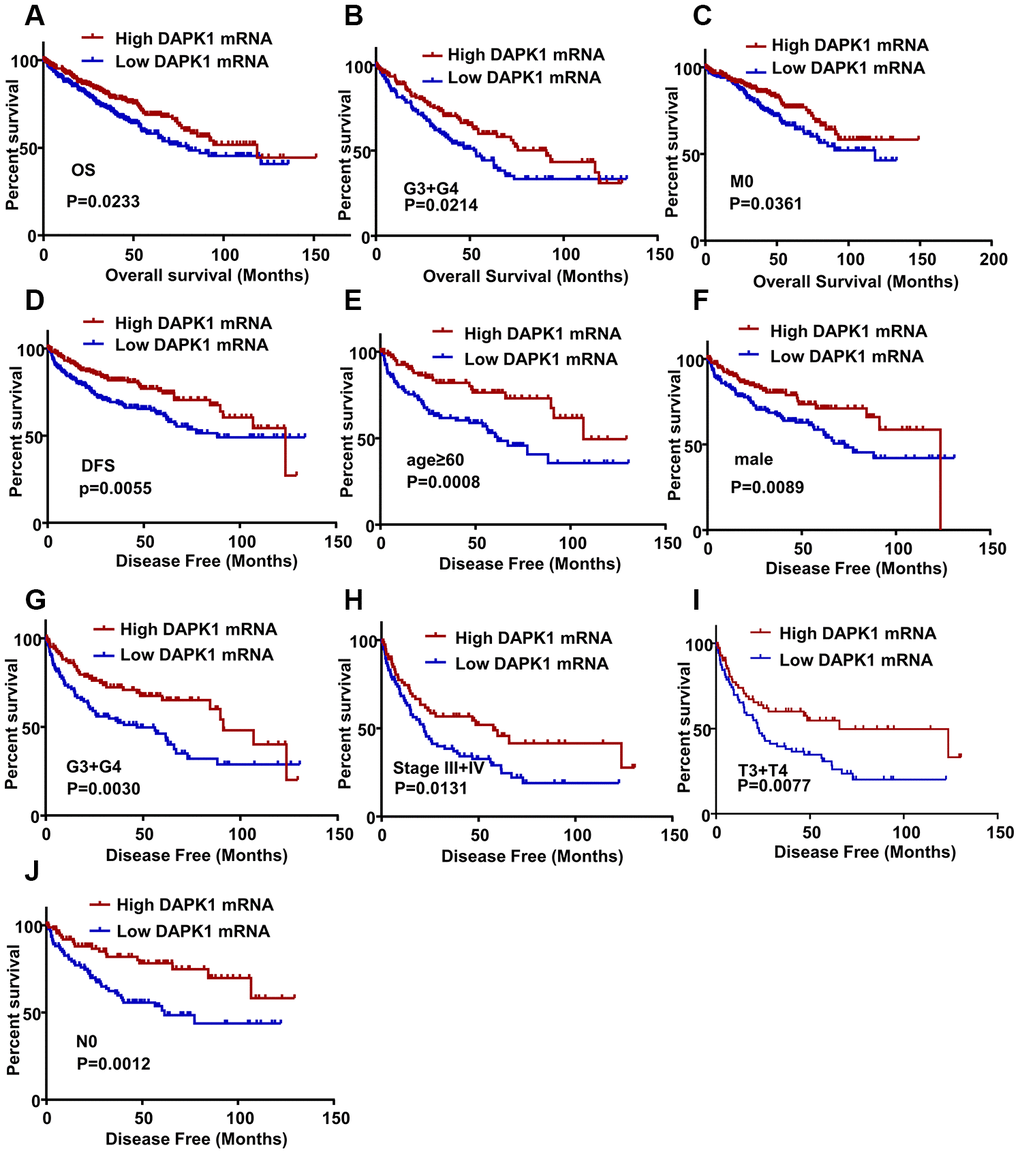
Figure 2.DAPK1 expression correlates with OS and DFS of ccRCC patients. (A) Kaplan-Meier survival curve analysis shows the overall survival (OS) rates of ccRCC patients with low and high DAPK1 expression. (B, C) Kaplan-Meier survival curve analysis shows OS of ccRCC patients belonging to (B) G3 + G4 tumor grades and (C) M0 stage tumors based on low or high DAPK1 expression. (D) Kaplan-Meier survival curve analysis shows disease-free survival (DFS) rates of ccRCC patients with low or high DAPK1 expression. (E–J) Kaplan-Meier survival curve analysis shows DFS rates based on low or high DAPK1 expression in different patient subgroups, including (E) age ≥ 60 y, (F) male, (G) G3 + G4 stage (H) pathologic stages III + IV, (I) T3 + T4 stage, and (J) N0 stage.