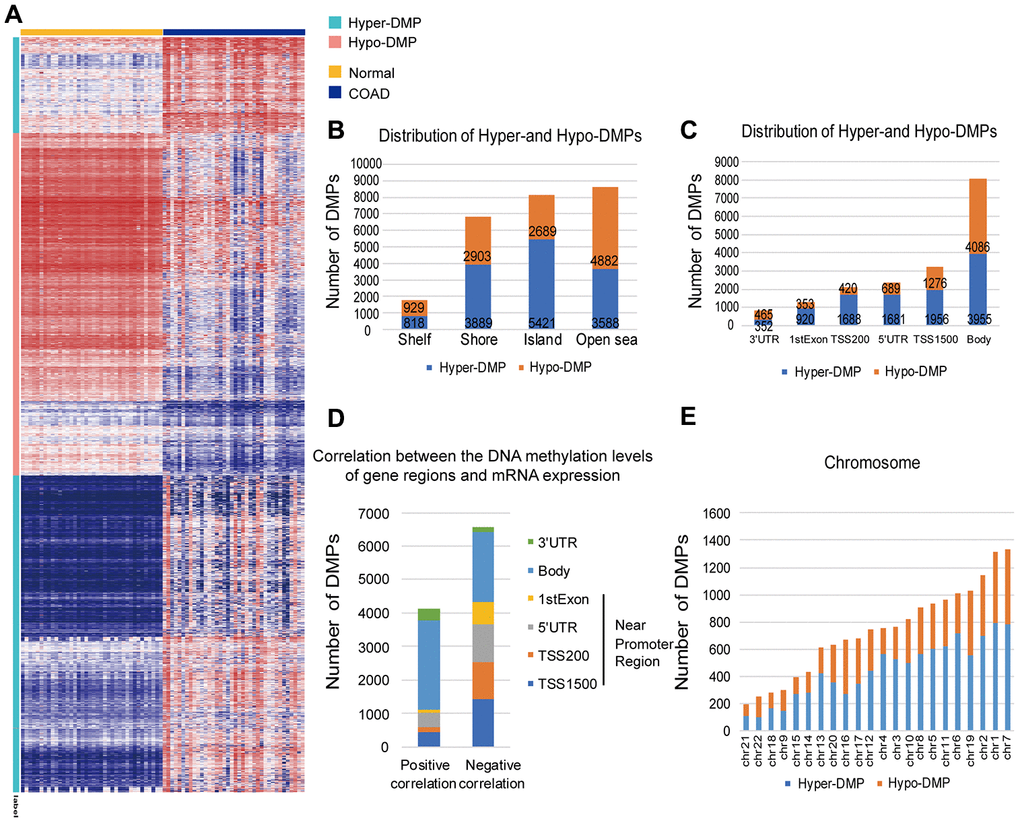
Figure 2.Distribution of DMPs. (A) Unsupervised hierarchical clustering and heat map display of the methylation levels of the Hyper- and Hypo-DMPs in 25 paired COAD and normal samples from TCGA. (B) The distribution of Hyper-DMPs and Hypo-DMPs in different genomic region types. Island, a CpG site located within a CpG island; Shore, a CpG site located < 2 kilobases from a CpG island; Shelf, a CpG site located > 2 kilobases from a CpG island; Open sea, a CpG site not in an island or annotated gene. (C) The numbers and ratios of Hyper-DMPs and Hypo-DMPs according to their distance from the promoter. TSS1500, 200-1500 base pairs upstream of the transcription start site; TSS200, 200 base pairs upstream of the transcription start site; 5′UTR, 5′ untranslated region; 1st Exon, exon 1; 3′UTR, 3′ untranslated region. (D) The positional distribution (in terms of promoter distance) of the DMPs in which the methylation level correlated positively or negatively with the expression of the corresponding gene (FDR < 0.05). (E) Chromosome distribution of Hyper-DMPs and Hypo-DMPs. Chr: chromosome.