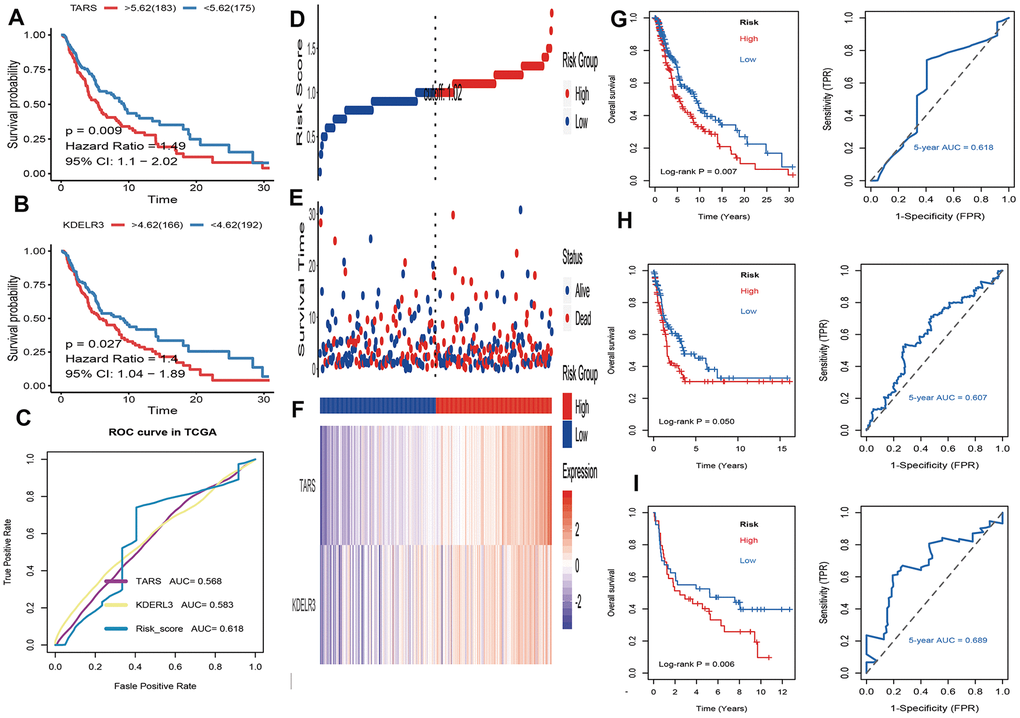
Figure 4.Identification and validation of prognostic UPRRGs features for survival prediction. (A) Kaplan–Meier analysis between patients in the high expression level of TARS and those in the low expression level group. (B) Kaplan–Meier analysis between patients in the high expression level of KEDLR3 and those in the low expression level group. (C) The receiver operating characteristic (ROC) curves of TARS, KEDLR3 and risk score indicators. (D) The distribution of risk score. the risk scores are arranged in ascending order from left to right. (E) Overall survival (OS) time and life status. (F) The prognostic UPRRGs features expression patterns for melanoma patients in TCGA dataset. (G) Kaplan–Meier analysis of UPRRGs features and 5 years of the receiver operating characteristic (ROC) curve in TCGA dataset. (H) Kaplan–Meier analysis of UPRRGs features and 5 years of the receiver operating characteristic (ROC) curve in GSE65904 dataset. (I) Kaplan–Meier analysis of UPRRGs features and 5 years of the receiver operating characteristic (ROC) curve in GSE54467 dataset.