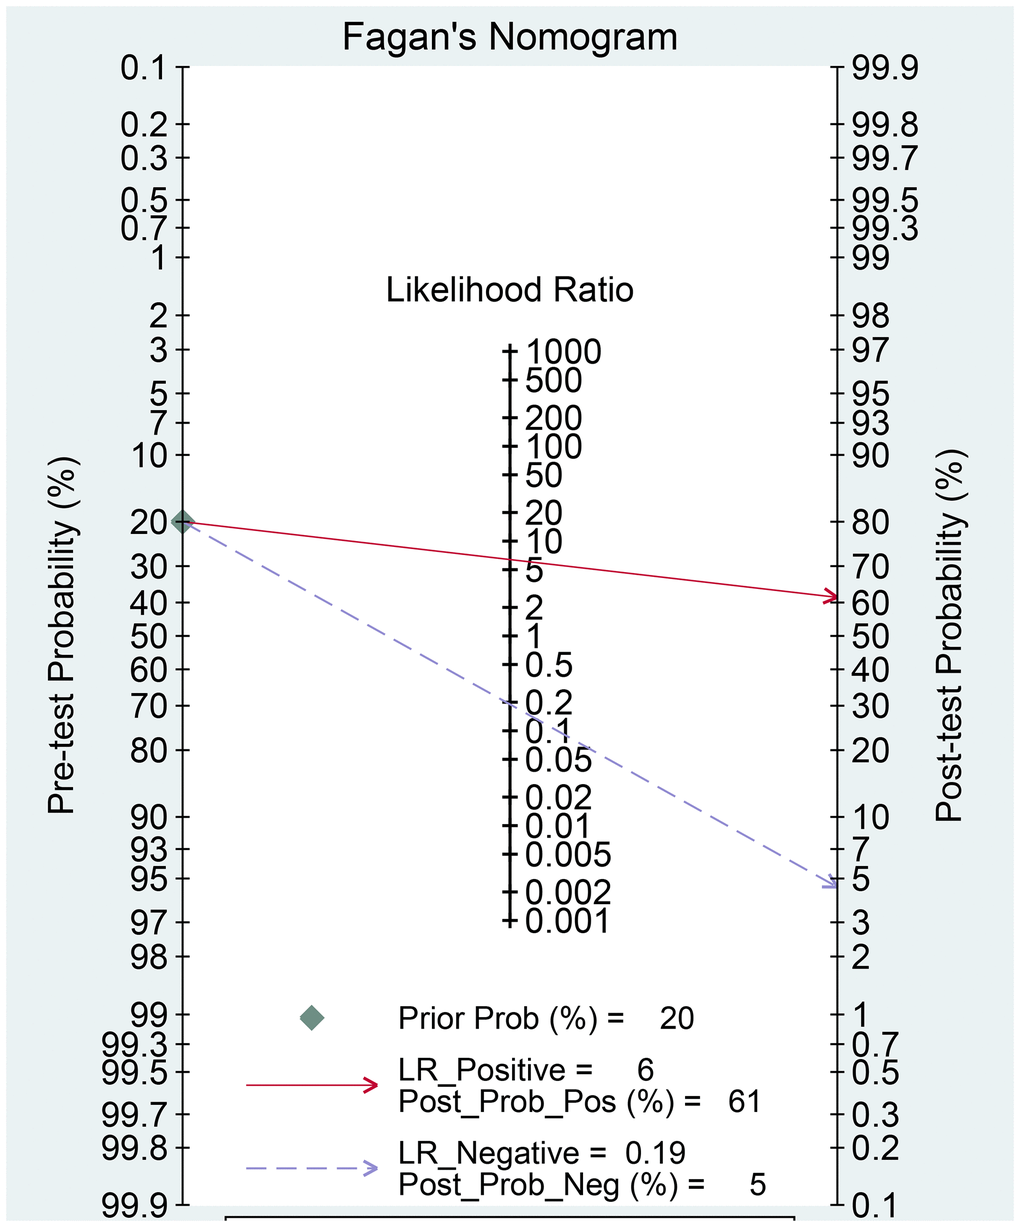
Figure 7.Fagan diagram evaluating the overall diagnostic value of high b-value for detecting prostate cancer.
Figure 7 — Diagnostic accuracy of high b-value diffusion weighted imaging for patients with prostate cancer: a diagnostic comprehensive analysis | Aging