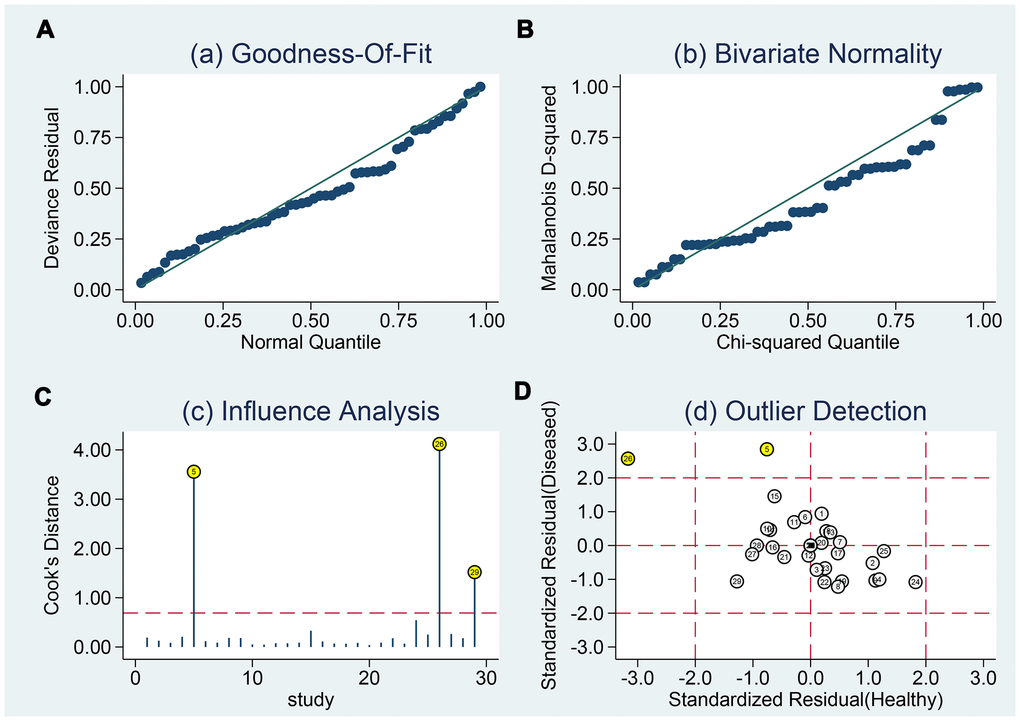
Figure 9.Sensitivity analyses. Graphical depiction of residual based goodness-of-fit (A), Bivariate normality (B), and influence (C) and outlier detection (D) analyses.
Figure 9 — Diagnostic accuracy of high b-value diffusion weighted imaging for patients with prostate cancer: a diagnostic comprehensive analysis | Aging