Submit an Article
Navigate
Home
Editorial Board
Editorial Policies
Current Volume
Archive
Scientific Integrity
Publication Ethics Statements
Interviews with Outstanding Authors
Newsroom
Sponsored Conferences
Podcast
Contact
Special Collections
Submit an Article
Online ISSN: 1945-4589
Research Paper
|
Volume 13, Issue 12
|
pp. 16749–16762
Bone mesenchymal stem cell derived exosomes alleviate high phosphorus-induced calcification of vascular smooth muscle cells through the NONHSAT 084969.2/NF-κB axis
Back to article
Figure 9
(9 of 9)
−
100%
+
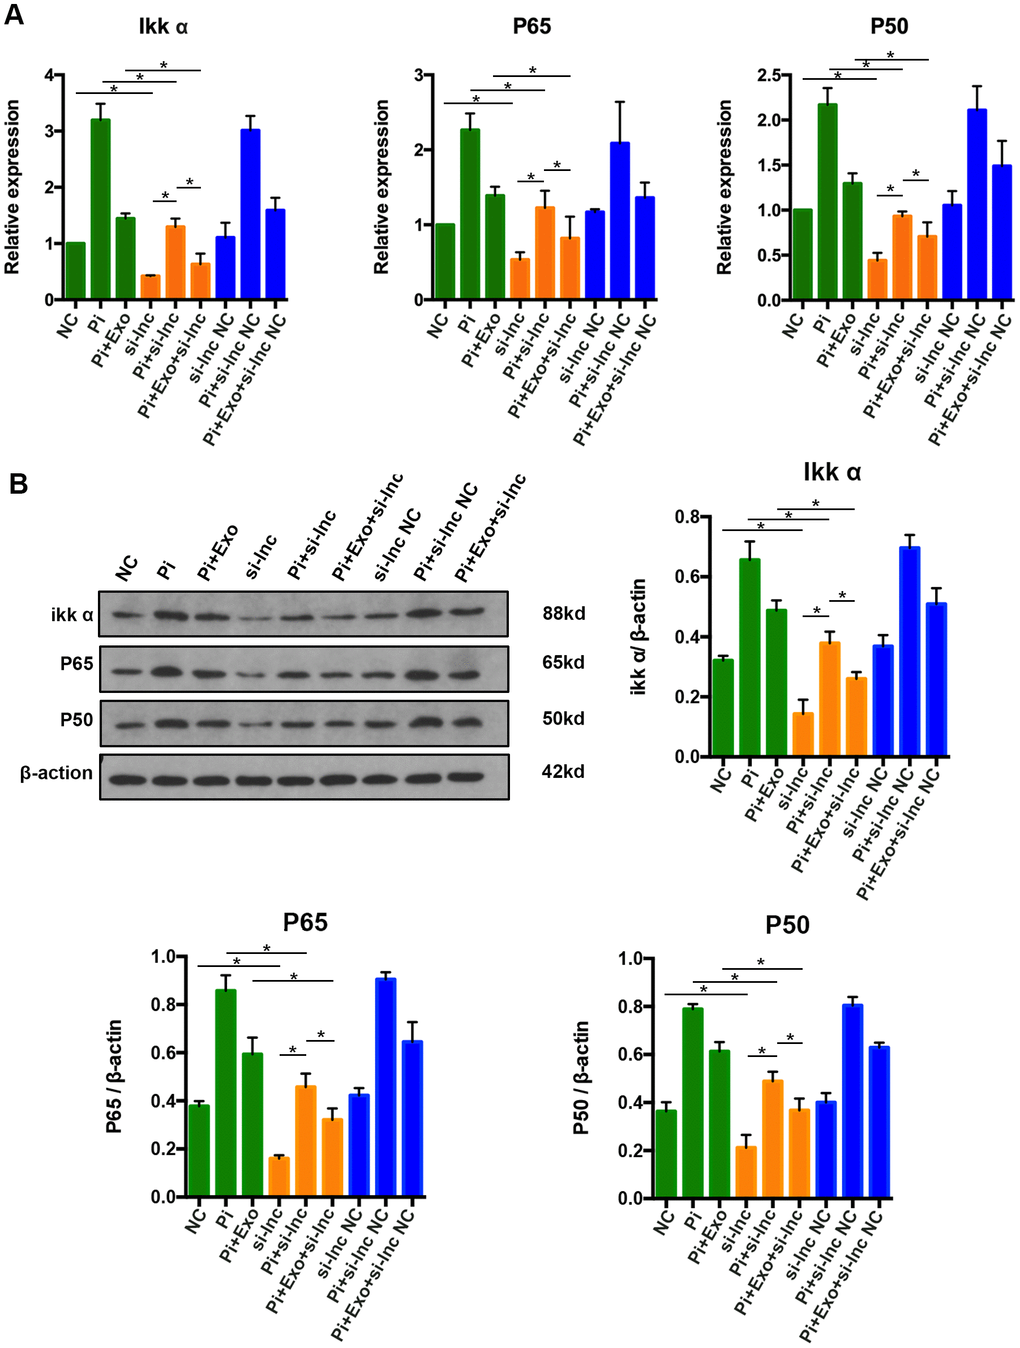
Figure 9.
(
A
) RT-qPCR analysis of mRNAs in the NF-κB signaling pathway. (
B
) Western blot analysis of proteins in the NF-κB signaling pathway. *P<0.05.