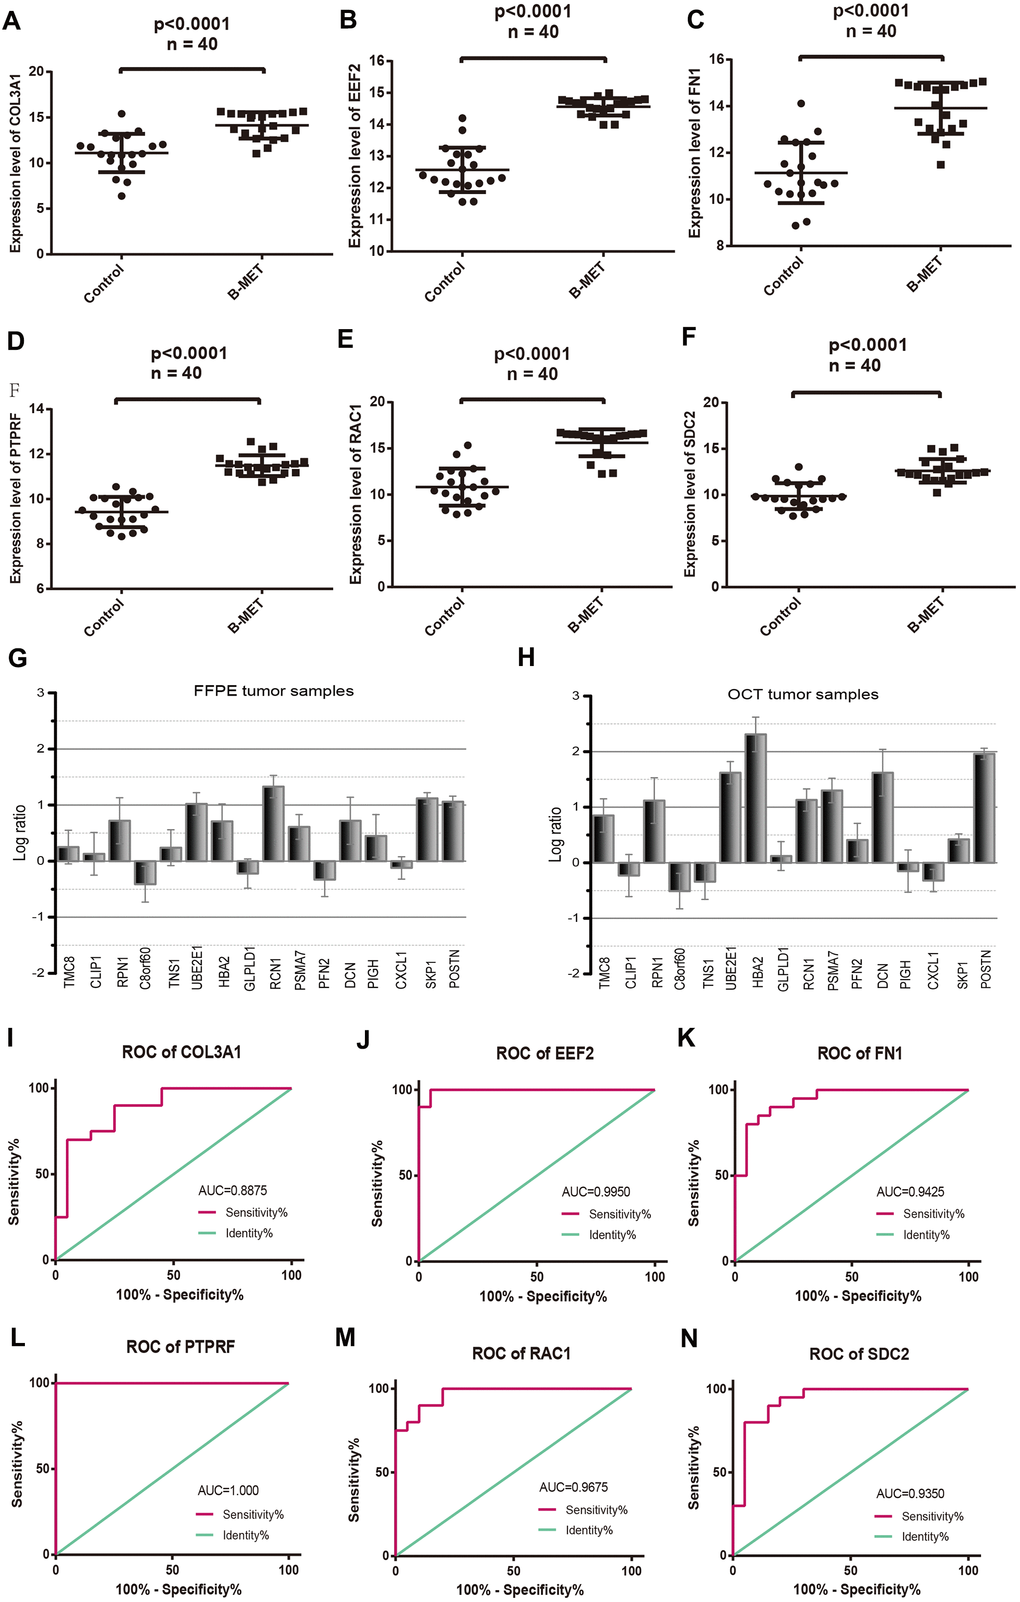
Figure 4.Comparable evaluation of the expression patterns and ROC curves of six differentially expressed hub genes between PCa and controls. Expression levels of COL3A1 (A), EEF2 (B), FN1 (C), PTPRF (D), RAC1 (E), and SDC2 (F). Detection of the expression values of the randomly selected DGEs in FFPE (G) and OCT (H) samples compared with the microarray data respectively. ROC curves of COL3A1 (I), EEF2 (J), FN1 (K), PTPRF (L), RAC1 (M), and SDC2 (N). (Means ± SEM FFPE n=5; OCT n=4).