


Introduction
Prostate cancer (PCa) is one of the most common malignant tumors in men worldwide and is ranked in the top five in terms of morbidity and mortality [1, 2]. Although progress has been made in screening and early detection of prostate cancer, a large proportion of men still develop advanced prostate cancer. Androgen deprivation therapy (ADT) is the standard treatment for advanced or metastatic prostate cancer, but it progresses to castration-resistant prostate cancer (CRPC) within 2-3 years after the initiation of ADT [3]. The prognosis of men with CRPC is worse than that those who are of hormone-sensitive, and the risk of metastasis is particularly higher [4, 5]. Patients with metastatic CRPC generally develop metastasis to the bones, which is the lethal end-stage; this poses a formidable therapeutic challenge. It is estimated that more than 80% of patients with mCRPC have skeletal metastases [6]. Although mCRPC treatment options have increased over the past decade, the mortality and 5-year survival rates have remained unacceptable.
Bone metastasis leads to bone metabolic disorders, which can lead to bone -related events, such as spinal cord compression, pathological fractures, and severe pain, which usually require bone tumor-related surgical intervention and external radiotherapy. However, study demonstrated that these therapeutic methods not only reduce the overall survival time and life quality of the patients but also increase the burden of treatment [7]. The development of future treatments as well as the selection of therapies in individual patients requires a deeper understanding of the biological signature of bone metastasis. Due to tissue availability, genome-wide studies of biomarkers related to cancer-specific deaths are mainly based on observations of primary tumors, except in the more lethal metastatic lesions.
In this study, we aimed to identify the putative targets for BM PCa by integrated regulatory network and survival analysis, which provide a valuable resource for further investigations carried out to better understand the mechanisms and potentially guide therapy decisions. On most occasions, the combination of screened biomarkers and clinical information has been proven to provide a diagnostic basis for the accurate assessment of suspicious bone metastases.
Materials and Methods
Data acquisition and DEGs identification
Primary and bone metastatic CRPC tumor gene expression profile datasets, GSE32269 and GSE77930, were obtained from an international public repository, NCBI-GEO (http://www.ncbi.nlm.nih.gov/geo/). Raw data in different datasets were converted to expression measures and normalized using the data processed package downloaded from the open source software for bioinformatics Bioconductor in R [8]. The limma package [9] was used for the identification of genes with aberrant expression profiles in primary tumors compared with bone metastatic CRPC samples. DEGs were defined using threshold |logFC| >1 and FDR <0.05 as criteria for comparison. Finally, the overlapping genes between the DEGs were considered as significant genes associated with bone metastatic CRPC. Bone metastasis and primary prostate cancer samples used in the real-time quantitative PCR and immunohistochemical analysis of this study were collected from CRPC patients who had not received chemotherapy or radiotherapy (Table 1) after obtaining informed consent in accordance with the protocol approved by the Ethics Committee of Affiliated Cancer Hospital and the First Affiliated Hospital of Zhengzhou University.
Table 1. Demographics and characteristics of the study group (n=42).
| Variable | Number or characteristics |
| Mean age at diagnosis | 67.5 |
| Median age at diagnosis | 61 |
| Standard deviation | 7.26 |
| Stage (AJCC8th) | |
| IIIB: T3-4, N0, M0 | 21 |
| IVA: Any T, N1, M0, | 12 |
| IVB: Any T, N1, M1 | 9 |
| Neoadjuvant chemotherapy | Not received |
Functional and pathway enrichment analysis
DAVID (Database for Annotation, Visualization and Integrated Discovery) [10] was used for gene ontology (GO) analysis. The DEGs in primary and bone metastatic CRPC tumors were screened for functional enrichment. GO analysis was used to evaluate the potential functions and degree of enrichment of the DEGs in biological processes (BP), cellular components (CC), and molecular functions (MF). Kyoto Gene and Genome Encyclopedia (KEGG) database with a P-value of <0.05 was used to systematically analyze the differences in gene function [11]. In addition, gene set enrichment analysis (GSEA) was used to determine the statistically significant and concordant differences between the two biological states of primary and bone metastatic CRPC tumors. The false discovery rate was adjusted to 0.05, and FDR <0.05 was considered the cut-off criterion.
Integration of PPI network and identification of hub genes
As an online database, the Search Tool for the Retrieval of Interacting Genes (STRING) [12] (version 10.0, http://string-db.org) was use to retrieve gene interactions providing experimental and predictive PPI (protein-protein interaction) information. Cytoscape software (version 3.4.0, http://www.cytoscape.org) was utilized to construct PPI networks [13] to visualize the interaction of the DEGs. Subsequently, the CytoHubba plug-in [14] software was used to calculate the degree centrality of the nodes and hub proteins with higher degrees of centrality were identified [15]. Additionally, the KEGG pathway enrichment analysis of the nodes in the significant modules was performed using Multifaceted Analysis Tool for Human Transcriptome [16].
Validation of hub genes
To verify the above analysis results, real-time quantitative PCR was used to detect the expression patterns of 6 related genes using theQPK-201 SYBR Green master mix (Toyobo, Osaka, Japan) and the ABI 7300 system from Applied Biosystems. The thermocycling protocol was set as an RT step at 50° C for 20 min, DNA polymerase activation step at 95° C for 2 min, and a total of 35 PCR cycles (95° C for 20 s, 60° C for 30 s). The primers used in this study were synthesized from Invitrogen (Beijing China). All reactions were performed in triplicate, and all samples were standardized with GAPDH. A comparative CT method was used to calculate the fold change of expression in each gene. Expression data are described by a log-ratio calculated by comparing ΔCq from the BM tumor cells with ΔCq from the primary controls. The 2-ΔΔCq method was used for expression level analysis.
Immunohistochemistry and immunofluorescence evaluation
Immunohistochemistry (IHC) was carried out with 3μm thick sections of formalin-fixed, paraffin-embedded, bone-metastasis and primary tumor tissues from CRPC patients who had undergone surgical resection before radiochemical therapy. After de-paraffinization and rehydration of tissue sections, antigen retrieval was performed by microwave sterilization in 10 mM citrate buffer (pH 6.0). Primary antibody (anti-COL3A1, anti-PTPRF, and anti-SDC2, Beijing Zhongshan Golden Bridge Biotechnology Co., Ltd., Beijing, China) was used at a 1:50 dilution. Anti-rabbit, peroxidase-conjugated secondary antibody was then applied at a 1:500 dilution. Diaminobenzidine (DAB) was used to visualize the labeling and hematoxylin was used as the section counterstain. For immunofluorescence staining, Cy3 or FITC (BioLegend, USA) was used as a secondary antibody (1.5 μg/mL) for one hour, and nuclei were counterstained by 4′-6-diamidino-2-phenylindole (DAPI; Sigma, USA) for 5 min. After mounting, the sections were observed under an Olympus BX51 microscope at 200× magnification.
Nonparametric estimation
Kaplan-Meier curve and survival estimation are a frequently used method to display time-to-event outcomes, especially for patients with different lengths of follow-up. Hub genes may play an important role in the progression of bone metastasis of CRPC for their centrality in the co-expression networks. In this study, based on the datasets from cBioportal, a database that collects and processes the Cancer Genome Atlas (TCGA) datasets the screened hub genes were analyzed using Kaplan-Meier to identify their specific association with the overall survival (OS) of PCa patients (Supplementary Table 1). According to cBioportal survival analyzing confidence interval, the screened hub genes were analyzed to identify the correlation of their specific altered expression with overall survival of PCa patients. P < 0.05 was considered as to be statistically significant.
Statistics
The mean ± SD was used to present standard descriptive statistics. P values for experimental data were generated using a two-tailed Student’s t-test with unequal variance. A P-value or FDR of less than 5% was considered significant.
Data availability statement
Publicly available datasets were analyzed in this study. This data can be found here: https://www.ncbi.nlm.nih.gov/geo/.
Ethics statement
Samples were collected from patients after obtaining informed consent in accordance with a protocol approved by the Ethics Committee of Affiliated Cancer Hospital and the First Affiliated Hospital of Zhengzhou University (Zhengzhou, China).
Results
Identification of DEGs in PCa patients with BM
To identify the genes differentially expressed between bone metastasis and primary tumors, threshold |logFC| >1 and FDR <0.05 were used as cut-off criteria for comparative analysis. A total of 2283 DEGs were identified in GSE32269, while 3396 DEGs were identified in GSE77930 (Figure 1A, 1B and Supplementary Tables 2, 3). Among those, 742 (GSE32269) and 1554 (GSE77930) were downregulated, and 1541 (GSE32269) and 1842 (GSE77930) were upregulated. The gene expression distribution after normalization are shown in Figure 1C. We selected ten overlapping upregulated and downregulated genes, according to their biological function and log-ratio expression values (Table 2). A comparison of the DEGs between the two datasets revealed that 381 genes were overlapped, including 56 co-downregulated and 325 co-upregulated genes (Figure 1D, 1E). Thereafter, the overlapping DEGs were clustered to differentiate BM tumors from the primary samples and presented in the heatmaps (Figure 1F).
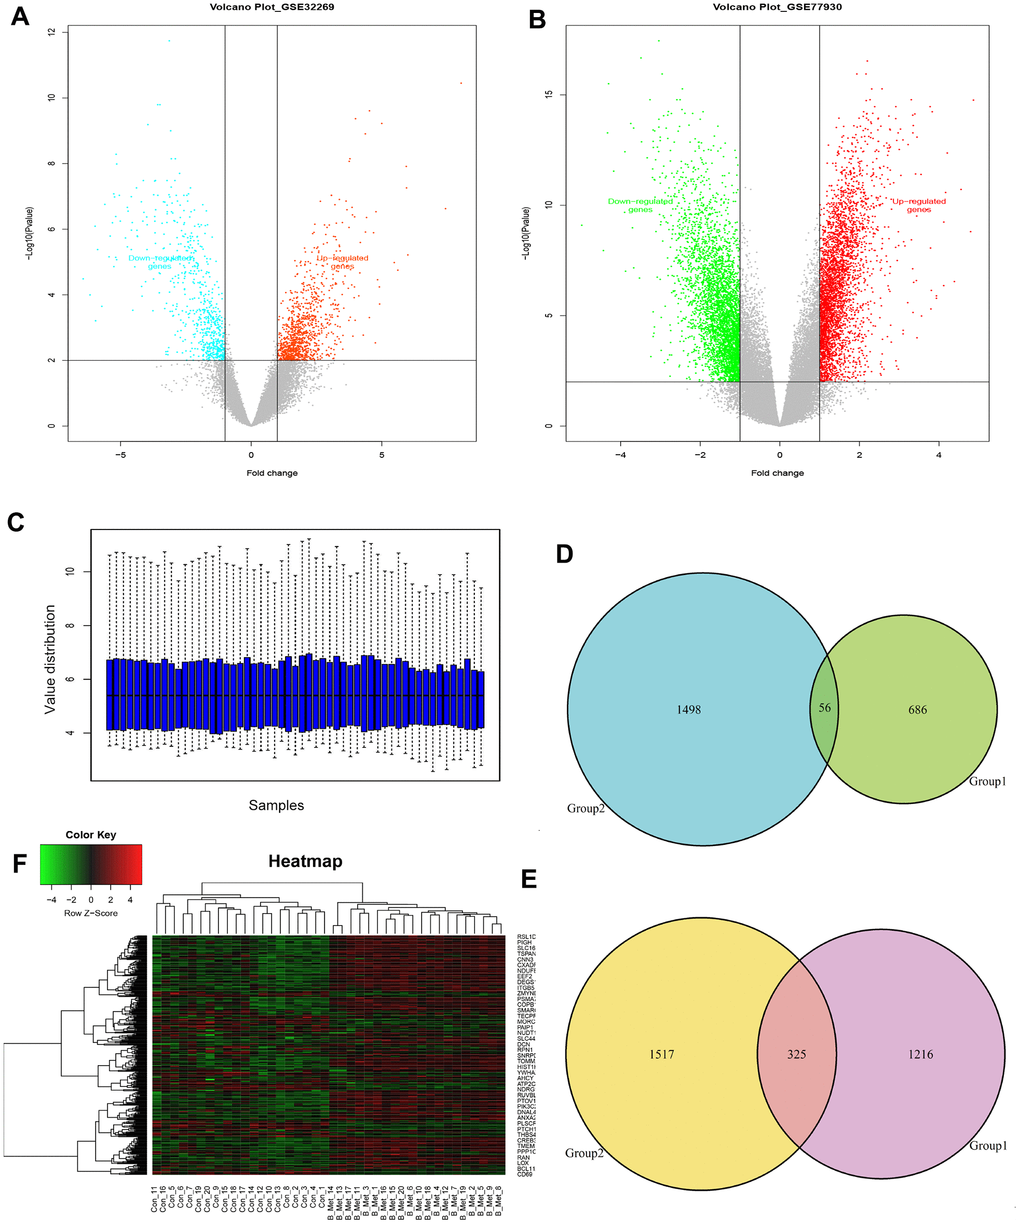
Figure 1. Identification of the overlapping DEGs in GSE32269 and GSE77930. Volcano plots of DEGs from analyzed microarray data of GSE32269 (A) and GSE77930 (B). (C) The gene expression distribution after normalization. Venn plots for the overlapping downregulated (D) and upregulated (E) DEGs. (F) The dendrogram of overlapping DEGs. Red represents higher expression and green represents lower expression. The criteria used to select DEGs were P <0.05 and |log2 (fold-change)| >1. DEGs, differentially expressed genes.
Table 2. Ten up- and down-regulated genes in bone metastasis tumors of PCa.
| Primary accession | Gene symbol | Log2 ratio | Main function |
| NM_001040058 | SPP1 | 4.793 | Involved in the attachment of osteoclasts to the mineralized bone matrix. Probably important to cell-matrix interaction. |
| NM_001568 | EIF3E | 3.829 | Component of the eukaryotic translation initiation factor 3 (eIF-3) complex, which is required for several steps in the initiation of protein synthesis. |
| NM_005971 | FXYD3 | 3.786 | This gene encodes a cell membrane protein that may regulate the function of ion-channels and may also play a role in tumor progression. |
| NM_00020 | COL3A1 | 3.431 | A fibrillar collagen that is found in extensible connective tissues such as skin, lung, uterus and the vascular system. |
| NM_000090 | COL11A1 | 3.363 | May play an important role in fibrillogenesis by controlling lateral growth of collagen II fibrils. |
| NM_207042 | ENSA | 3.342 | The protein encoded by this gene belongs to a highly conserved cAMP-regulated phosphoprotein family. |
| NM_005561 | LAMP1 | 2.972 | A kind of membrane glycoprotein which provides selectins with carbohydrate ligands and may also play a role in tumor cell metastasis. |
| NM_002950 | RPN1 | 2.912 | This protein forms part of the regulatory subunit of the 26S proteasome and may mediate binding of ubiquitin-like domains to this proteasome. |
| NM_212482 | FN1 | 2.776 | This gene encodes fibronectin involved in cell adhesion and migration processes. |
| NM_001307 | CLDN7 | 2.765 | As a member of claudin family which are integral membrane proteins and components of tight junction strands. |
| NM_023111 | FGFR1 | -2.648 | A member of the fibroblast growth factor receptor (FGFR) family where amino acid sequence is highly conserved. |
| NM_004456 | EZH2 | -2.663 | Encodes a member of the Polycomb-group (PcG) family involved in maintaining the transcriptional repressive state. |
| NM_002409 | MGAT3 | -2.698 | Glycosyltransferase involved in the synthesis of protein-bound and lipid-bound oligosaccharides. |
| NM_004762 | CYTH1 | -2.737 | Mediate the regulation of protein sorting and membrane trafficking |
| NM_003248 | THBS4 | -2.868 | Adhesive glycoproteins that mediate cell-to-cell and cell-to-matrix interactions. |
| NM_001024858 | SPTB | -2.911 | Actin crosslinking and molecular scaffold protein that links the plasma membrane to the actin cytoskeleton. |
| NM_001511 | CXCL1 | -3.153 | Has chemotactic activity for neutrophils that signals through the G-protein coupled receptor. |
| NM_016612 | SLC25A37 | -3.155 | Mitochondrial iron transporter that playing an essential role in heme biosynthesis. |
| NM_000298 | PKLR | -3.785 | Pyruvate kinase involved in a critical energy-producing process known as glycolysis. |
| NM_003245 | TGM3 | -3.814 | Catalyzes the cross-linking of proteins and the conjugation of polyamines to proteins. |
Functional signaling pathway enrichment analysis
Functions and pathway enrichment analysis were performed, and the results demonstrated that the 381 overlapping genes are involved in several biological processes (BP), including generation of precursor metabolites and energy, cellular respiration, and extracellular matrix organization (Figure 2A). In terms of cellular components, DEGs were mostly enriched in the melanosome, pigment granule and respiratory chain (Figure 2B). Molecular function (MF) analysis revealed that the overlapping DEGs were mainly associated with structural molecule activity, NADH dehydrogenase activity and heparin binding (Figure 2C). Subsequential Kyoto Encyclopedia of Genes and Genomes (KEGG) pathway enrichment analysis showed that the common upregulated DEGs were primarily enriched in the extracellular matrix (ECM) -receptor interaction, focal adhesion, citrate cycle and N-glycan biosynthesis (Figure 2D). Moreover, Gene Set Enrichment Analysis (GSEA) was implemented between the BM and primary groups. Results revealed that gene sets were mainly enriched in the multicancer invasiveness signature and transcription factor E2F targets up (Figure 2E, 2F). These analyses reflect the biological processes associated with regulation of extracellular matrix receptor interaction and chemotactic activity. This significantly enriched gene ontology function GSEA analysis could help us further understand the roles of the overlapping DEGs, involved in the development of BM in CRPC.
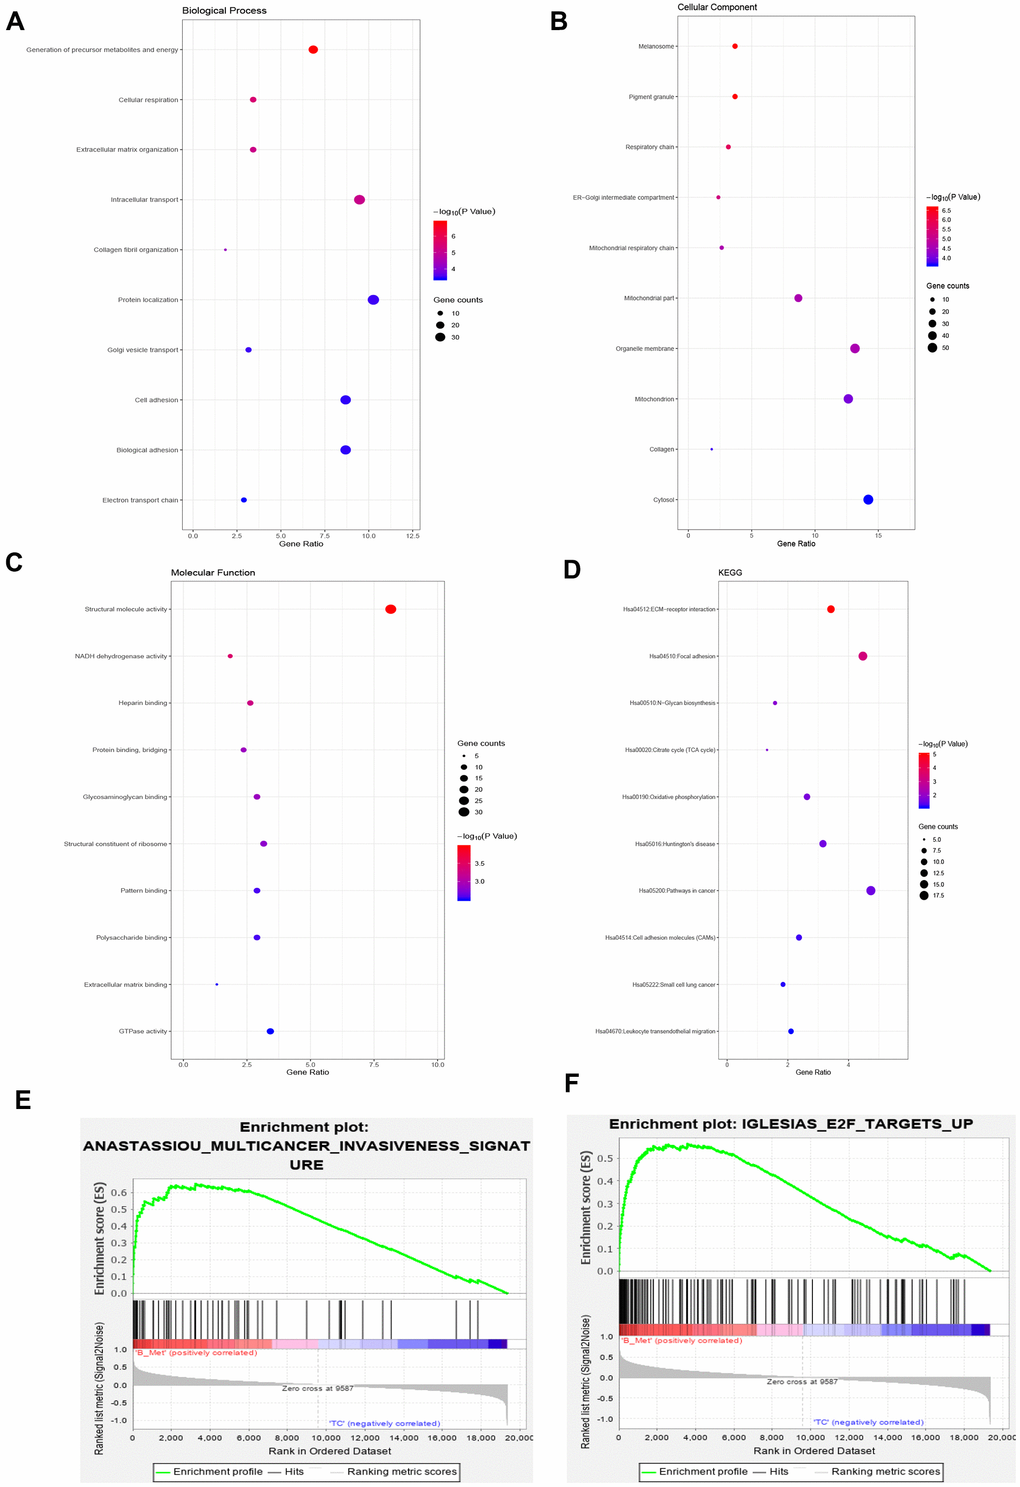
Figure 2. Gene ontology, Kyoto Encyclopedia of Genes and Genomes and gene set enrichment analysis of the overlapping DEGs. (A–C) Top 10 GO terms enriched in biological processes (A), cellular components (B), and molecular functions (C). (D) KEGG pathway analysis. (E) Enrichment of genes in ANASTASSIOU_MULTICANCER_INVA- SIVENESS_SIGNATURE. (F) Enrichment of genes in IGLESIAS_E2F_TARGETS_UP.
Modular analysis and candidate BM markers identification
To further screen the hub genes of DEGs identified in the datasets, PPI networks were constructed using GSE32269 and GSE77930 significant proteins in which the overlapping nodes were highlighted in yellow (Figure 3A, 3B). To distinguish the hub genes based on the PPI networks, Edge Percolated Component (EPC) was chosen to identify candidate BM markers. The most significant modules composed of 10 nodes were screened out and highlighted with color from red to yellow according to their importance in the interactome network based on topological algorithms (Figure 3C, 3D). The EPC significant proteins consist of 93 nodes and 413 edges in the GSE32269 sub-network, 75 nodes and 273 edges in GSE77930 sub-network. By calculation of the value of the three features for each hub protein, the median values of “Closeness”, “Betweenness”, and “Degree” for GSE32269 and GSE77930 were 0.0043, 27.35, and 6.5 and 0.0051, 57.87, 3.5 respectively. Functional annotation and pathway analysis of the key nodes in the sub-networks are displayed in Figure 3E, 3F. This indicates that the ECM-receptor interaction pathway is significantly involved in the modules associated with the hub proteins.
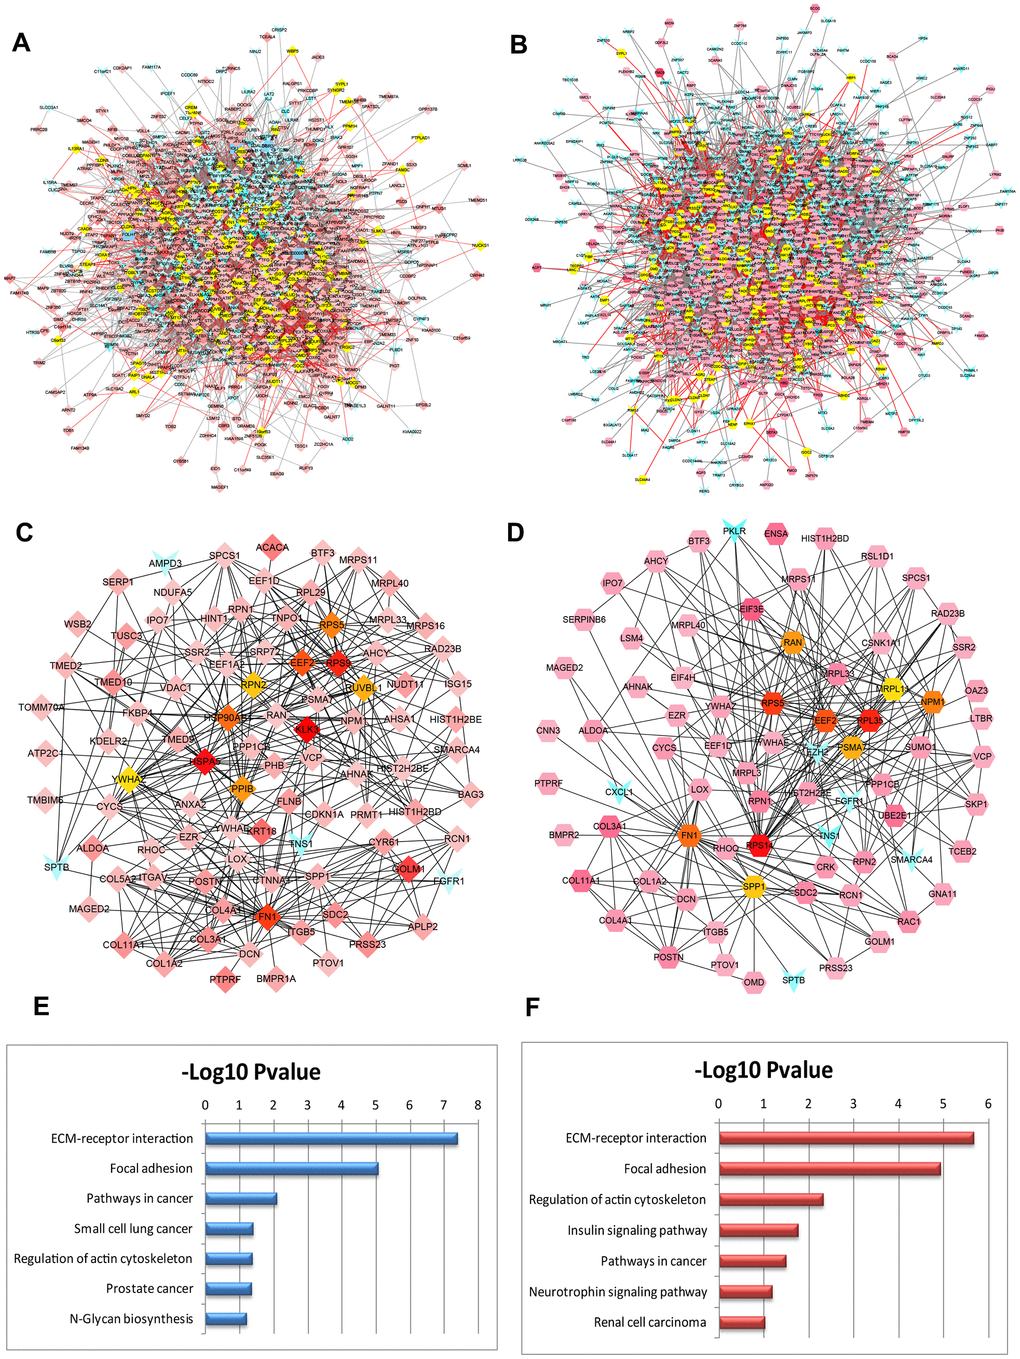
Figure 3. PPI networks constructed by the DEGs from BM PCa and pathway function enrichment. Deregulated gene networks of GSE32269 (A) and GSE77930 (B). (C) Network of significant hub proteins screened from GSE32269. (D) Network of significant hub proteins screened from GSE77930. Red and green intensities indicate the degree of upregulation and downregulation, respectively. (E) Pathway enrichment in network C. (F) Pathway enrichment in network D.
Validation and ROC analysis of the hub DEGs
The expression patterns of six DEGs including COL3A1, EEF2, FN1, PTPRF, SDC2, and RAC1, were evaluated by quantitative RT-PCR (Figure 4A–4F). The results showed upregulated and enhanced positive expression of these hub genes in BM tumors compared to the primary tumors of the OCT samples from CRPC patients. In addition, a panel of 16 DEGs with the lowest and highest expression range was also analyzed in BM tumors versus primary controls (OCT tumor samples, n=4; FFPE tumor samples, n=5) from patients with bone metastatic CRPC (Figure 4G, 4H). Results revealed that most of these genes displayed a transcriptional profile similar to that of the analyzed microarray data. The Pearson correlation coefficients between the microarray data and qRT-PCR of the 16 DEGs in OCT and FFPE samples were 0.83 and 0.78, respectively. Furthermore, receiver operating characteristic (ROC) analysis was performed for the hub genes (Figure 4I–4N), and the area under the curve (AUC) of COL3A1, EEF2, FN1, PTPRF SDC2, and RAC1 were 0.8875, 0.9950, 0.9425, 0.8675, 0.9250, and 0.9675, respectively (P< 0.01). The ROC curve represents the relationship between the true positive fraction and the false positive fraction resulting from a set of binary classification statistical tests of the expression data based on each possible decision threshold value [17].
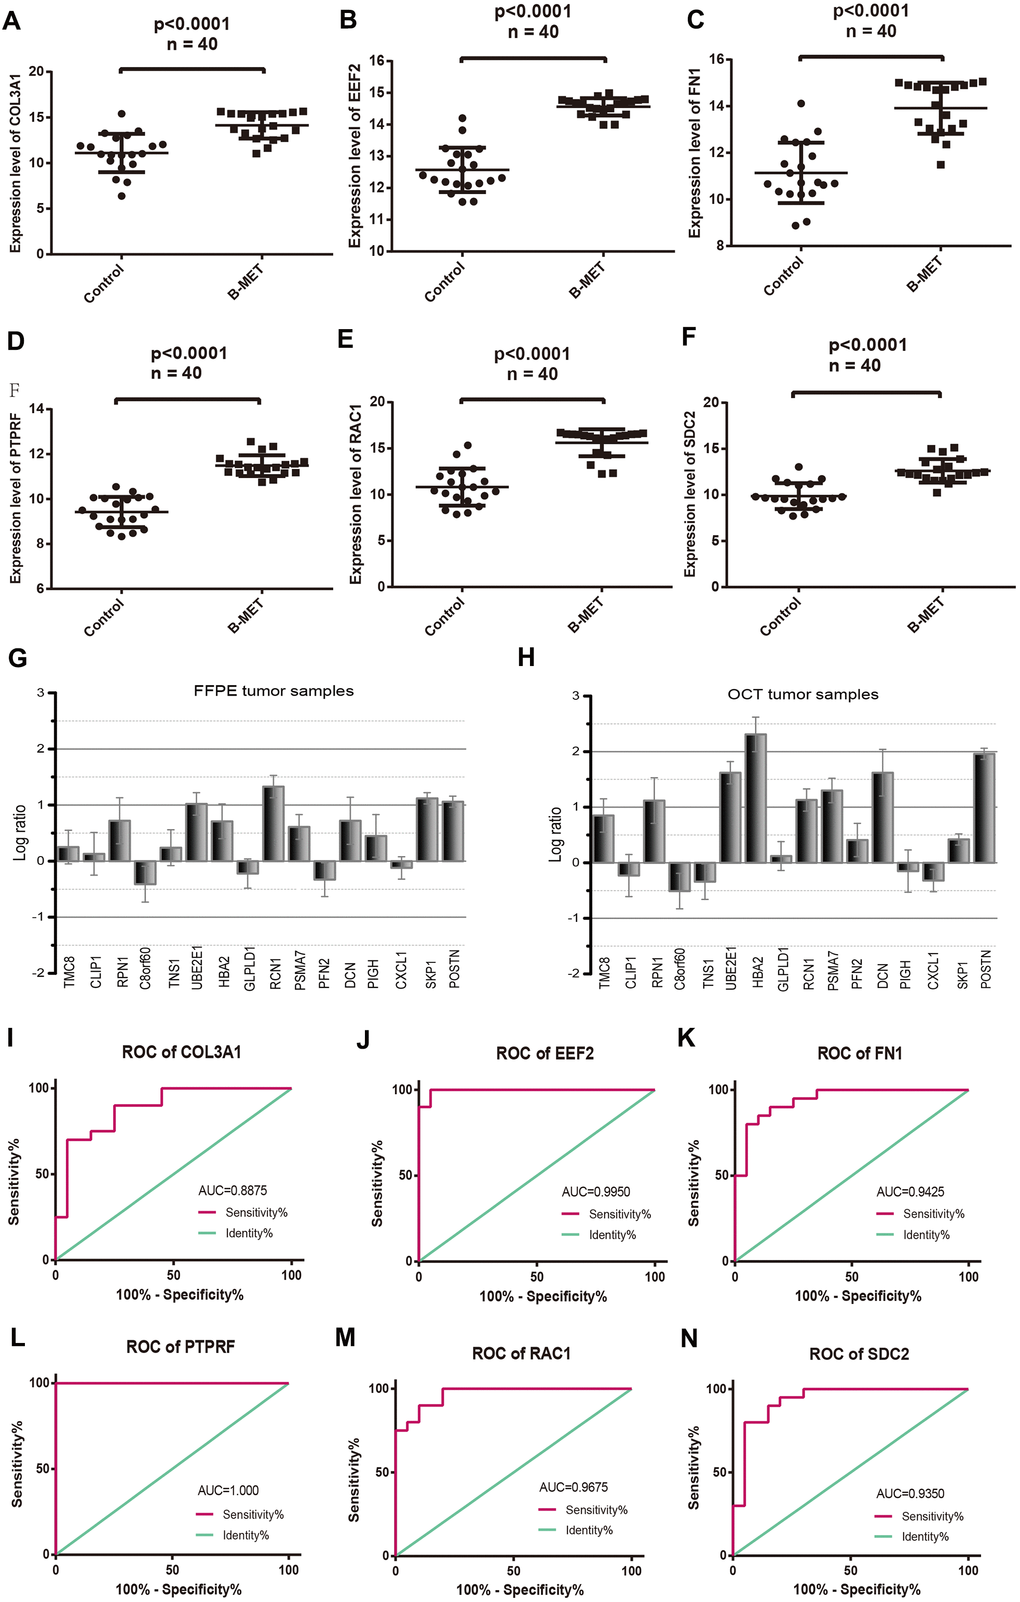
Figure 4. Comparable evaluation of the expression patterns and ROC curves of six differentially expressed hub genes between PCa and controls. Expression levels of COL3A1 (A), EEF2 (B), FN1 (C), PTPRF (D), RAC1 (E), and SDC2 (F). Detection of the expression values of the randomly selected DGEs in FFPE (G) and OCT (H) samples compared with the microarray data respectively. ROC curves of COL3A1 (I), EEF2 (J), FN1 (K), PTPRF (L), RAC1 (M), and SDC2 (N). (Means ± SEM FFPE n=5; OCT n=4).
Evaluation of prognostic associated molecules
Kaplan–Meier survival analysis was performed to evaluate the prognostic values of the hub genes with respect to the overall survival (OS) of PCa patients. The results revealed that four hub proteins as independent risk factor, COL3A1, PTPRF, SDC2, and RAC1 were significantly associated with OS in the patients (Figure 5A–5F). The dataset from TCGA database were treated by cBioportal and the risk ratio and survival curve was drawn based on 6 key genes as independent risk factors. Result showed that COL3A1 and SDC2 were found to be the highest risk factors of prostate cancer, followed by RAC1 and PTPRF (Supplementary Figure 1). The expression signature of the ECM-receptor interaction associated molecules COL3A1, SDC2, and PTPRF were further identified by immunohistochemistry in clinical BM samples of CRPC patients. Results showed that the protein levels of COL3A1, SDC2, and PTPRF were particularly high in BM tumors than in the primary samples (Figure 5G–5I). Furthermore, we detected the expression levels of EEF2, FN1 and RAC1 in which we found that EEF2 is significantly high in tumors while the expression levels of FN1 and RAC1 were relatively low (Supplementary Figure 2). However, it is not clear whether these key genes are expressed in tumor cells or tumor microenvironment.
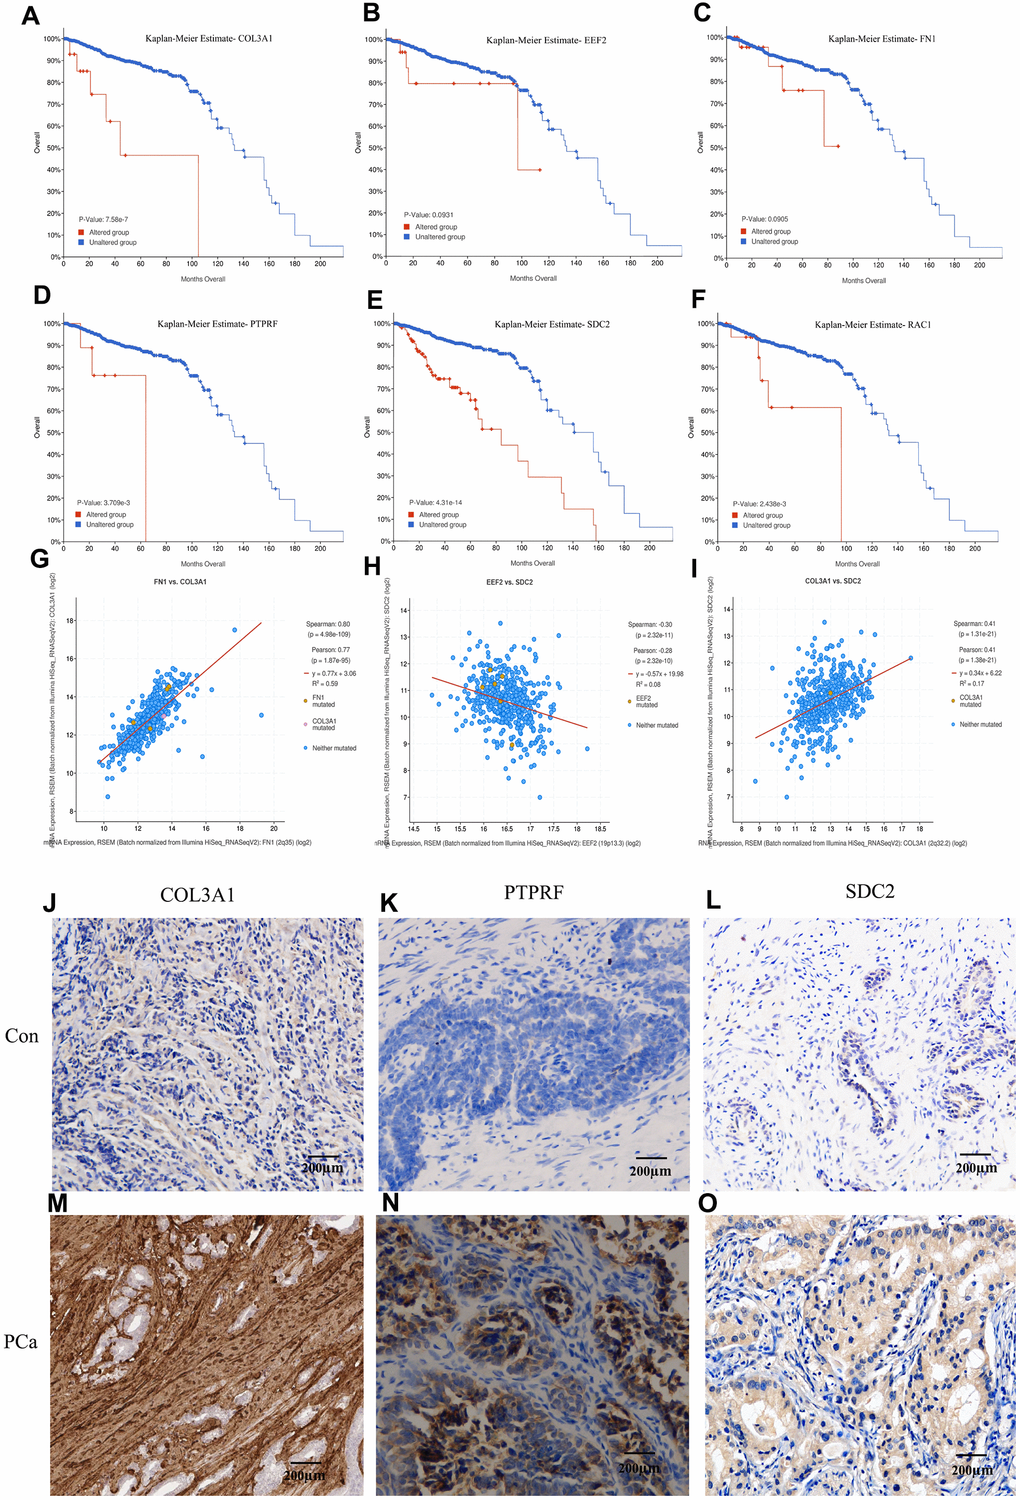
Figure 5. Kaplan-Meier estimation of the overall survival and identification of the key molecules by immunohistochemistry in patients samples. Overall survival analysis of COL3A1 (A), EEF2 (B), FN1 (C), PTPRF (D), SDC2 (E), and RAC1 (F). Expression linear correlations between FN1 vs. COL3A1 (G), EEF2 vs. SDC2 (H), and COL3A1 vs. SDC2 (I). (J–O) Detection of COL3A1, PTPRF, and SDC2 expression by immunohistochemistry in representative BM PCa and controls.
Visualization and evaluation of tumor infiltration immune cells
Tumor Immune infiltration estimation showed that the expression levels of COL3A1, RAC1, FN1, and SDC2 were all negatively associated with tumor purity whereas positively correlated with CD4+ T cells (Figure 6A) in PCa, as indicated that these proteins may be expressed in this type of immune cells rather than in tumor cells. Cellular composition was evaluated by the Wilcoxon test based on standardized gene expression value, which showed the abundances of specific cell types. From the chart of Figure 6B, we identified a relatively high percentage of induced regulatory T cell (iTreg) and Th1 cell in BM PCa tissue (P< 0.05), which is consistence with the immune infiltration analysis. To further illustrate the immune cell profile, we detected the regulatory T cell by immunofluorescence staining of FOXP3 and observed that the Tregs are markedly increased in the BM tumor microenvironment (Figure 6C, 6D). Study indicated that increased infiltration of regulatory T cells in prostate cancer tissue is associated with a poor prognosis [18]. The aberrant immune cell infiltration especially the increased iTreg may have an important clinical value in prognostic and treatment of BM PCa.
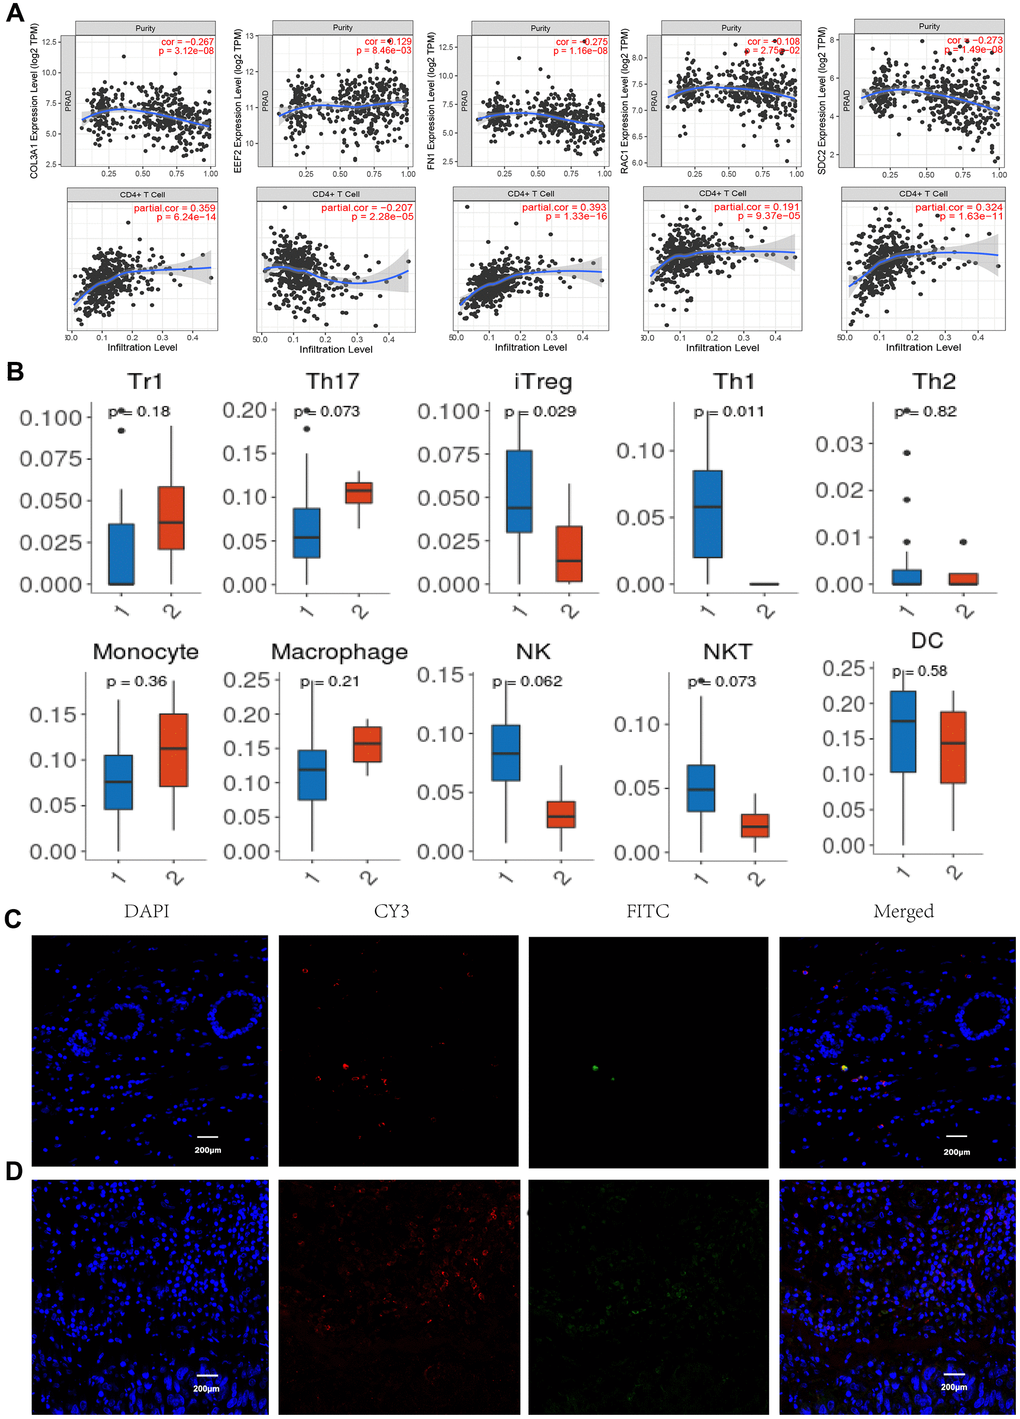
Figure 6. Immune infiltration and immunofluorescence identification. (A) Correlation of gene expression levels of COL3A1, EEF2, FN1, RAC1, and SDC2 with tumor purity and CD4+ T cells. (B) Tumor infiltrating lymphocytes profiles in the BM PCa (1. BM tumor, 2 normal tissues). Normal tissue (C) and BM tumor (D) immunofluorescence labeling for CD4 (red) and FOXP3 (green), as well as merged images. (n =6, P < 0.05, 200X).
Discussion
A bioinformatics method combined with high-throughput sequencing data was used to study the mechanism of prostate cancer, find the related genes and immune cell infiltration characteristics in BM prostate cancer, which provide the possibility of finding the target and related regulatory pathway in BM prostate cancer treatment. At present, the specific molecular mechanism of the metastasis of prostate cancer to the bone has not been fully elucidated. It involves the abnormal expression of many genes and the imbalance of related signaling pathways. In this study, we integrated two BM PCa datasets to comprehensively analyze and identify overlapping DEGs and immune cell infiltrating profile. Our research provides new insights into the molecular mechanism underlying the occurrence and development of mCRPC. The identification of genetic markers associated with PCa bone metastasis is essential for developing novel therapeutic targets.
Our gene expression analyses of the BM and primary PCa groups have shown that COL3A1, EEF2, FN1, PTPRF SDC2, and RAC1 act as hubs in the PPI networks, indicating their potentially significant roles. Functional enrichment results indicated that these overlapping genes were mainly involved in extracellular matrix organization, protein localization, cell adhesion, and ECM-receptor interaction. Type III collagen (COL3A1) is a structural protein that is classified as one of the major fibrillar collagens [19], which provides integrity for many organs. Studies indicated that COL3A1 is highly correlated with tumor progression and metastasis [20, 21]. COL3A1 has been identified as a representative biomarker that is overregulated in the focal adhesion pathway, and plays an unfavorable role in the development and metastasis of ovarian and bladder cancer [22, 23]. A previous study demonstrated that the mRNA and protein levels of COL3A1 are not only present in colorectal cancer (CRC) cells, but also increased in the plasma of CRC patients, which is associated with clinicopathologic factors and poor survival [24]. A report indicated that COL3A1 gene has prognostic implications in breast cancer [25]. Our results revealed that COL3A1, SDC2 and FN1 are dramatically enriched in the ECM-receptor interaction pathway, which may play a key role in the process of tumor development and bone metastasis of prostate cancer.
As a member of the syndecan proteoglycan family and an integral transmembrane protein, syndecan-2 (SDC2) plays an important role in controlling cell survival, proliferation, differentiation, cell-matrix interaction, and migration via its receptor of ECM proteins [26, 27]. The ECM contains collagen, proteoglycan, and several other glycoproteins to provide the structure of supporting cells where surface receptors can transmit signals from the ECM to the cells. These signals are essential for maintaining normal homeostasis [28]. In epithelial cells, SDC2 acts as a cross-link between ECM and actin cytoskeleton through its interaction with the PDZ domain of the CASK protein [29]. Ectopic or over-expression of this proteoglycan is related to the carcinogenic properties and poor prognosis of various malignant tumors [30, 31]. Deregulation of SDC2 might alter the expression of E-cadherin and consequently destroy cell-cell interactions, thereby increasing cell motility via the PKCa-dependent signaling pathway [32]. In addition, the expression levels of fibronectin 1 (FN1) were also found upregulated in BM tumors. As a member of the FN family, FN1 is widely expressed in many cell types and participates in ECM changes in physiological and pathological processes through integrin transmembrane receptors [33, 34]. Studies have shown that the expression of FN1 protein is closely related to the occurrence and development of many types of malignant tumors, such as ovarian cancer, renal cell carcinoma, and thyroid cancer [35–37]. Further, with the identification and recognition of ECM macromolecules in the remodeling of the tumor microenvironment, understanding the role of the ECM-receptor interaction in regulating tumor metastasis is becoming increasingly important.
From the network, we found that the expression levels of EEF2 and PTPRF were markedly increased in BM tumors compared to the primary samples of CRPC patients. EEF2 plays an important role in peptidyl-tRNA translocation and polypeptide chain elongation during protein synthesis. However, deregulation of this protein has been shown to be associated with tumorigenicity and cancer cell progression in mouse xenotransplantation model [38]. Overexpression of EEF2 correlates with cancer cell growth, metastasis invasion, and poor prognosis in acute myeloid leukemia, breast, and lung cancer [39–41]. Report indicated that significantly higher incidence of tumor recurrence and worse prognosis were found in elevated EEF2 patients, whereas silencing of eEF2 expression increased mitochondrial elongation and cellular autophagy [42]. It is suggested that EEF2 may be a promising target molecule for targeted cancer therapy [43]. Protein tyrosine phosphatase receptor type F (PTPFR) plays an essential role in the disassembly and reassembly of cell-cell and cell-extracellular matrix adhesions during epithelial cell migration. It has been found that high expression of PTPRF is related to the recurrence and metastasis of breast cancer and urothelial carcinoma of the bladder, while knockdown of PTPRF decreases cancer cell invasion and migration [44]. In addition, it was observed in the present study that the upregulated expression of RAC1 is inversely correlated with the survival rate of CRPC patients. RAC1, as a GTPase, belongs to the Ras superfamily of small GTP-binding proteins [45]. Hyperactivation of RAC1 has been implicated in numerous aspects of solid tumor development and could be the consequence of abnormal upstream inputs from tyrosine-kinase receptors and/or anomalous intracellular localization [46]. RAC1 GTPase was also found to signal Wnt-beta-catenin pathway-mediated tumor cell phenotypes which are involved in proliferation, tumorigenesis, and metastatic events [47].
Immune infiltration and immunofluorescence results showed that induced regulatory T cell were significantly increased in the BM prostate tumors. A high proportion of bone marrow T cells with regulatory phenotype (CD4+CD25hiFoxP3+) were also found in bone metastatic Ewing sarcoma patients [48]. Study revealed the active Treg cells recruitment and expansion in bone marrow of prostate cancer patients with bone metastasis, as may tilt the balance between osteoclast and osteoblastic activity and contribute to osteoblastic bone lesions of the patients [49]. Investigation indicated that TGFβ promotes Treg cell conversion while IL-2 induces Treg cell expansion from naïve T cells [50, 51]. In tumor immunity, Treg cells participate in the occurrence and development of tumors by inhibiting anti-tumor immunity [52]. High infiltration of Treg cells in TME has been associated with poor survival in various types of cancer [53, 54].
In conclusion, six core genes including COL3A1, EEF2, FN1, PTPRF SDC2, and RAC1, and several cancer-related metabolic processes, signaling pathways, and overall survival rate of patients were identified in BM PCa. These can be used as potential markers for early diagnosis and treatment. These analyses help in understanding the overall gene expression characteristics of bone metastatic CRPC and provide ideas and a theoretical basis for the diagnosis and treatment by which to increase the effectiveness of the current therapies.
Supplementary Materials
Author Contributions
SZ provided funding and support for the research. SZ, FM, ZM and XH conceptualized, led, and oversaw the research and analyzed data. FM, ZM, XH and SZ conducted the bioinformatics analysis and analyzed patient data. SZ, FM and XH participated in the writing of the manuscript.
Conflicts of Interest
The authors declare no conflict of interest. The funders had no role in the design of the study; in the collection, analyses, or interpretation of data; in the writing of the manuscript, or in the decision to publish the results.
Funding
This study was supported by grants from Natural Science and Technologies Program of Henan Province (202300410462) and Key research program of colleges and universities in Henan Province (20A320012).
References
- 1. Siegel RL, Miller KD, Jemal A. Cancer statistics, 2018. CA Cancer J Clin. 2018; 68:7–30. https://doi.org/10.3322/caac.21442 [PubMed]
- 2. Pernar CH, Ebot EM, Wilson KM, Mucci LA. The Epidemiology of Prostate Cancer. Cold Spring Harb Perspect Med. 2018; 8:a030361. https://doi.org/10.1101/cshperspect.a030361 [PubMed]
- 3. Karantanos T, Corn PG, Thompson TC. Prostate cancer progression after androgen deprivation therapy: mechanisms of castrate resistance and novel therapeutic approaches. Oncogene. 2013; 32:5501–11. https://doi.org/10.1038/onc.2013.206 [PubMed]
- 4. Moreira DM, Howard LE, Sourbeer KN, Amarasekara HS, Chow LC, Cockrell DC, Hanyok BT, Aronson WJ, Kane CJ, Terris MK, Amling CL, Cooperberg MR, Liede A, Freedland SJ. Predictors of Time to Metastasis in Castration-resistant Prostate Cancer. Urology. 2016; 96:171–76. https://doi.org/10.1016/j.urology.2016.06.011 [PubMed]
- 5. Li S, Li R, Ma Y, Zhang C, Huang T, Zhu S. Transcriptome analysis of differentially expressed genes and pathways associated with mitoxantrone treatment prostate cancer. J Cell Mol Med. 2019; 23:1987–2000. https://doi.org/10.1111/jcmm.14100 [PubMed]
- 6. Zhang X. Interactions between cancer cells and bone microenvironment promote bone metastasis in prostate cancer. Cancer Commun (Lond). 2019; 39:76. https://doi.org/10.1186/s40880-019-0425-1 [PubMed]
- 7. Zhu S, Jiang L, Wang L, Wang L, Zhang C, Ma Y, Huang T. Identification of key genes and specific pathways potentially involved in androgen-independent, mitoxantrone-resistant prostate cancer. Cancer Manag Res. 2019; 11:419–30. https://doi.org/10.2147/CMAR.S179467 [PubMed]
- 8. Kumari S, Verma LK, Weller JW. AffyMAPSDetector: a software tool to characterize Affymetrix GeneChip expression arrays with respect to SNPs. BMC Bioinformatics. 2007; 8:276. https://doi.org/10.1186/1471-2105-8-276 [PubMed]
- 9. Ritchie ME, Phipson B, Wu D, Hu Y, Law CW, Shi W, Smyth GK. limma powers differential expression analyses for RNA-sequencing and microarray studies. Nucleic Acids Res. 2015; 43:e47. https://doi.org/10.1093/nar/gkv007 [PubMed]
- 10. Huang DW, Sherman BT, Lempicki RA. Systematic and integrative analysis of large gene lists using DAVID bioinformatics resources. Nat Protoc. 2009; 4:44–57. https://doi.org/10.1038/nprot.2008.211 [PubMed]
- 11. Zhu S, Han X, Qiao X, Chen S. The Immune Landscape and Prognostic Immune Key Genes Potentially Involved in Modulating Synaptic Functions in Prostate Cancer. Front Oncol. 2020; 10:1330. https://doi.org/10.3389/fonc.2020.01330 [PubMed]
- 12. Szklarczyk D, Franceschini A, Wyder S, Forslund K, Heller D, Huerta-Cepas J, Simonovic M, Roth A, Santos A, Tsafou KP, Kuhn M, Bork P, Jensen LJ, von Mering C. STRING v10: protein-protein interaction networks, integrated over the tree of life. Nucleic Acids Res. 2015; 43:D447–52. https://doi.org/10.1093/nar/gku1003 [PubMed]
- 13. Tian R, Xu Y, Dou WW, Zhang H. Bioinformatics analysis of microarray data to explore the key genes involved in HSF4 mutation-induced cataract. Int J Ophthalmol. 2018; 11:910–17. https://doi.org/10.18240/ijo.2018.06.03 [PubMed]
- 14. Chin CH, Chen SH, Wu HH, Ho CW, Ko MT, Lin CY. cytoHubba: identifying hub objects and sub-networks from complex interactome. BMC Syst Biol. 2014 (Suppl 4); 8:S11. https://doi.org/10.1186/1752-0509-8-S4-S11 [PubMed]
- 15. He X, Zhang J. Why do hubs tend to be essential in protein networks? PLoS Genet. 2006; 2:e88. https://doi.org/10.1371/journal.pgen.0020088 [PubMed]
- 16. Song W, Liu H, Wang J, Kong Y, Yin X, Zang W. MATHT: A web server for comprehensive transcriptome data analysis. J Theor Biol. 2018; 455:140–46. https://doi.org/10.1016/j.jtbi.2018.07.021 [PubMed]
- 17. Parodi S, Pistoia V, Muselli M. Not proper ROC curves as new tool for the analysis of differentially expressed genes in microarray experiments. BMC Bioinformatics. 2008; 9:410. https://doi.org/10.1186/1471-2105-9-410 [PubMed]
- 18. Watanabe M, Kanao K, Suzuki S, Muramatsu H, Morinaga S, Kajikawa K, Kobayashi I, Nishikawa G, Kato Y, Zennami K, Nakamura K, Tsuzuki T, Yoshikawa K, et al. Increased infiltration of CCR4-positive regulatory T cells in prostate cancer tissue is associated with a poor prognosis. Prostate. 2019; 79:1658–65. https://doi.org/10.1002/pros.23890 [PubMed]
- 19. Kuivaniemi H, Tromp G. Type III collagen (COL3A1): Gene and protein structure, tissue distribution, and associated diseases. Gene. 2019; 707:151–71. https://doi.org/10.1016/j.gene.2019.05.003 [PubMed]
- 20. Yuan L, Shu B, Chen L, Qian K, Wang Y, Qian G, Zhu Y, Cao X, Xie C, Xiao Y, Wang X. Overexpression of COL3A1 confers a poor prognosis in human bladder cancer identified by co-expression analysis. Oncotarget. 2017; 8:70508–20. https://doi.org/10.18632/oncotarget.19733 [PubMed]
- 21. Ivanovic RF, Viana NI, Morais DR, Silva IA, Leite KR, Pontes-Junior J, Inoue G, Nahas WC, Srougi M, Reis ST. miR-29b enhances prostate cancer cell invasion independently of MMP-2 expression. Cancer Cell Int. 2018; 18:18. https://doi.org/10.1186/s12935-018-0516-0 [PubMed]
- 22. Yang L, Jing J, Sun L, Yue Y. Exploring prognostic genes in ovarian cancer stage-related coexpression network modules. Medicine (Baltimore). 2018; 97:e11895. https://doi.org/10.1097/MD.0000000000011895 [PubMed]
- 23. Shi S, Tian B. Identification of biomarkers associated with progression and prognosis in bladder cancer via co-expression analysis. Cancer Biomark. 2019; 24:183–93. https://doi.org/10.3233/CBM-181940 [PubMed]
- 24. Kang SH, Oh SY, Lee HJ, Kwon TG, Kim JW, Lee ST, Choi SY, Hong SH. Cancer-Associated Fibroblast Subgroups Showing Differential Promoting Effect on HNSCC Progression. Cancers (Basel). 2021; 13:654. https://doi.org/10.3390/cancers13040654 [PubMed]
- 25. Xiong G, Deng L, Zhu J, Rychahou PG, Xu R. Prolyl-4-hydroxylase α subunit 2 promotes breast cancer progression and metastasis by regulating collagen deposition. BMC Cancer. 2014; 14:1. https://doi.org/10.1186/1471-2407-14-1 [PubMed]
- 26. Zhao G, Liu X, Liu Y, Li H, Ma Y, Li S, Zhu Y, Miao J, Xiong S, Fei S, Zheng M. Aberrant DNA Methylation of SEPT9 and SDC2 in Stool Specimens as an Integrated Biomarker for Colorectal Cancer Early Detection. Front Genet. 2020; 11:643. https://doi.org/10.3389/fgene.2020.00643 [PubMed]
- 27. Tsoyi K, Osorio JC, Chu SG, Fernandez IE, De Frias SP, Sholl L, Cui Y, Tellez CS, Siegfried JM, Belinsky SA, Perrella MA, El-Chemaly S, Rosas IO. Lung Adenocarcinoma Syndecan-2 Potentiates Cell Invasiveness. Am J Respir Cell Mol Biol. 2019; 60:659–66. https://doi.org/10.1165/rcmb.2018-0118OC [PubMed]
- 28. Theocharis AD, Skandalis SS, Gialeli C, Karamanos NK. Extracellular matrix structure. Adv Drug Deliv Rev. 2016; 97:4–27. https://doi.org/10.1016/j.addr.2015.11.001 [PubMed]
- 29. Rovira-Clavé X, Angulo-Ibáñez M, Reina M, Espel E. The PDZ-binding domain of syndecan-2 inhibits LFA-1 high-affinity conformation. Cell Signal. 2014; 26:1489–99. https://doi.org/10.1016/j.cellsig.2014.03.012 [PubMed]
- 30. Popović A, Demirović A, Spajić B, Stimac G, Kruslin B, Tomas D. Expression and prognostic role of syndecan-2 in prostate cancer. Prostate Cancer Prostatic Dis. 2010; 13:78–82. https://doi.org/10.1038/pcan.2009.43 [PubMed]
- 31. Mytilinaiou M, Nikitovic D, Berdiaki A, Papoutsidakis A, Papachristou DJ, Tsatsakis A, Tzanakakis GN. IGF-I regulates HT1080 fibrosarcoma cell migration through a syndecan-2/Erk/ezrin signaling axis. Exp Cell Res. 2017; 361:9–18. https://doi.org/10.1016/j.yexcr.2017.09.035 [PubMed]
- 32. Contreras HR, Ledezma RA, Vergara J, Cifuentes F, Barra C, Cabello P, Gallegos I, Morales B, Huidobro C, Castellón EA. The expression of syndecan-1 and -2 is associated with Gleason score and epithelial-mesenchymal transition markers, E-cadherin and beta-catenin, in prostate cancer. Urol Oncol. 2010; 28:534–40. https://doi.org/10.1016/j.urolonc.2009.03.018 [PubMed]
- 33. Jiang K, Liu H, Xie D, Xiao Q. Differentially expressed genes ASPN, COL1A1, FN1, VCAN and MUC5AC are potential prognostic biomarkers for gastric cancer. Oncol Lett. 2019; 17:3191–202. https://doi.org/10.3892/ol.2019.9952 [PubMed]
- 34. Lee JC, Su SY, Changou CA, Yang RS, Tsai KS, Collins MT, Orwoll ES, Lin CY, Chen SH, Shih SR, Lee CH, Oda Y, Billings SD, et al. Characterization of FN1-FGFR1 and novel FN1-FGF1 fusion genes in a large series of phosphaturic mesenchymal tumors. Mod Pathol. 2016; 29:1335–46. https://doi.org/10.1038/modpathol.2016.137 [PubMed]
- 35. Kujawa KA, Zembala-Nożyńska E, Cortez AJ, Kujawa T, Kupryjańczyk J, Lisowska KM. Fibronectin and Periostin as Prognostic Markers in Ovarian Cancer. Cells. 2020; 9:149. https://doi.org/10.3390/cells9010149 [PubMed]
- 36. Wu F, Wu S, Gou X. Identification of biomarkers and potential molecular mechanisms of clear cell renal cell carcinoma. Neoplasma. 2018; 65:242–52. https://doi.org/10.4149/neo_2018_170511N342 [PubMed]
- 37. Sponziello M, Rosignolo F, Celano M, Maggisano V, Pecce V, De Rose RF, Lombardo GE, Durante C, Filetti S, Damante G, Russo D, Bulotta S. Fibronectin-1 expression is increased in aggressive thyroid cancer and favors the migration and invasion of cancer cells. Mol Cell Endocrinol. 2016; 431:123–32. https://doi.org/10.1016/j.mce.2016.05.007 [PubMed]
- 38. Xie J, Shen K, Lenchine RV, Gethings LA, Trim PJ, Snel MF, Zhou Y, Kenney JW, Kamei M, Kochetkova M, Wang X, Proud CG. Eukaryotic elongation factor 2 kinase upregulates the expression of proteins implicated in cell migration and cancer cell metastasis. Int J Cancer. 2018; 142:1865–77. https://doi.org/10.1002/ijc.31210 [PubMed]
- 39. Connolly E, Braunstein S, Formenti S, Schneider RJ. Hypoxia inhibits protein synthesis through a 4E-BP1 and elongation factor 2 kinase pathway controlled by mTOR and uncoupled in breast cancer cells. Mol Cell Biol. 2006; 26:3955–65. https://doi.org/10.1128/MCB.26.10.3955-3965.2006 [PubMed]
- 40. Bircan HA, Gurbuz N, Pataer A, Caner A, Kahraman N, Bayraktar E, Bayraktar R, Erdogan MA, Kabil N, Ozpolat B. Elongation factor-2 kinase (eEF-2K) expression is associated with poor patient survival and promotes proliferation, invasion and tumor growth of lung cancer. Lung Cancer. 2018; 124:31–39. https://doi.org/10.1016/j.lungcan.2018.07.027 [PubMed]
- 41. Sbrini G, Brivio P, Sangiovanni E, Fumagalli M, Racagni G, Dell’Agli M, Calabrese F. Chronic Treatment with a Phytosomal Preparation Containing Centella asiatica L. and Curcuma longa L. Affects Local Protein Synthesis by Modulating the BDNF-mTOR-S6 Pathway. Biomedicines. 2020; 8:544. https://doi.org/10.3390/biomedicines8120544 [PubMed]
- 42. Chen CY, Fang HY, Chiou SH, Yi SE, Huang CY, Chiang SF, Chang HW, Lin TY, Chiang IP, Chow KC. Sumoylation of eukaryotic elongation factor 2 is vital for protein stability and anti-apoptotic activity in lung adenocarcinoma cells. Cancer Sci. 2011; 102:1582–89. https://doi.org/10.1111/j.1349-7006.2011.01975.x [PubMed]
- 43. Oji Y, Tatsumi N, Fukuda M, Nakatsuka S, Aoyagi S, Hirata E, Nanchi I, Fujiki F, Nakajima H, Yamamoto Y, Shibata S, Nakamura M, Hasegawa K, et al. The translation elongation factor eEF2 is a novel tumor-associated antigen overexpressed in various types of cancers. Int J Oncol. 2014; 44:1461–69. https://doi.org/10.3892/ijo.2014.2318 [PubMed]
- 44. Tian X, Yang C, Yang L, Sun Q, Liu N. PTPRF as a novel tumor suppressor through deactivation of ERK1/2 signaling in gastric adenocarcinoma. Onco Targets Ther. 2018; 11:7795–803. https://doi.org/10.2147/OTT.S178152 [PubMed]
- 45. Börschel CS, Stejskalova A, Schäfer SD, Kiesel L, Götte M. miR-142-3p Reduces the Size, Migration, and Contractility of Endometrial and Endometriotic Stromal Cells by Targeting Integrin- and Rho GTPase-Related Pathways That Regulate Cytoskeletal Function. Biomedicines. 2020; 8:291. https://doi.org/10.3390/biomedicines8080291 [PubMed]
- 46. De P, Aske JC, Dey N. RAC1 Takes the Lead in Solid Tumors. Cells. 2019; 8:382. https://doi.org/10.3390/cells8050382 [PubMed]
- 47. De P, Carlson JH, Jepperson T, Willis S, Leyland-Jones B, Dey N. RAC1 GTP-ase signals Wnt-beta-catenin pathway mediated integrin-directed metastasis-associated tumor cell phenotypes in triple negative breast cancers. Oncotarget. 2017; 8:3072–103. https://doi.org/10.18632/oncotarget.13618 [PubMed]
- 48. Brinkrolf P, Landmeier S, Altvater B, Chen C, Pscherer S, Rosemann A, Ranft A, Dirksen U, Juergens H, Rossig C. A high proportion of bone marrow T cells with regulatory phenotype (CD4+CD25hiFoxP3+) in Ewing sarcoma patients is associated with metastatic disease. Int J Cancer. 2009; 125:879–86. https://doi.org/10.1002/ijc.24461 [PubMed]
- 49. Zhao E, Wang L, Dai J, Kryczek I, Wei S, Vatan L, Altuwaijri S, Sparwasser T, Wang G, Keller ET, Zou W. Regulatory T cells in the bone marrow microenvironment in patients with prostate cancer. Oncoimmunology. 2012; 1:152–61. https://doi.org/10.4161/onci.1.2.18480 [PubMed]
- 50. Malek TR, Bayer AL. Tolerance, not immunity, crucially depends on IL-2. Nat Rev Immunol. 2004; 4:665–74. https://doi.org/10.1038/nri1435 [PubMed]
- 51. Furtado GC, Curotto de Lafaille MA, Kutchukhidze N, Lafaille JJ. Interleukin 2 signaling is required for CD4(+) regulatory T cell function. J Exp Med. 2002; 196:851–57. https://doi.org/10.1084/jem.20020190 [PubMed]
- 52. Paluskievicz CM, Cao X, Abdi R, Zheng P, Liu Y, Bromberg JS. T Regulatory Cells and Priming the Suppressive Tumor Microenvironment. Front Immunol. 2019; 10:2453. https://doi.org/10.3389/fimmu.2019.02453 [PubMed]
- 53. Zhang H, Qin G, Yu H, Han X, Zhu S. Comprehensive genomic and immunophenotypic analysis of CD4 T cell infiltrating human triple-negative breast cancer. Cancer Immunol Immunother. 2021; 70:1649–65. https://doi.org/10.1007/s00262-020-02807-1 [PubMed]
- 54. Ahmadzadeh M, Pasetto A, Jia L, Deniger DC, Stevanović S, Robbins PF, Rosenberg SA. Tumor-infiltrating human CD4+ regulatory T cells display a distinct TCR repertoire and exhibit tumor and neoantigen reactivity. Sci Immunol. 2019; 4:eaao4310. https://doi.org/10.1126/sciimmunol.aao4310 [PubMed]