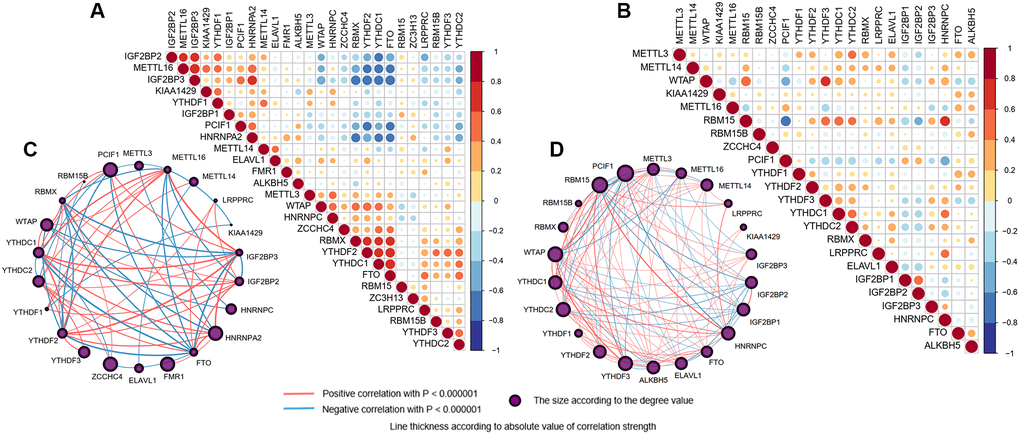
Figure 3.Interaction among m6A RNA methylation regulators. (A, B) Spearman correlation analysis of the 26 m6A methylation regulators in brain (A) and blood (B) samples. Positive correlation was marked with red and negative correlation with blue. (C, D) The interaction between the 26 m6A methylation regulators by constructing PPI network in brain (C) and blood (D) samples, respectively. The circle size was determined by the degree value. The lines linking regulators showed their interactions, and thickness showed the correlation strength between regulators. Positive correlation was marked with red and negative correlation with blue.