


Introduction
Osteosarcoma (OS) is a highly malignant bone cancer and mainly affects children and adolescents [1]. It frequently occurs in a long bone of a limb and the growth plate of a metaphysis [2]. Several risk factors, including alkylating agents, ionizing radiation, and hereditary retinoblastoma, have been reported to promote the initiation of OS [3]. At present, adjuvant therapy, surgical resection, and postoperative chemotherapy are the primary therapeutic modalities for patients with OS; however, the rates of death and metastasis remain high despite the effectiveness of the above approaches [4]. Patients with OS without any local or distant metastasis have a 5-year survival rate of 60%–70%, whereas the 5-year survival rate of patients with OS metastasis is markedly lower, i.e., only <30% [5]. Therefore, comprehensive identification of the mechanisms underlying OS initiation and progression is required for the development of promising therapeutic strategies and improvement of clinical outcomes.
Long noncoding RNAs (lncRNAs) are defined as protein-non-coding transcripts greater than 200 nucleotides in length [6]. Increasing evidence has revealed the important regulatory effects of lncRNAs on various parameters of physiological and pathological processes, especially cancer [7, 8]. In OS, thousands of lncRNAs are differentially expressed and implicated in pathogenesis through various mechanisms: by serving as RNA decoys as well as participating in alternative splicing and epigenetic, transcriptional, and post-transcriptional modifications [9–11]. LncRNAs overexpressed in OS act as oncogenic RNAs, whereas underexpressed lncRNAs have tumor-suppressive effects [12–14]. Accordingly, research on OS-related lncRNAs and the elucidation of their mechanisms of action may reveal potential targets for the diagnosis, prognosis, prevention, and/or treatment of OS. Nevertheless, in comparison with the lncRNAs with known functions in OS, there is a large number of lncRNAs that possibly contribute to the formation and progression of OS but have not yet been clearly identified; these lncRNAs are yet to be studied in-depth.
MicroRNAs (miRNAs) are a group of noncoding short regulatory RNAs, 18–25 nucleotides long [15]. MiRNAs can recognize the 3′-untranslated region (3′-UTR) of target mRNAs and inhibit their expression by suppressing translation and/or promoting mRNA degradation [16]. MiRNAs exert crucial actions in a variety of cellular and molecular biological processes, including carcinogenesis and cancer progression [17]. Changes in the expression of miRNAs are prevalent in almost all human cancer types [18–20]. As for OS, many miRNAs are dysregulated, and their dysregulation serves as a crucial contributing factor for the aggressive characteristics of OS [21–23]. Therefore, a miRNA-based targeted therapy may be a promising strategy against OS.
In recent years, an lncRNA called TTN antisense RNA 1 (TTN-AS1) was reported to be overexpressed and play oncogenic roles in cervical cancer [24], papillary thyroid cancer [25], gastric cancer [26], hepatocellular carcinoma [27], esophageal squamous cell carcinoma [28], and lung adenocarcinoma [29, 30]. Nevertheless, the expression levels and detailed participation of TTN-AS1 in OS have not yet been studied. Herein, we attempted to assess TTN-AS1 expression in OS tumor samples and cell lines to investigate its specific roles in the aggressiveness of OS cells in vitro and in vivo and elucidate its regulatory mechanisms of action.
Results
Upregulation of TTN-AS1 is associated with poor clinical outcomes among patients with OS
To determine the specific role of TTN-AS1 in OS, the expression profile of this lncRNA was examined in 47 pairs of OS tissue samples and adjacent-normal-bone tissue samples. TTN-AS1 was found to be overexpressed in the OS tissue samples relative to the adjacent normal bone tissues, as revealed by reverse-transcription quantitative PCR (RT-qPCR; Figure 1A, P < 0.05). Additionally, the expression of TTN-AS1 was quantified in a panel of OS cell lines (HOS, SAOS-2, MG-63, and U2OS) and in normal osteoblasts (hFOB1.19 cells). The results showed that TTN-AS1 expression was higher in the four tested OS cell lines than in hFOB1.19 cells (Figure 1B, P < 0.05).
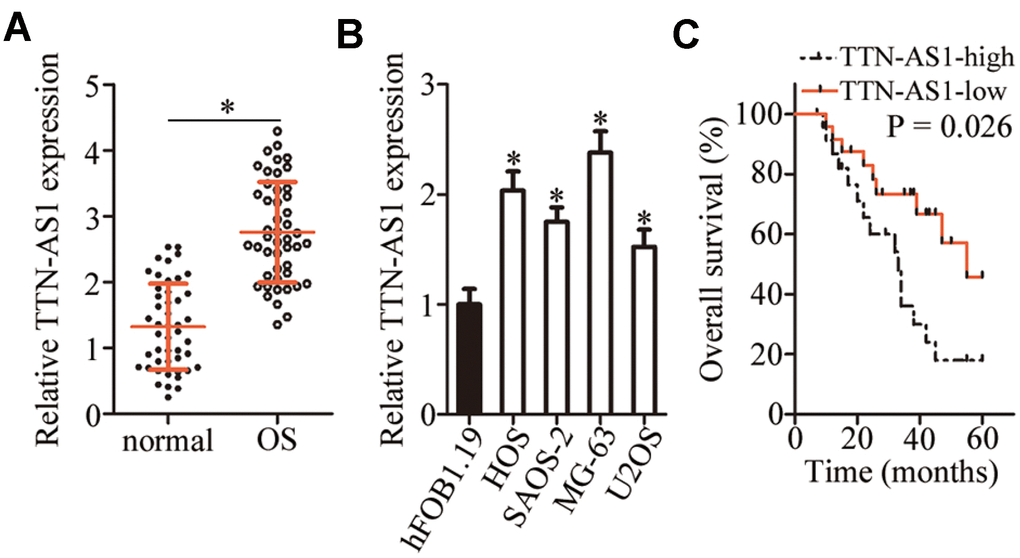
Figure 1. TTN-AS1 is overexpressed in OS tissue samples and cell lines. (A) The expression of TTN-AS1 was analyzed in 47 pairs of OS tissue samples and adjacent normal bone tissues using RT-qPCR. *P < 0.05 vs. the normal bone tissues. (B) RT-qPCR was performed to determine TTN-AS1 expression in four OS cell lines (HOS, SAOS-2, MG-63, and U2OS) and normal osteoblasts (hFOB1.19 cells). *P < 0.05 vs. hFOB1.19 cells. (C) The Kaplan–Meier survival analysis and logrank test were applied to assess the relation between TTN-AS1 levels and the overall survival of patients with OS. The median value of TTN-AS1 expression among the OS tissue samples was chosen as a cutoff. P = 0.026.
To assess the clinical value of TTN-AS1, we first analyzed its correlation with clinical parameters among the patients with OS. The median value of TTN-AS1 expression in OS tissue samples was chosen as the cutoff and, on this basis, all the patients with OS were assigned to either the TTN- AS1 low-expression group or TTN-AS1 high-expression group. The high level of TTN-AS1 manifested a significant association with the clinical stage (P = 0.015; Table 1) and distant metastasis (P = 0.017; Table 1). Notably, patients with OS overexpressing TTN-AS1 showed shorter overall survival than the patients with OS underexpressing TTN-AS1 (Figure 1C, P = 0.026). These results implied that TTN-AS1 may be closely associated with the pathogenesis of OS.
Table 1. The correlation between TTN-AS1 expression level and clinicopathological parameters of patients with osteosarcoma.
| Parameters | TTN-AS1 expression | P value | |
| High (n=24) | Low (n=23) | ||
| Age (years) | 0.724 | ||
| < 18 | 18 | 19 | |
| ≥18 | 6 | 4 | |
| Gender | 0.556 | ||
| Male | 13 | 15 | |
| Female | 11 | 8 | |
| Tumor size (cm) | 0.380 | ||
| < 5 | 16 | 12 | |
| ≥ 5 | 8 | 11 | |
| Clinical staging | 0.015* | ||
| I-II | 11 | 19 | |
| III | 13 | 4 | |
| Distant metastasis | 0.017* | ||
| Absence | 14 | 21 | |
| Presence | 10 | 2 | |
A reduction in TTN-AS1 expression inhibits the malignant characteristics of OS cells in vitro
Having detected the aberrant upregulation of TTN-AS1 in OS, we next attempted to determine the functions of TTN-AS1 in OS progression. Cell lines HOS and MG-63 showed higher TTN-AS1 expression than the other two OS cell lines; accordingly, HOS and MG-63 cells were chosen for subsequent experiments and were transfected with either a small interfering RNA [siRNA] against TTN-AS1 (si-TTN-AS1) or a negative control siRNA (si-NC). TTN-AS1 was successfully knocked down in HOS and MG-63 cells after transfection of si-TTN-AS1 (Figure 2A, P < 0.05). A Cell Counting Kit-8 (CCK-8) assay was performed to evaluate the influence of TTN-AS1 on OS cell proliferation. The si-TTN-AS1 transfection obviously reduced the proliferative ability of HOS and MG-63 cells compared with that in the si-NC group (Figure 2B, P < 0.05). Then, flow cytometric analysis was conducted to test whether si-TTN-AS1 introduction increases OS cell apoptosis. As expected, the proportion of apoptotic cells was greater among HOS and MG-63 cells after transfection with si-TTN-AS1 (Figure 2C, P < 0.05). In addition, Transwell migration and invasion assays revealed that the TTN-AS1 knockdown notably reduced the migration (Figure 2D, P < 0.05) and invasiveness (Figure 2E, P < 0.05) of HOS and MG-63 cells. In general, these findings suggested that the TTN-AS1 downregulation slowed the malignant progression of OS in vitro.
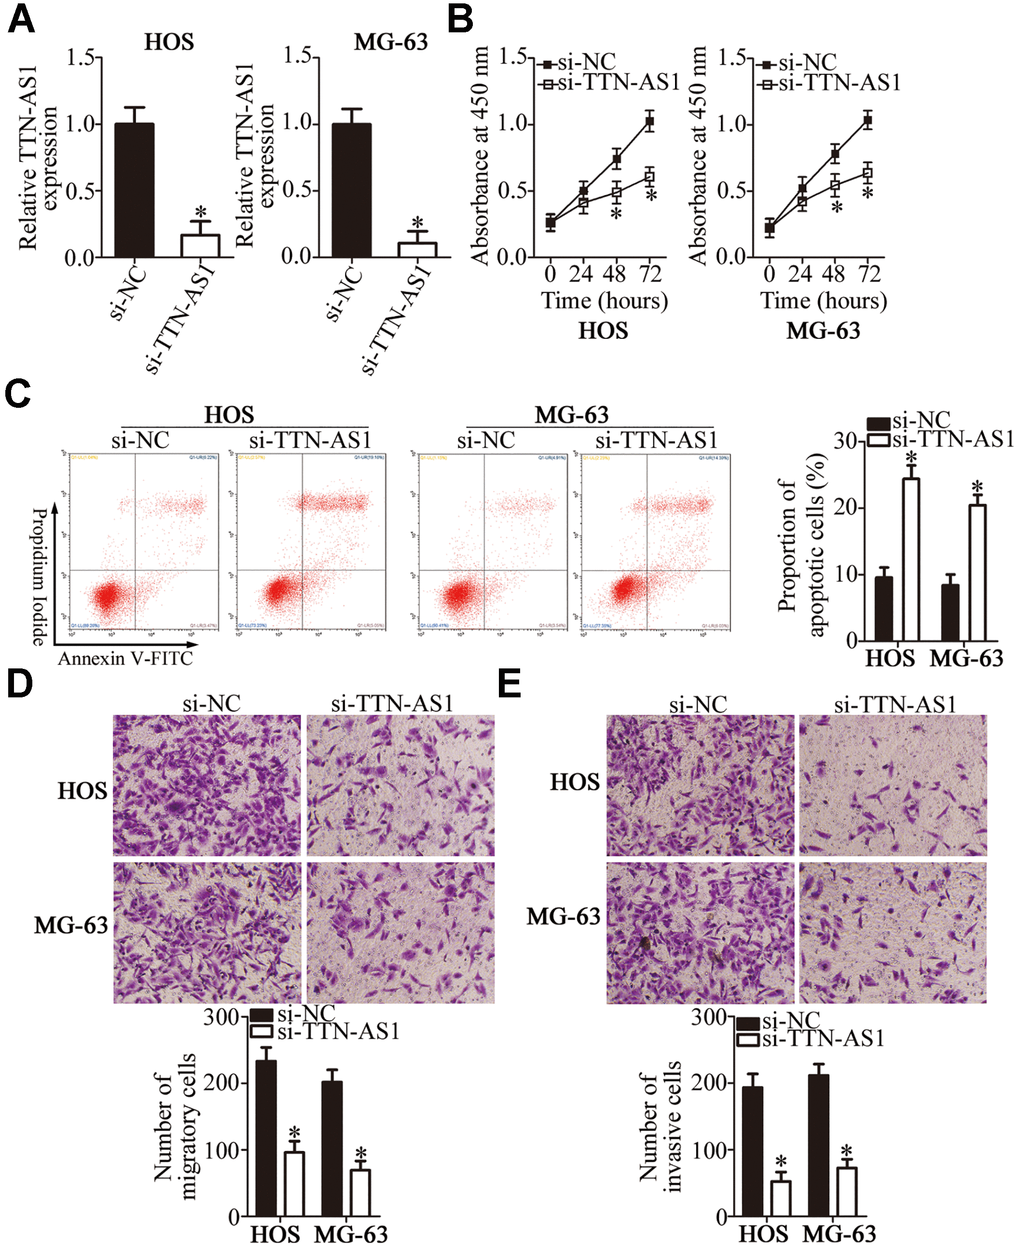
Figure 2. The TTN-AS1 knockdown suppresses the proliferation, migration, and invasiveness but promotes the apoptosis of HOS and MG-63 cells. (A) HOS and MG-63 cells were transfected with either si-TTN-AS1 or si-NC. At 48 h post-transfection, the cells were collected and, then, subjected to RT-qPCR analysis for transfection efficiency evaluation. *P < 0.05 vs. the si-NC group. (B) The CCK-8 assay was conducted to assess cellular proliferation after 0, 24, 48, and 72 h of cultivation of si-TTN-AS1-transfected or si-NC-transfected HOS and MG-63 cells. *P < 0.05 vs. group si-NC. (C) Flow cytometry was performed to determine the apoptotic rate of HOS and MG-63 cells after transfection with either si-TTN-AS1 or si-NC. *P < 0.05 vs. the si-NC group. (D, E) The migratory and invasive abilities of TTN-AS1–deficient HOS and MG-63 cells were analyzed in Transwell migration and invasion assays. *P < 0.05 vs. group si-NC.
TTN-AS1 acts as a competing endogenous RNA (ceRNA) on miR-376a-3p (miR-376a) in OS cells
To investigate the molecular events involved in TTN-AS1–mediated OS progression, a nuclear/cytoplasmic fractionation assay was conducted to determine the distribution of TTN-AS1 inside OS cells. The data indicated that TTN-AS1 is mainly located in the cytoplasm of OS cells (Figure 3A); this finding suggested that this lncRNA may serve as a ceRNA for some miRNA(s) [31]. Herein, the candidate miRNAs that could be inactivated by TTN-AS1 were predicted via starBase 3.0. The results indicated that TTN-AS1 contains one conserved binding site for miR-376a (Figure 3B). Luciferase reporter and RNA immunoprecipitation (RIP) assays were performed to further characterize the relation between TTN-AS1 and miR-376a in OS cells. MiRNA-376a agomir (agomir-376a) transfection-mediated upregulation of miR-376a (Figure 3C, P < 0.05) noticeably decreased the luciferase activity of the TTN-AS1-wt plasmid (the plasmid expressing TTN-AS1 containing the wild-type binding site for miR-376a; P < 0.05); however, the luciferase activity of TTN-AS1-mut (the plasmid expressing TTN-AS1 containing a mutant binding site for miR-376a) was unaffected in both HOS and MG-63 cells when miR-376a was overexpressed, as evidenced by the luciferase reporter assay (Figure 3D). In addition, the findings of the RIP assay indicated that TTN-AS1 and miR-376a were preferentially enriched by an anti-AGO2 antibody after immunoprecipitation in the lysates of HOS and MG-63 cells (Figure 3E, P < 0.05). This finding suggested that miR-376a is a target of TTN-AS1 in OS cells. MiR-376a expression was subsequently measured in the 47 pairs of OS tissue samples and adjacent normal bone tissues by RT-qPCR. MiR-376a was found to be significantly underexpressed in the OS tissue samples (Figure 3F, P < 0.05), and miR-376a levels inversely correlated with TTN-AS1 expression (Figure 3G; r = -0.6751, P < 0.0001). In addition, the expression of miR-376a was evaluated in TTN-AS1–deficient HOS and MG-63 cells. The TTN-AS1 knockdown remarkably upregulated miR-376a in HOS and MG-63 cells (Figure 3H, P < 0.05). Overall, these results meant that TTN-AS1 functions as a ceRNA (molecular sponge) for miR-376a in OS cells.
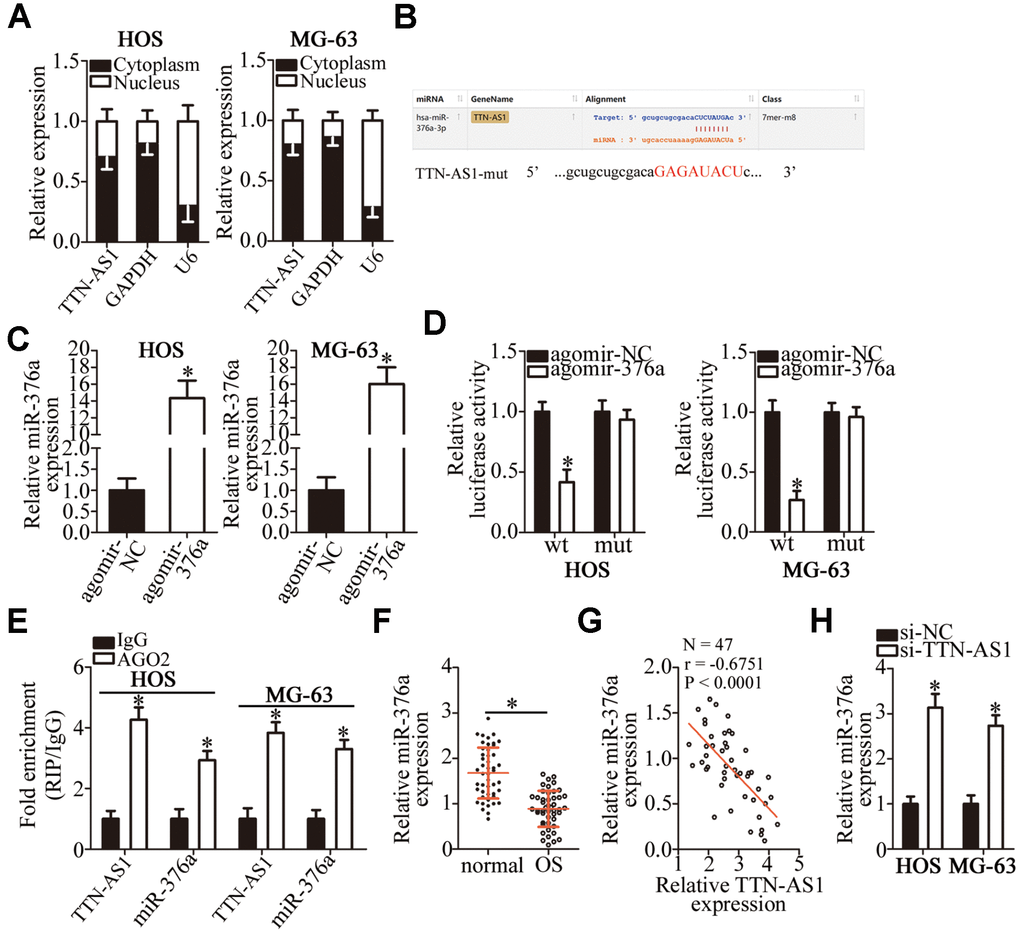
Figure 3. TTN-AS1 functions as a ceRNA for miR-376a in OS cells. (A) The distribution of TTN-AS1 within OS cells was determined by the nuclear/cytoplasmic fractionation assay. (B) The wild-type miR-376a-binding sequences in TTN-AS1, as predicted by starBase 3.0. The mutations in the TTN-AS1 sequence that disrupt the interaction between TTN-AS1 and miR-376a are shown too. (C) HOS and MG-63 cells that were transfected with either agomir-376a or agomir-NC were harvested and analyzed for miR-376a expression by RT-qPCR. *P < 0.05 vs. the agomir-NC group. (D) Luciferase reporter assays were performed on HOS and MG-63 cells that were transfected with either agomir-376a or agomir-NC and either TTN-AS1-wt or TTN-AS1-mut. *P < 0.05 vs. group agomir-NC. (E) The RIP assay was conducted to assess the direct interaction between TTN-AS1 and miR-376a. *P < 0.05 vs. the IgG group. (F) The expression profile of miR-376a in the 47 pairs of OS tissues and adjacent-normal-bone tissue samples was analyzed by RT-qPCR. *P < 0.05 vs. the normal bone tissues. (G) An inverse correlation between TTN-AS1 and miR-376a expression levels was validated in the OS tissue samples by Spearman’s correlation analysis. r = -0.6751, P < 0.0001. (H) Expression of miR-376a in HOS and MG-63 cells transfected with either si-TTN-AS1 or si-NC was determined by RT-qPCR. *P < 0.05 vs. the si-NC group.
MiR-376a acts as a tumor-suppressive miRNA in OS cells
To examine the manner in which miR-376a regulates the malignancy of OS, the HOS and MG-63 cell lines were transfected with either agomir-376a or agomir-NC and, then, subjected to functional experiments. Transfection with agomir-376a appreciably decreased proliferation (Figure 4A, P < 0.05) and increased apoptosis (Figure 4B, P < 0.05) of HOS and MG-63 cells, as revealed by the CCK-8 assay and flow cytometry. Transwell migration and invasion assays showed that, when endogenous miR-376a was overexpressed, HOS and MG-63 cells had weaker migratory (Figure 4C, P < 0.05) and invasive abilities (Figure 4D, P < 0.05). In summary, these data suggested that miR-376a may suppress OS progression.
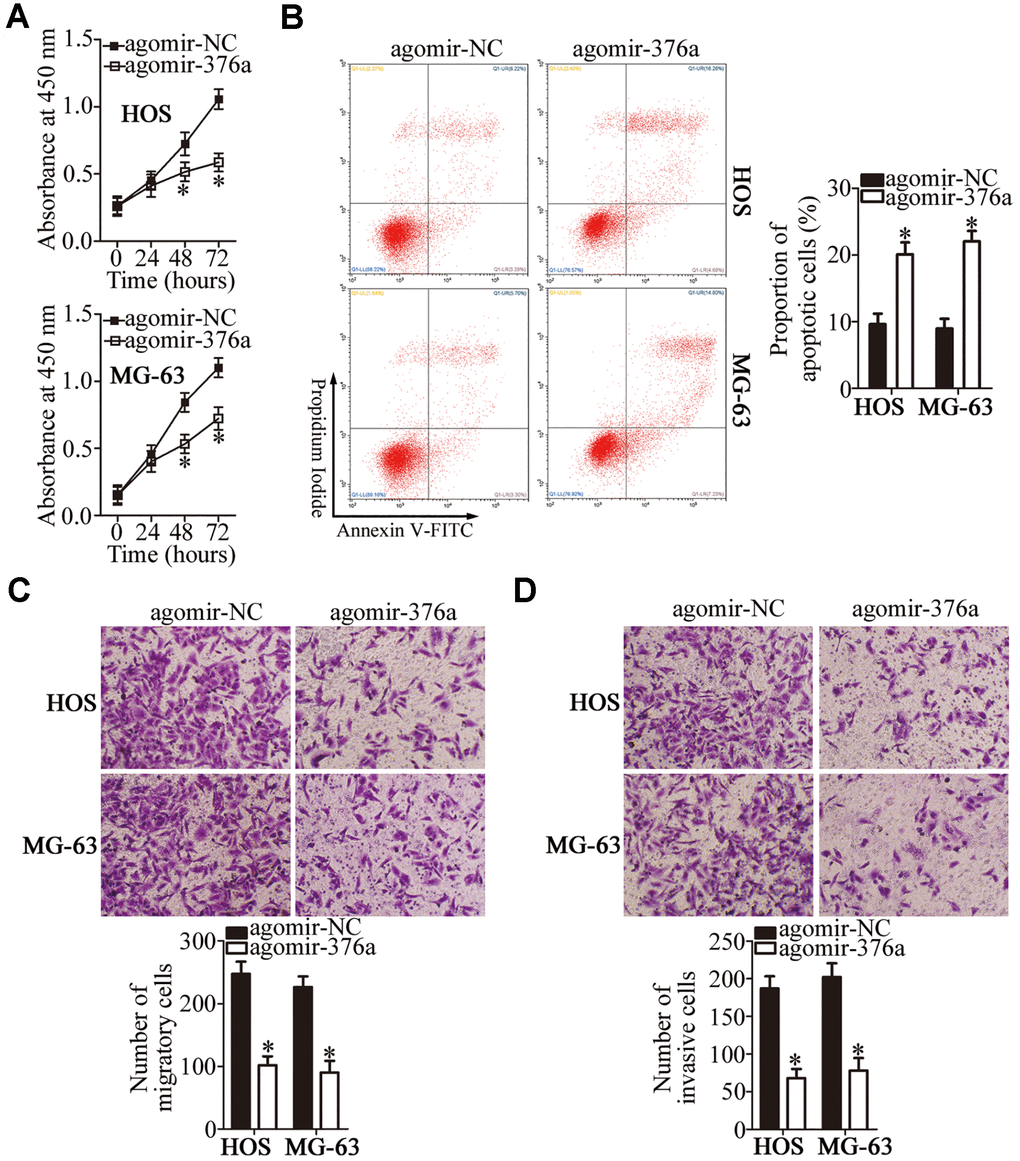
Figure 4. MiR-376a exerts a tumor-suppressive action on the growth and metastasis of HOS and MG-63 cells. (A, B) The CCK-8 assay and flow cytometry uncovered a change in proliferation and apoptosis of miR-376a-overexpressing HOS and MG-63 cells. *P < 0.05 vs. group agomir-NC. (C, D) HOS and MG-63 cells were treated with either agomir-376a or agomir-NC. After the transfection, Transwell migration and invasion assays were carried out. *P < 0.05 vs. group agomir-NC.
DKK1 mRNA is a direct target of miR-376a in OS cells
By means of target prediction tools, including starBase 3.0, TargetScan, and microRNA.org, DKK1 was predicted as a potential target gene of miR-376a (Figure 5A). To validate this prediction, a luciferase reporter assay was performed on HOS and MG-63 cells after cotransfection with either agomir-376a or agomir-NC and either plasmid DKK1-wt (a plasmid expressing luciferase mRNA containing the DKK1 3′-UTR harboring a wild-type binding site for miR-376a) or plasmid DKK1-mut (a plasmid expressing luciferase mRNA containing the DKK1 3′-UTR harboring a mutated binding site for miR-376a). The ectopic expression of miR-376a significantly reduced the luciferase activity of DKK1-wt in HOS and MG-63 cells (P < 0.05). By contrast, mutation of the binding site abrogated this phenomenon (Figure 5B). Next, the expression levels of DKK1 in miR-376a-overexpressing HOS and MG-63 cells were determined to investigate whether DKK1 expression can be inhibited by miR-376a in OS. As expected, the mRNA (Figure 5C, P < 0.05) and protein levels (Figure 5D, P < 0.05) of DKK1 in HOS and MG-63 cells diminished in response to the agomir-376a transfection. To further characterize the correlation between miR-376a and DKK1 in OS, we quantified DKK1 mRNA in the 47 pairs of OS tissue samples and adjacent normal bone tissues. DKK1 was found to be upregulated in the OS tissue samples in comparison with the adjacent normal bone tissues (Figure 5E, P < 0.05). The upregulation of DKK1 mRNA negatively correlated with miR-376a levels among these OS tumor samples (Figure 5F; r = -0.6236, P < 0.0001). Collectively, the above findings identified DKK1 mRNA as a direct target of miR-376a in OS cells.
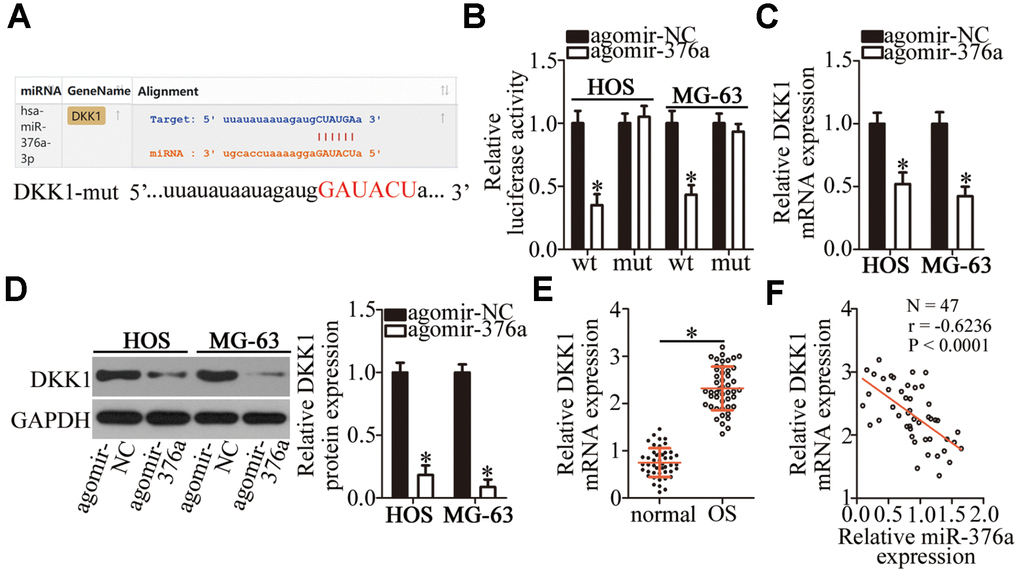
Figure 5. DKK1 mRNA is a direct target of miR-376a in OS cells. (A) MiR-376a and its wild-type binding site in the 3′-UTR of DKK1 mRNA. The mutations were introduced into the site complementary to the seed region of miR-376a. (B) The luciferase reporter assay was performed to test whether the 3′-UTR of DKK1 mRNA could be directly targeted by miR-376a in OS cells. HOS and MG-63 cells were cotransfected with either agomir-376a or agomir-NC and either the DKK1-wt or DKK1-mut plasmid. After 48 h of cultivation, the transfected cells were assayed with the Dual-Luciferase Reporter Assay System to measure the luciferase activity. *P < 0.05 vs. the agomir-NC group. (C, D) Expression levels of DKK1 mRNA and protein in miR-376a-overexpressing HOS and MG-63 cells were respectively determined by RT-qPCR and western blotting. *P < 0.05 vs. the agomir-NC group. (E) RT-qPCR was carried out to measure DKK1 mRNA expression in the 47 pairs of OS tissue samples and adjacent-normal-bone tissue samples. *P < 0.05 vs. the normal bone tissues. (F) Spearman’s correlation analysis confirmed the negative correlation between DKK1 mRNA and miR-376a levels among the OS tissues. r = -0.6236, P < 0.0001.
Restoration of DKK1 expression attenuates miR-376a-induced inhibition of the malignant characteristics of OS cells
Rescue experiments were conducted to confirm the involvement of DKK1 in the tumor-suppressive functions of miR-376a in OS cells. For this purpose, the DKK1-overexpressing plasmid lacking its 3′-UTR (pcDNA3.1-DKK1, hereafter: pc-DKK1) was introduced into miR-376a-overexpressing HOS and MG-63 cells. As presented in Figure 6A, the miR-376a overexpression-mediated decrease in DKK1 protein amounts almost disappeared in HOS and MG-63 cells after cotransfection with pc-DKK1 (P < 0.05). Subsequently, a series of experiments was performed on the HOS and MG-63 cells treated as described above. Restoration of DKK1 expression attenuated the effects of miR-376a overexpression on the proliferation (Figure 6B, P < 0.05), apoptosis (Figure 6C, P < 0.05), migration (Figure 6D, P < 0.05), and invasiveness (Figure 6E, P < 0.05) of HOS and MG-63 cells. These observations confirmed DKK1 downregulation as a functional mediator of miR-376a actions in OS cells.
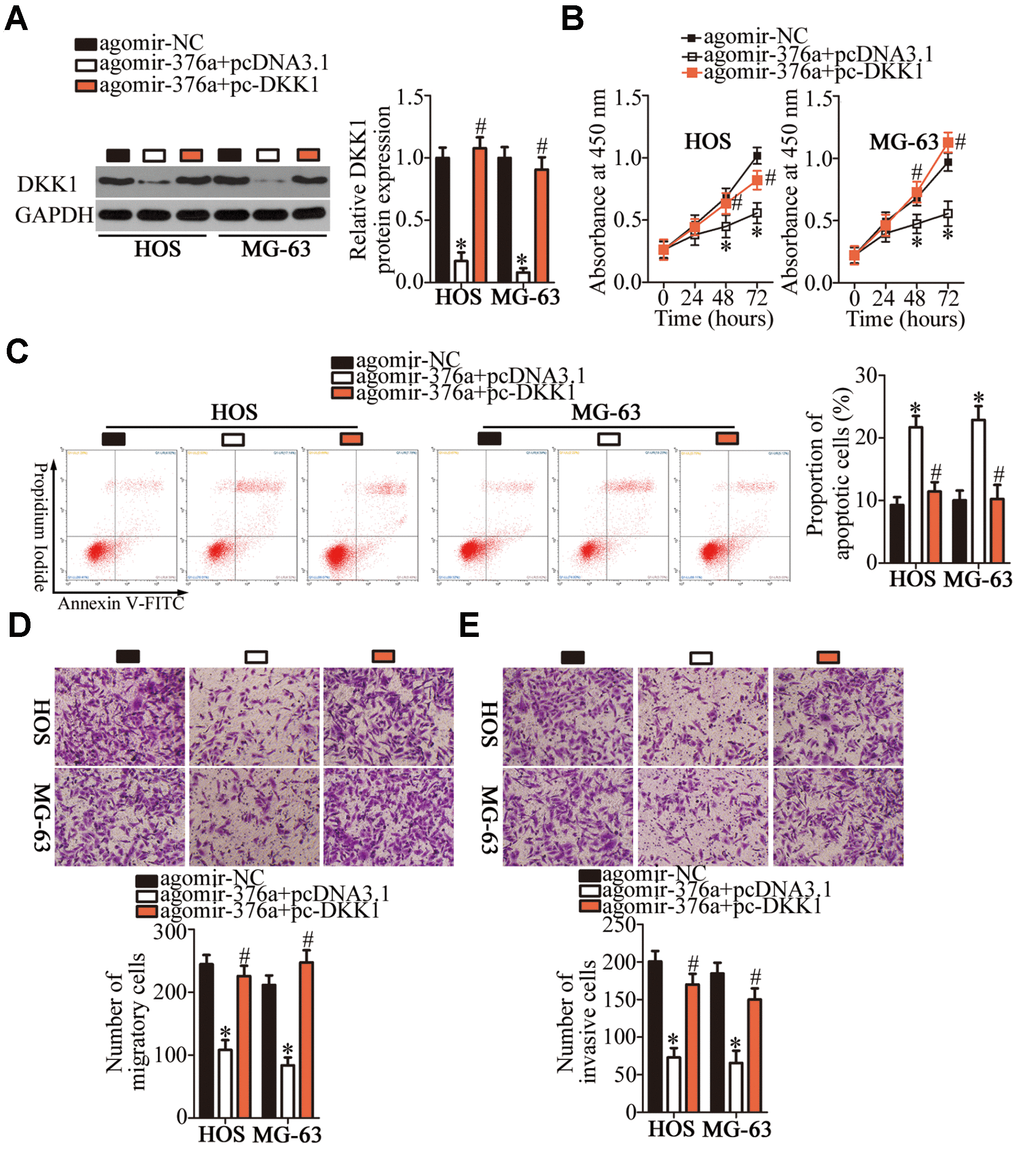
Figure 6. DKK1 reintroduction attenuates miR-376a overexpression-mediated suppression of HOS and MG-63 cell proliferation, migration, and invasion as well as miR-376a overexpression-mediated promotion of apoptosis in vitro. Agomir-376a was cotransfected with either plasmid pc-DKK1 or the empty pcDNA3.1 vector into HOS and MG-63 cells. (A) Total protein was isolated from the transfected cells and, then, subjected to western blotting for DKK1 protein quantification. *P < 0.05 vs. group agomir-MC. #P < 0.05 vs. group agomir-376a+pcDNA3.1. (B–E) The proliferation, apoptosis, migration, and invasiveness of the aforementioned cells were analyzed by the CCK-8 assay, flow cytometry, and Transwell migration and invasion assays, respectively. *P < 0.05 vs. the agomir-MC group. #P < 0.05 vs. group agomir-376a+pcDNA3.1.
TTN-AS1 enhances the malignant characteristics of OS cells in vitro through the miR-376a–DKK1 axis
To test whether the oncogenic effects of TTN-AS1 on the malignancy of OS cells were mediated by its influence on the miR-376a–DKK1 pathway, rescue experiments were performed on TTN-AS1-deficient HOS and MG-63 cells via transfection with miR-376a antagomir (antagomir-376a). First, the transfection efficiency of antagomir-376a was assessed by RT-qPCR. MiR-376a expression was found to be efficiently silenced in HOS and MG-63 cells after the transfection with antagomir-376a (Figure 7A, P < 0.05). The increase in miR-376a expression (via agomir-376a; Figure 7B, P < 0.05) and the downregulation of the DKK1 protein (Figure 7C, P < 0.05) caused by the TTN-AS1 knockdown in HOS and MG-63 cells were partially reversed after cotransfection with antagomir-376a. Furthermore, the recovery of miR-376a and DKK1 expression counteracted the impact of the TTN-AS1 knockdown on the proliferation (Figure 7D, P < 0.05), apoptosis (Figure 7E, P < 0.05), migration (Figure 7F, P < 0.05), and invasiveness (Figure 7G, P < 0.05) of HOS and MG-63 cells. These data revealed that the TTN-AS1 knockdown reduced the malignancy of OS cells in vitro by decreasing the sponging of miR-376a by TTN-AS1 and, thereby, reducing DKK1 expression.
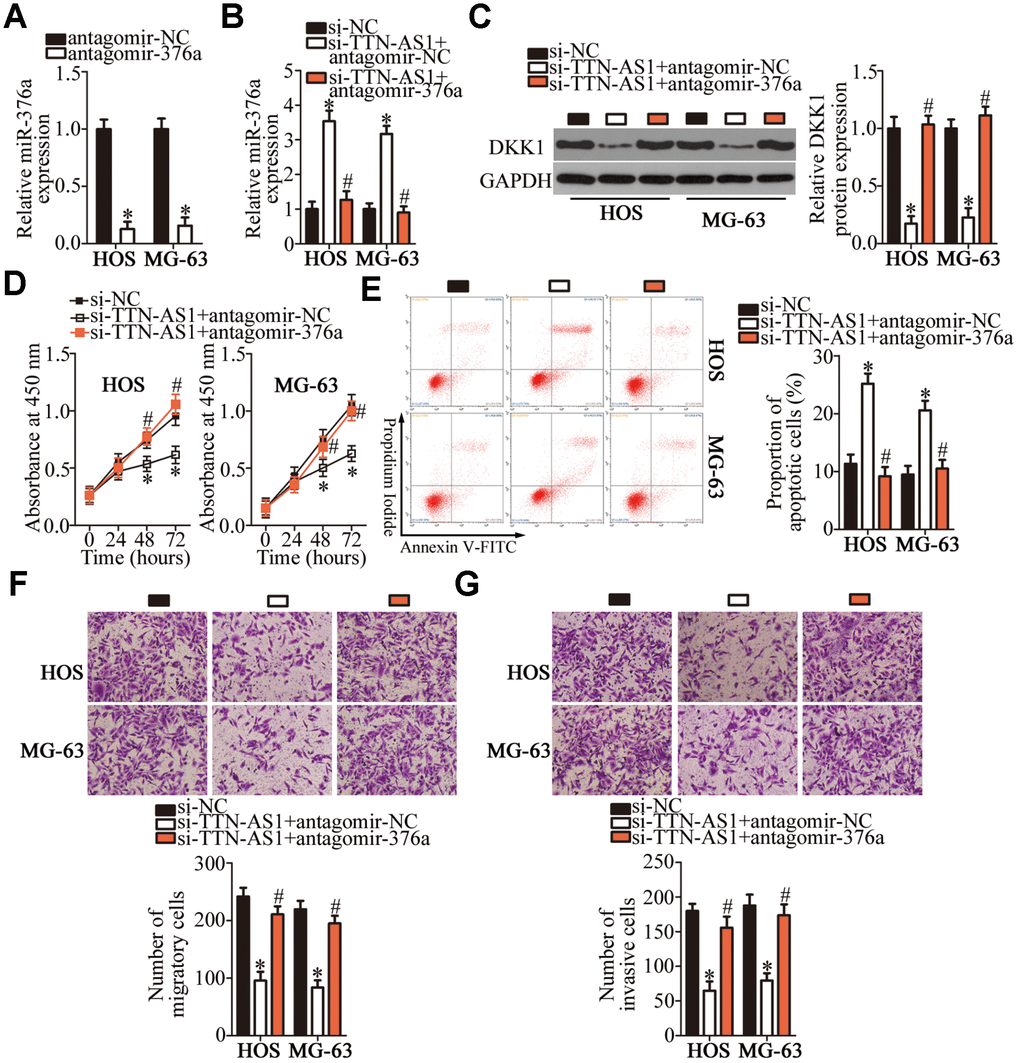
Figure 7. TTN-AS1 enhances HOS and MG-63 cell proliferation, migration, and invasion and inhibits their apoptosis, via the miR-376a–DKK1 axis. (A) Either antagomir-376a or antagomir-NC was introduced into HOS and MG-63 cells. The transfection efficiency was assessed through RT-qPCR. *P < 0.05 vs. the antagomir-NC group. (B, C) Si-TTN-AS1 in combination with either antagomir-376a or antagomir-NC was transfected into HOS and MG-63 cells. After 48 h transfection, expression levels of the DKK1 protein and miR-376a were determined respectively by western blotting and RT-qPCR. *P < 0.05 vs. group si-NC. #P < 0.05 vs. group si-TTN-AS1+antagomir-NC. (D) The CCK-8 assay was conducted to evaluate the proliferative ability of HOS and MG-63 cells after cotransfection with si-TTN-AS1 and either antagomir-376a or antagomir-NC. *P < 0.05 vs. the si-NC group. #P < 0.05 vs. group si-TTN-AS1+antagomir-NC. (E) The proportion of apoptotic HOS or MG-63 cells that were cotransfected with either antagomir-376a or antagomir-NC and si-TTN-AS1 was determined via flow cytometry. *P < 0.05 vs. the si-NC group. #P < 0.05 vs. group si-TTN-AS1+antagomir-NC. (F, G) Transwell migration and invasion assays were conducted to evaluate the migratory and invasive abilities of HOS and MG-63 cells treated as described above. *P < 0.05 vs. the si-NC group. #P < 0.05 vs. group si-TTN-AS1+antagomir-NC.
The TTN-AS1 knockdown inhibits the in vivo tumor growth of OS cells
Xenograft tumors were induced to test whether there is a similar influence of TTN-AS1 on tumor growth in vivo as in the above experiments in vitro. HOS cells transfected with either si-TTN-AS1 or si-NC were subcutaneously injected into a flank of nude mice. At 28 days postinoculation, the tumor growth curve indicated that the growth of tumor xenografts was much slower in the si-TTN-AS1 group than in the si-NC group (Figure 8A and 8B, P < 0.05). At the end of this experiment, all the mice were euthanized and the tumor xenografts were excised and weighed. The weight of the tumor xenografts derived from si-TTN-AS1–transfected HOS cells was obviously lower (Figure 8C, P < 0.05). Additionally, TTN-AS1 expression was still low in the tumor xenografts from the si-TTN-AS1 group (Figure 8D, P < 0.05). The expression of miR-376a was higher (Figure 8E, P < 0.05), whereas the protein expression of DKK1 was lower (Figure 8F, P < 0.05), in the si-TTN-AS1 group than in the si-NC group. These results indicated that the downregulation of TTN-AS1 retarded the in vivo tumor growth of OS cells by decreasing the output of the miR-376a–DKK1 axis.
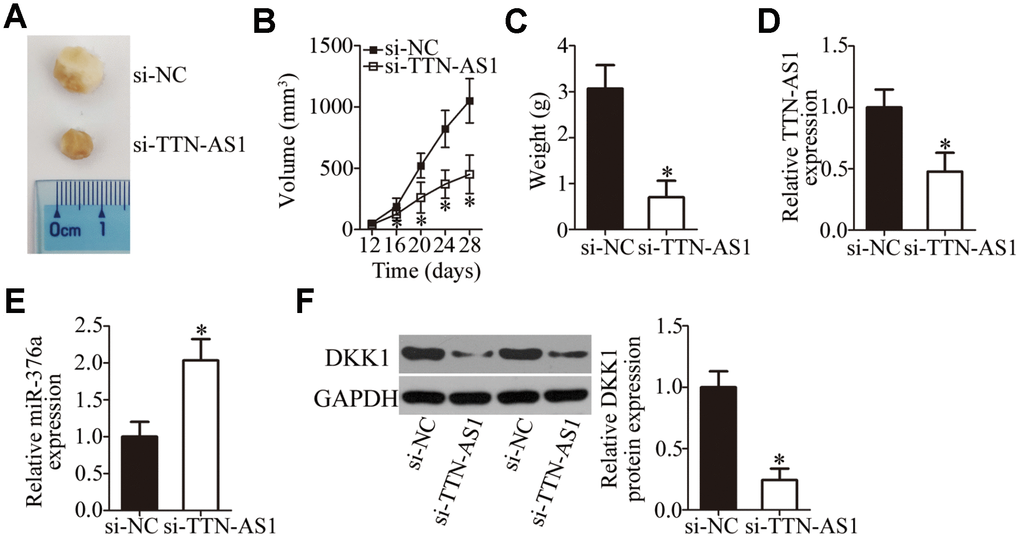
Figure 8. TTN-AS1 downregulation restricts tumor growth of OS cells in vivo. (A) Representative images captured at 4 weeks after subcutaneous injection of si-TTN-AS1-transfected or si-NC-transfected HOS cells into the flank of nude mice. (B) Tumor growth curves show that tumors grew significantly more slowly in the si-TTN-AS1 group than in the si-NC group. *P < 0.05 vs. group si-NC. (C) The average weight of tumor xenografts collected in groups si-TTN-AS1 and si-NC was analyzed at 4 weeks after the inoculation. *P < 0.05 vs. the si-NC group. (D, E) The expression levels of TTN-AS1 and miR-376a in the tumor xenografts were measured by RT-qPCR. *P < 0.05 vs. group si-NC. (F) DKK1 protein expression was measured in the tumor xenografts by western blotting. *P < 0.05 vs. the si-NC group.
Discussion
To date, numerous studies have revealed alterations in the expression of lncRNAs in OS [32–34]. The dysregulation of lncRNAs is proven to strongly influence the initiation and progression of OS by playing either a tumor-suppressive or oncogenic role [35]. Therefore, determination of the specific functions of lncRNA in OS is urgently needed for the identification and validation of novel diagnostic biomarkers of (and therapeutic targets in) OS. In this study, we first tested whether TTN-AS1 is dysregulated in OS and clarified the clinical value of TTN-AS1. Second, we used siRNA to knock down endogenous TTN-AS1 in OS cell lines, to study the influence of this TTN-AS1 knockdown on the malignant characteristics of OS cells in vitro and in vivo. Third, the mechanisms underlying the participation of TTN-AS1 in OS were elucidated in detail.
TTN-AS1 is overexpressed in cervical cancer, and its upregulation obviously correlates with the International Federation of Gynecology and Obstetrics (FIGO) stage, poor differentiation, and lymph node metastasis [24]. Patients with cervical cancer overexpressing TTN-AS1 have worse clinical outcomes than patients with cervical cancer underexpressing TTN-AS1 [24]. The expression of TTN-AS1 is high in papillary thyroid cancer, implying a close association with lymphatic metastasis, TNM stage, and overall survival [25]. Additionally, TTN-AS1 is overexpressed in gastric cancer tissues and cell lines; this overexpression negatively correlates with overall survival of these patients [26]. Moreover, the overexpression of TTN-AS1 is implicated in many tumor types including hepatocellular carcinoma [27], esophageal squamous cell carcinoma [28], and lung adenocarcinoma [29, 30]. Nevertheless, the expression of TTN-AS1 in OS has not yet been studied. In this work, we found that TTN-AS1 is upregulated in both OS tumors and cell lines. TTN-AS1 overexpression significantly correlated with the clinical stage and distant metastasis among the patients with OS. Notably, the patients with OS overexpressing TTN-AS1 showed substantially shorter overall survival compared to the patients with OS underexpressing TTN-AS1. These observations suggest that TTN-AS1 may be an effective biomarker for the diagnosis and prognosis of OS.
TTN-AS1 has been identified elsewhere as an oncogenic lncRNA during carcinogenesis and cancer progression. For instance, silencing of TTN-AS1 expression inhibits cervical cancer cell proliferation and invasion both in vitro and in vivo by regulating the miR-573–E2F3 pathway [24]. In papillary thyroid cancer, TTN-AS1 serves as a ceRNA for miR-155-3p and facilitates the expression of zinc and ring finger 2, thus, promoting cellular proliferation, migration, invasion, and epithelial–mesenchymal transition [25]. TTN-AS1 promotes the proliferation, migration, invasiveness, and epithelial–mesenchymal transition of esophageal squamous cell carcinoma cells by acting as a ceRNA on miR-133b, thereby, increasing fascin 1 expression [28]. Besides, TTN-AS1 promotes the malignancy of gastric cancer [26], hepatocellular carcinoma [27], and lung adenocarcinoma [29, 30]. In contrast, studies on the detailed functions of TTN-AS1 in OS are rare. In this study, we found that the TTN-AS1 knockdown restricted the proliferation, migration, and invasiveness of OS cells in vitro; increased their apoptosis in vitro; and slowed their tumor growth in vivo.
Subsequently, we elucidated the molecular mechanisms underlying the oncogenic actions of TTN-AS1 in OS. In recent years, studies revealed that lncRNAs perform their functions by acting as ceRNAs or molecular sponges to inactivate miRNAs. Herein, our data provide reliable evidence that TTN-AS1 serves as a ceRNA for miR-376a. MiR-376a is frequently reported to be upregulated in ovarian cancer [36] and downregulated in renal cell carcinoma [37], gastric cancer [38], and breast cancer [39]. MiR-376a is underexpressed in OS tumors and cell lines [40]. Its upregulation inhibits OS cell proliferation and invasion in vitro but promotes apoptosis [40]. In terms of the mechanism, F-box protein 11 mRNA is proved to be a direct target of miR-376a in OS [40]. Our results on the expression and functions of miR-376a in OS are consistent with these observations. Another important finding of this study is that the tumor-suppressive activity of miR-376a in OS is due to DKK1 downregulation. DKK1, a key factor in bone metabolism and homeostasis, is closely related to the malignancy of OS and helps to maintain or increase cellular proliferation, colony formation, metastasis, and tumorigenesis while reducing apoptosis [41–44]. Consequently, targeting the TTN-AS1–miR-376a–DKK1 pathway might be an innovative strategy to treat patients with OS.
In conclusion, we demonstrated that TTN-AS1 is overexpressed in OS and associated with poor clinical outcomes. Moreover, this study is the first to reveal that TTN-AS1 enhances the malignant characteristics of OS cells in vitro and in vivo. As for the mechanism, for the first time, TTN-AS1 is reported here to act as a ceRNA on miR-376a, thereby, upregulating DKK1 in OS. These findings may offer a novel theoretical and experimental explanation for OS progression and should help to find attractive therapeutic targets in OS.
Methods
Ethics statement
Investigation has been conducted in compliance with the principles of the Declaration of Helsinki and according to national and international guidelines and has been approved by the authors' institutional review board. The study protocol was approved by the Ethics Committee of Liaoning Cancer Hospital & Institute. Informed consent has been obtained from all patients.
Clinical tissues and cell lines
Primary OS tissue samples and adjacent normal bone tissues were obtained from 47 patients who underwent surgical resection at the Liaoning Cancer Hospital & Institute. None of the patients had received preoperative chemotherapy, radiotherapy, or other anticancer modalities. After the resection, the tissue samples were immediately frozen in liquid nitrogen and, then, stored in liquid nitrogen until subsequent treatment and analysis.
Four OS cell lines—HOS, SAOS-2, MG-63, and U2OS—as well as normal osteoblasts (hFOB1.19 cells) were bought from the Shanghai Institute of Biochemistry and Cell Biology (Shanghai, China). All the cells were cultured at 37°C in a humidified atmosphere containing 5% of CO2 in Dulbecco’s Modified Eagle’s Medium (DMEM) supplemented with 10% of fetal bovine serum (FBS),100 U/ml penicillin, and 100 μg/ml streptomycin (all from Gibco, Invitrogen Life Technologies, Carlsbad, CA, USA).
Oligonucleotides, construction of plasmids, and cell transfection
The siRNA specifically decreasing the expression of TTN-AS1 (called si-TTN-AS1) and its negative control siRNA (si-NC) were designed and commercially synthesized by RiboBio Co., Ltd. (Guangzhou, China). Agomir-376a, the corresponding agomir-NC, antagomir-376a, and antagomir-NC were acquired from the GenePharma Co., Ltd. (Shanghai, China). The full-length DKK1 sequence lacking its 3′-UTR was amplified by the GenePharma Co., Ltd., too, and subcloned into the pcDNA3.1 vector to generate the pc-DKK1 plasmid. The empty pcDNA3.1 vector served as the control. Cells were seeded in 6-well plates and transfected with the agomir (50 nM), antagomir (50 nM), siRNA (100 pmol) or plasmid (4 μg) using the Lipofectamine® 2000 reagent (Invitrogen; Thermo Fisher Scientific, Inc.). The transfected cells were processed for further in vitro experiments after incubation for different periods.
RNA isolation and RT-qPCR
The TRIzol® Reagent (Invitrogen; Thermo Fisher Scientific, Inc.) was used to isolate total RNA form tissue samples or cells. The miScript Reverse Transcription Kit was purchased from Qiagen GmbH (Hilden, Germany) and, then, used for the synthesis of cDNA from the total RNA. After reverse transcription, qPCR was performed using the miScript SYBR Green PCR Kit (Qiagen GmbH) to determine miR-376a expression. This expression was determined in relation to U6 small nuclear RNA. To quantitate TTN-AS1 and DKK1 expression, the synthesis of cDNA was performed using the PrimeScript RT-Reagent Kit (Takara Bio, Kusatsu, Japan), followed by qPCR with the SYBR Premix Ex Taq™ Kit (Takara Bio). Expression levels of TTN-AS1 and DKK1 were normalized to GAPDH. All the data were analyzed by the 2−ΔΔCq method.
CCK-8 assay
In 96-well plates, after 24 h transfection, cells were maintained in 10% FBS-supplemented DMEM for 0, 24, 48, or 72 h. At every time point, 10 μl of the CCK-8 solution (Dojindo Laboratories, Kumamoto, Japan) was added into each well, and the cells were incubated further at 37°C for 2 h. Optical density was measured at 450 nm wavelength on a Sunrise™ microplate reader (Tecan Group, Ltd., Mannedorf, Switzerland).
Apoptosis measurement by flow cytometry
Transfected cells in 6-well plates were harvested at 48 h post-transfection. Next, they were washed in ice-cold phosphate-buffered saline and the apoptosis rate was analyzed via the Annexin V–Fluorescein Isothiocyanate (FITC) Apoptosis Detection Kit (Biolegend, San Diego, CA, USA). The transfected cells were resuspended in 100 μl of Annexin-V-binding buffer that was supplemented with 5 μl of Annexin V–FITC and 5 μl of a propidium iodide solution. After 15 min incubation at room temperature in the dark, the proportion of apoptotic cells was determined on a flow cytometer (FACScan; BD Biosciences, Franklin Lakes, NJ, USA).
Transwell migration and invasion assays
Cell migratory capacity was analyzed in Transwell chambers (8.0 μm pore size; BD Biosciences, Franklin Lakes, NJ, USA), whereas Matrigel (BD Biosciences)-coated Transwell chambers were used for assessing cell invasiveness. Briefly, 200 μl of a cell suspension containing 5 ×10⁴ cells was added to the top chambers. The lower compartments were covered with DMEM supplemented with 20% of FBS, which served as the chemoattractant. After 24 h incubation, the nonmigratory cells and noninvasive cells were gently removed with cotton swabs. The cells located on the lower side of the chamber were fixed in 4% paraformaldehyde and stained with 0.5% crystal violet. Finally, the migratory and invasive abilities were assessed via counting of the respective migratory and invasive cells in five randomly selected visual fields in images that were captured by a CKX41 inverted microscope (Olympus Corp., Tokyo, Japan).
Tumor xenograft experiment
A total of 8 six-week-old female BALB/c nude mice were purchased from Better Biotechnology Co., Ltd. (Nanjing, China). All the animal procedures were approved by the Institutional Animal Care and Use Committee of Jilin University and carried out in compliance with the Animal Protection Law of the People’s Republic of China-2009 for experimental animals. Si-TTN-AS1-transfected or si-NC-transfected HOS cells (1 × 10⁷) were resuspended in 100 μl of phosphate-buffered saline and inoculated subcutaneously into the flank of nude mice (n=4 for each group). The tumor size was recorded every 4 days, and tumor volume was calculated using the following formula: tumor volume = 1/2 × tumor length × tumor width2. After 4 weeks, all the mice were euthanized by cervical dislocation, and their tumor xenografts were excised and weighed.
Nuclear/cytoplasmic fractionation
The PARIS Kit (Invitrogen; Thermo Fisher Scientific, Inc.) was used to isolate the cytoplasmic and nuclear fractions.
RIP assay
The binding of miR-376a to TTN-AS1 was assessed by means of the Magna RIP RNA-Binding Protein Immunoprecipitation Kit (Millipore Inc., Billerica, MA, USA). In brief, cells were incubated with RIP buffer containing magnetic beads coated with either the antibody to AGO2 or with control IgG. Subsequently, extraction of coprecipitated RNA was performed and the RNA was subjected to RT-qPCR analysis.
Bioinformatics prediction and luciferase reporter assay
A target prediction tool, starBase 3.0 (http://starbase.sysu.edu.cn/), was used to search for potential miRNAs that could be inactivated by TTN-AS1. The target genes (mRNAs to be precise) of miR-376a were predicted by means of three miRNA target prediction databases: starBase 3.0, TargetScan (http://www.targetscan.org/), and microRNA.org (http://www.microrna.org/microrna/).
The DKK1 3′-UTRs containing either the wild-type (wt) binding sequence or the mutant (mut) binding sequence for miR-376a were synthesized by GenePharma Co., Ltd., and inserted into the pmirGLO luciferase reporter vector (Promega, Madison, WI, USA). The resultant plasmids are referred to as DKK1-wt and DKK1-mut, respectively. The TTN-AS1-wt and TTN-AS1-mut reporter plasmids were generated by similar experimental procedures. Either agomir-376a or agomir-NC was cotransfected into cells with either a “wt” or “mut” reporter plasmid using the Lipofectamine® 2000 reagent. Luciferase activity was determined 48 h after the transfection using a Dual-Luciferase Reporter Assay System (Promega, Madison, WI, USA). Renilla luciferase activity was normalized to that of firefly luciferase.
Western blotting analysis
Total protein was isolated by means of the RIPA buffer (Beyotime Institute of Biotechnology, Shanghai, China). The Bicinchoninic Acid Protein Assay Kit (Beyotime Institute of Biotechnology, Shanghai, China) was used to quantify the protein concentration. The protein samples were resolved by SDS-PAGE on a 10% gel and transferred onto polyvinylidene difluoride membranes, followed by 2 h blocking with 5% fat-free milk diluted in Tris-buffered saline containing 0.1% of Tween 20 (TBST). After incubation with a primary antibody against DKK1 (cat. No. ab109416; dilution 1:1,000; Abcam, Cambridge, UK) or against GAPDH (cat. No. ab181603; dilution 1:1,000; Abcam), the membranes were washed thrice with TBST, probed with a goat anti-rabbit immunoglobulin G antibody conjugated with horseradish peroxidase (cat. No. ab205718; dilution 1:5,000; Abcam) (secondary antibody) and, then, treated with the Pierce™ ECL Western Blotting Substrate (Pierce; Thermo Fisher Scientific, Inc.) for visualization of the protein signals.
Statistical analysis
Data are expressed as the mean ± standard deviation (SD) of at least three independent experiments. The correlation between TTN-AS1 expression and clinical parameters among the patients with OS was examined with the χ2 test. Spearman’s correlation analysis was conducted to determine the correlation between TTN-AS1 and miR-376a expression levels in OS tissue samples. The overall-survival curve was analyzed by the Kaplan–Meier method and compared between groups by the log-rank test. The comparisons between two groups were performed by Student’s t test; one-way analysis of variance, followed by the Student–Newman–Keuls test, was applied to evaluate the differences among multiple groups. Data with P < 0.05 were considered statistically significant.
Conflicts of Interest
The authors declare no conflicts of interest.
References
- 1. Mirabello L, Troisi RJ, Savage SA. Osteosarcoma incidence and survival rates from 1973 to 2004: data from the Surveillance, Epidemiology, and End Results Program. Cancer. 2009; 115:1531–43. https://doi.org/10.1002/cncr.24121 [PubMed]
- 2. Morris CD, Teot LA, Bernstein ML, Marina N, Krailo MD, Villaluna D, Janeway KA, DuBois SG, Gorlick RG, Randall RL. Assessment of extent of surgical resection of primary high-grade osteosarcoma by treating institutions: A report from the Children’s Oncology Group. J Surg Oncol. 2016; 113:351–54. https://doi.org/10.1002/jso.24145 [PubMed]
- 3. Xie X, Li YS, Xiao WF, Deng ZH, He HB, Liu Q, Luo W. MicroRNA-379 inhibits the proliferation, migration and invasion of human osteosarcoma cells by targetting EIF4G2. Biosci Rep. 2017; 37:37. https://doi.org/10.1042/BSR20160542 [PubMed]
- 4. Zheng W, Huang Y, Chen H, Wang N, Xiao W, Liang Y, Jiang X, Su W, Wen S. Nomogram application to predict overall and cancer-specific survival in osteosarcoma. Cancer Manag Res. 2018; 10:5439–50. https://doi.org/10.2147/CMAR.S177945 [PubMed]
- 5. Adamopoulos C, Gargalionis AN, Basdra EK, Papavassiliou AG. Deciphering signaling networks in osteosarcoma pathobiology. Exp Biol Med (Maywood). 2016; 241:1296–305. https://doi.org/10.1177/1535370216648806 [PubMed]
- 6. Nagano T, Fraser P. No-nonsense functions for long noncoding RNAs. Cell. 2011; 145:178–81. https://doi.org/10.1016/j.cell.2011.03.014 [PubMed]
- 7. Tehrani SS, Karimian A, Parsian H, Majidinia M, Yousefi B. Multiple Functions of Long Non-Coding RNAs in Oxidative Stress, DNA Damage Response and Cancer Progression. J Cell Biochem. 2018; 119:223–36. https://doi.org/10.1002/jcb.26217 [PubMed]
- 8. Wilusz JE, Sunwoo H, Spector DL. Long noncoding RNAs: functional surprises from the RNA world. Genes Dev. 2009; 23:1494–504. https://doi.org/10.1101/gad.1800909 [PubMed]
- 9. Ju C, Zhou R, Sun J, Zhang F, Tang X, Chen KK, Zhao J, Lan X, Lin S, Zhang Z, Lv XB. LncRNA SNHG5 promotes the progression of osteosarcoma by sponging the miR-212-3p/SGK3 axis. Cancer Cell Int. 2018; 18:141. https://doi.org/10.1186/s12935-018-0641-9 [PubMed]
- 10. Yu X, Pang L, Yang T, Liu P. lncRNA LINC01296 regulates the proliferation, metastasis and cell cycle of osteosarcoma through cyclin D1. Oncol Rep. 2018; 40:2507–14. https://doi.org/10.3892/or.2018.6674 [PubMed]
- 11. Xu R, Feng F, Yu X, Liu Z, Lao L. LncRNA SNHG4 promotes tumour growth by sponging miR-224-3p and predicts poor survival and recurrence in human osteosarcoma. Cell Prolif. 2018; 51:e12515. https://doi.org/10.1111/cpr.12515 [PubMed]
- 12. Li P, Huang R, Huang T, Cheng S, Chen Y, Wang Z. Long non-coding RNA NEAT1 promotes proliferation, migration and invasion of human osteosarcoma cells. Int J Med Sci. 2018; 15:1227–34. https://doi.org/10.7150/ijms.25662 [PubMed]
- 13. Wang W, Luo P, Guo W, Shi Y, Xu D, Zheng H, Jia L. LncRNA SNHG20 knockdown suppresses the osteosarcoma tumorigenesis through the mitochondrial apoptosis pathway by miR-139/RUNX2 axis. Biochem Biophys Res Commun. 2018; 503:1927–33. https://doi.org/10.1016/j.bbrc.2018.07.137 [PubMed]
- 14. Wang Y, Zhao Z, Zhang S, Li Z, Li D, Yang S, Zhang H, Zeng X, Liu J. LncRNA FAL1 is a negative prognostic biomarker and exhibits pro-oncogenic function in osteosarcoma. J Cell Biochem. 2018; 119:8481–89. https://doi.org/10.1002/jcb.27074 [PubMed]
- 15. Bartel DP. MicroRNAs: genomics, biogenesis, mechanism, and function. Cell. 2004; 116:281–97. https://doi.org/10.1016/S0092-8674(04)00045-5 [PubMed]
- 16. Friedman JM, Jones PA. MicroRNAs: critical mediators of differentiation, development and disease. Swiss Med Wkly. 2009; 139:466–72. [PubMed]
- 17. Singh DK, Bose S, Kumar S. Role of microRNA in regulating cell signaling pathways, cell cycle, and apoptosis in non-small cell lung cancer. Curr Mol Med. 2016; 16:474–86. https://doi.org/10.2174/1566524016666160429120702 [PubMed]
- 18. Lv DB, Zhang JY, Gao K, Yu ZH, Sheng WC, Yang G, Gao YZ. MicroRNA-765 targets MTUS1 to promote the progression of osteosarcoma via mediating ERK/EMT pathway. Eur Rev Med Pharmacol Sci. 2019; 23:4618–28. [PubMed]
- 19. Wang H, Zhao F, Cai S, Pu Y. MiR-193a regulates chemoresistance of human osteosarcoma cells via repression of IRS2. J Bone Oncol. 2019; 17:100241. https://doi.org/10.1016/j.jbo.2019.100241 [PubMed]
- 20. Xia P, Gu R, Zhang W, Shao L, Li F, Wu C, Sun Y. MicroRNA-377 exerts a potent suppressive role in osteosarcoma through the involvement of the histone acetyltransferase 1-mediated Wnt axis. J Cell Physiol. 2019; 234:22787–98. https://doi.org/10.1002/jcp.28843 [PubMed]
- 21. Sasaki R, Osaki M, Okada F. MicroRNA-Based Diagnosis and Treatment of Metastatic Human Osteosarcoma. Cancers (Basel). 2019; 11:11. https://doi.org/10.3390/cancers11040553 [PubMed]
- 22. Kim YH, Goh TS, Lee CS, Oh SO, Kim JI, Jeung SH, Pak K. Prognostic value of microRNAs in osteosarcoma: A meta-analysis. Oncotarget. 2017; 8:8726–37. https://doi.org/10.18632/oncotarget.14429 [PubMed]
- 23. Kushlinskii NE, Fridman MV, Braga EA. Molecular Mechanisms and microRNAs in Osteosarcoma Pathogenesis. Biochemistry (Mosc). 2016; 81:315–28. https://doi.org/10.1134/S0006297916040027 [PubMed]
- 24. Chen P, Wang R, Yue Q, Hao M. Long non-coding RNA TTN-AS1 promotes cell growth and metastasis in cervical cancer via miR-573/E2F3. Biochem Biophys Res Commun. 2018; 503:2956–62. https://doi.org/10.1016/j.bbrc.2018.08.077 [PubMed]
- 25. Cui Z, Luo Z, Lin Z, Shi L, Hong Y, Yan C. Long non-coding RNA TTN-AS1 facilitates tumorigenesis of papillary thyroid cancer through modulating the miR-153-3p/ZNRF2 axis. J Gene Med. 2019; 21:e3083. https://doi.org/10.1002/jgm.3083 [PubMed]
- 26. Dong MM, Peng SJ, Yuan YN, Luo HP. LncRNA TTN-AS1 contributes to gastric cancer progression by acting as a competing endogenous RNA of miR-376b-3p. Neoplasma. 2019; 66:564–75. https://doi.org/10.4149/neo_2018_180927N721 [PubMed]
- 27. Wang H, Meng F, Zhang B, Jiang P, Hu M, Yu X, Cao H. Long non-coding RNA TTN-AS1 aggravates carcinogenesis through Wnt/β-catenin signaling pathway by sponging miR-1271 in hepatocellular carcinoma. Minerva Med. 2019. [Epub ahead of print]. https://doi.org/10.1016/j.biopha.2017.10.056 [PubMed]
- 28. Lin C, Zhang S, Wang Y, Wang Y, Nice E, Guo C, Zhang E, Yu L, Li M, Liu C, Hu L, Hao J, Qi W, Xu H. Functional Role of a Novel Long Noncoding RNA TTN-AS1 in Esophageal Squamous Cell Carcinoma Progression and Metastasis. Clin Cancer Res. 2018; 24:486–98. https://doi.org/10.1158/1078-0432.CCR-17-1851 [PubMed]
- 29. Zhong Y, Wang J, Lv W, Xu J, Mei S, Shan A. LncRNA TTN-AS1 drives invasion and migration of lung adenocarcinoma cells via modulation of miR-4677-3p/ZEB1 axis. J Cell Biochem. 2019; 120:17131–41. https://doi.org/10.1002/jcb.28973 [PubMed]
- 30. Luo J, Liu Z. Long non-coding RNA TTN-AS1 promotes the progression of lung adenocarcinoma by regulating PTEN/PI3K/AKT signaling pathway. Biochem Biophys Res Commun. 2019; 514:140–47. https://doi.org/10.1016/j.bbrc.2019.04.050 [PubMed]
- 31. Chan JJ, Tay Y. Noncoding RNA:RNA Regulatory Networks in Cancer. Int J Mol Sci. 2018; 19:19. https://doi.org/10.3390/ijms19051310 [PubMed]
- 32. Chen J, Wu Z, Zhang Y. LncRNA SNHG3 promotes cell growth by sponging miR-196a-5p and indicates the poor survival in osteosarcoma. Int J Immunopathol Pharmacol. 2019; 33:2058738418820743. https://doi.org/10.1177/2058738418820743 [PubMed]
- 33. Li G, Zhu Y. Effect of lncRNA ANRIL knockdown on proliferation and cisplatin chemoresistance of osteosarcoma cells in vitro. Pathol Res Pract. 2019; 215:931–38. https://doi.org/10.1016/j.prp.2019.01.042 [PubMed]
- 34. Su P, Mu S, Wang Z. Long Noncoding RNA SNHG16 Promotes Osteosarcoma Cells Migration and Invasion via Sponging miRNA-340. DNA Cell Biol. 2019; 38:170–75. https://doi.org/10.1089/dna.2018.4424 [PubMed]
- 35. Li Z, Dou P, Liu T, He S. Application of Long Noncoding RNAs in Osteosarcoma: Biomarkers and Therapeutic Targets. Cell Physiol Biochem. 2017; 42:1407–19. https://doi.org/10.1159/000479205 [PubMed]
- 36. Yang L, Wei QM, Zhang XW, Sheng Q, Yan XT. MiR-376a promotion of proliferation and metastases in ovarian cancer: potential role as a biomarker. Life Sci. 2017; 173:62–67. https://doi.org/10.1016/j.lfs.2016.12.007 [PubMed]
- 37. Fan XR, Zhang ZY, Wang RH, Li Y, Mao QZ. MiR-376a functions as tumor suppressor by targeting SGK3 in renal cell carcinoma. Eur Rev Med Pharmacol Sci. 2019; 23:3726–32. [PubMed]
- 38. Zhang C, Liang Y, Ma MH, Wu KZ, Zhang CD, Dai DQ. Downregulation of microRNA-376a in Gastric Cancer and Association with Poor Prognosis. Cell Physiol Biochem. 2018; 51:2010–18. https://doi.org/10.1159/000495820 [PubMed]
- 39. Zhang L, Chen Y, Wang H, Zheng X, Li C, Han Z. miR-376a inhibits breast cancer cell progression by targeting neuropilin-1 NR. Onco Targets Ther. 2018; 11:5293–302. https://doi.org/10.2147/OTT.S173416 [PubMed]
- 40. Xu Q, Cheng L, Chen J, Lu W, Wang P. miR-376a inhibits the proliferation and invasion of osteosarcoma by targeting FBXO11. Hum Cell. 2019; 32:390–96. https://doi.org/10.1007/s13577-019-00256-2 [PubMed]
- 41. Zhao X, Sun S, Xu J, Luo Y, Xin Y, Wang Y. MicroRNA-152 inhibits cell proliferation of osteosarcoma by directly targeting Wnt/β-catenin signaling pathway in a DKK1-dependent manner. Oncol Rep. 2018; 40:767–74. https://doi.org/10.3892/or.2018.6456 [PubMed]
- 42. Zhang ZC, Liu JX, Shao ZW, Pu FF, Wang BC, Wu Q, Zhang YK, Zeng XL, Guo XD, Yang SH, He TC. In vitro effect of microRNA-107 targeting Dkk-1 by regulation of Wnt/β-catenin signaling pathway in osteosarcoma. Medicine (Baltimore). 2017; 96:e7245. https://doi.org/10.1097/MD.0000000000007245 [PubMed]
- 43. Goldstein SD, Trucco M, Bautista Guzman W, Hayashi M, Loeb DM. A monoclonal antibody against the Wnt signaling inhibitor dickkopf-1 inhibits osteosarcoma metastasis in a preclinical model. Oncotarget. 2016; 7:21114–23. https://doi.org/10.18632/oncotarget.8522 [PubMed]
- 44. Lee N, Smolarz AJ, Olson S, David O, Reiser J, Kutner R, Daw NC, Prockop DJ, Horwitz EM, Gregory CA. A potential role for Dkk-1 in the pathogenesis of osteosarcoma predicts novel diagnostic and treatment strategies. Br J Cancer. 2007; 97:1552–59. https://doi.org/10.1038/sj.bjc.6604069 [PubMed]