Sequences and operational taxonomic units of the stool samples of normal, diabetic, PSE-treated, and MET-treated mice
The disorder of gut microflora composition is associated with obesity and diabetes [1, 7]. In our study, Illumina high-throughput sequencing was conducted to read the 16S RNA sequences of the V4 region of 35 fecal microflora samples of the control, DM, 140 mg/kg MET treatment, and 10 and 80 mg/kg PSE treatment groups and to understand whether PSE affected the gut microbiota of mice. Each group had seven samples. Operational taxonomic units (OTUs) were classified on the basis of 97% similarity, and OTU1 with few sequences was removed (i.e., the number of sequences in OTUs was less than 2). The tag numbers of the control, DM, MET-treated, and PSE-treated groups were 72,644 ± 466.3, 74,290 ± 603.1, 71,807 ± 563.8, 72,780 ± 583.9, and 71,990 ± 458.3, respectively (Supplementary Table 3). The averages of the number of OTUs in each group were 512 ± 19.4, 511 ± 16.7, 524 ± 13.8, 521 ± 36.6, and 438 ± 32.3, respectively (Supplementary Table 3). The number of tags and OTUs of each group did not have significant changes.
The results of the PCA analysis based on OTU abundance and intergroup alpha diversity box map are given in Figures 3A and 3B. Letters a, b, c, d, and e in the graph represent the 10 mg/kg PSE-treated, 80 mg/kg PSE-treated, normal control, DM, and 140 mg/kg MET-treated groups, respectively. The results showed that the normal control and DM groups could be distinguished clearly on the basis of the gut microbiota composition. Similar to MET, 80 mg/kg PSE significantly affected the gut microbiota composition of the mice with T2DM (Figure 3A). The results of the multivariate ANOVA of the PCoA matrix scores indicated a statistically significant separation between the microbiota of the control group and the DM group. Significant separations were also observed in the DM, MET, and 80 mg/kg PSE groups (Figure 3C). However, the gut microbiota of the mice in the 10 mg/kg PSE-treated group did not significantly differ from that of the mice with diabetes (Figure 3C). This outcome was consistent with the weak effects observed in the mice treated with 10 mg/kg PSE (Figures 1 and 2). These results suggested that PSE significantly regulated the intestinal microflora.
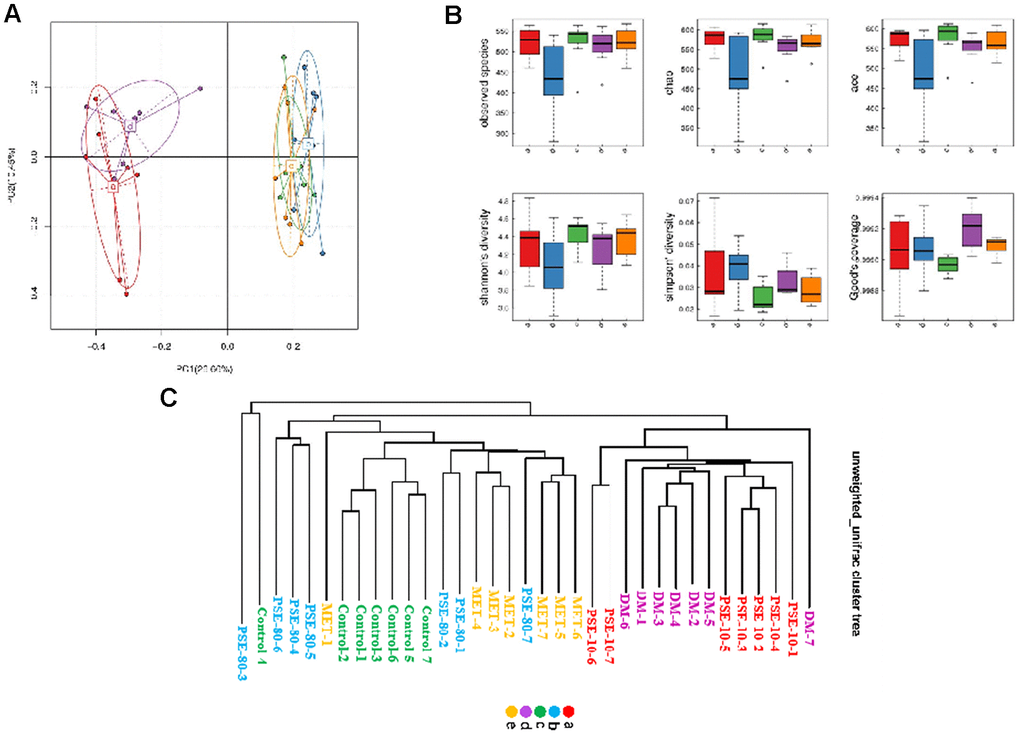
Figure 3. Results of PCA analysis based on OTU abundance, inter-group alpha diversity box map and multivariate analysis of variance of PCoA. The results of PCoA analysis based on OTU abundance (A) and inter-group alpha diversity box map (B). Multivariate analysis of variance of PCoA matrix scores (C). Letters a, b, c, d, and e in graph represent 10 mg/kg PSE-treated, 80 mg/kg PSE-treated, normal control, diabetes model, and 140 mg/kg MET-treated groups, respectively. The dots in the figure represent each sample. Different colours represent different groups of samples.
Regulatory effects of PSE on gut microbiota
Species and abundance analysis was conducted at phylum, class, order, family, genus, and species levels to further understand how PSE regulated gut microbiota. For 35 samples, 9 phyla, 13 classes, 14 orders, 20 families, 22 genera, and 10 species were obtained. Nine phyla, namely, Acidobacteria, Actinobacteria, Bacteroidetes, Cyanobacteria, Deferribacteres, Firmicutes, Proteobacteria, TM7, and Tenericutes, were examined (Figures 4A and 4B). The abundance of Actinobacteria, Proteobacteria, and Deferribacteres of the DM group significantly increased compared with that of the control group (p < 0.001, p < 0.05, and p < 0.001, respectively). The abundance of Bacteroidetes and Cyanobacteria of the DM group clearly decreased compared with that of the control group (p < 0.05 and p < 0.001, respectively). After 80 mg/kg PSE and 140 mg/kg MET were orally administered, Actinobacteria was not detected in the PSE- and MET-treated groups (Figure 4B). Moreover, the ratio of Firmicutes to Bacteroidetes of the DM group significantly increased. Although no effect was observed in 10 mg/kg PSE-treated group, 80 mg/kg PSE and 140 mg/kg MET significantly decreased the ratio of Firmicutes to Bacteroidetes and allowed the gut microbiota of the mice with T2DM to recover to normal level.
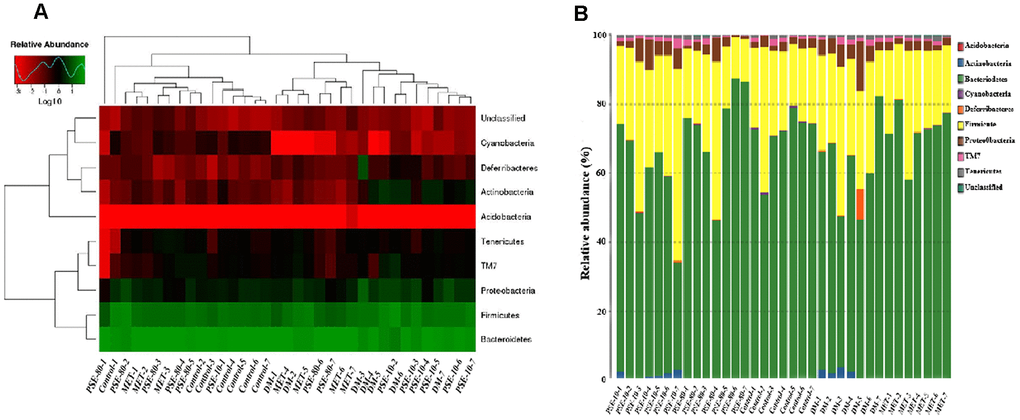
Figure 4. Effect of PSE on gut-microbiota composition of type 2 diabetic mice-induced by high-fat diet at phyma level. The heatmap of class level species abundance (A). Histogram of species profiling at the phyma classification level (B). Column height represents relative abundance.
Thirteen classes, namely, 4C0d-2, Actinobacteria, Bacilli, Bacteroidia, Betaproteobacteria, Clostridia, Deferribacteres, Deltaproteobacteria, Epsilonproteo-bacteria, Erysipelotrichi, Gammaproteobacteria, Mollicutes, and TM7-3, were investigated (Supplementary Figures 2A and 2B). The abundance of Actinobacteria, Betaproteobacteria, Deltaproteo-bacteria, Erysipelotrichi, and Deferribacteres of the DM group significantly increased compared with that of the control group (p < 0.0001, p < 0.01, p < 0.01, p < 0.01, and p < 0.01, respectively). By contrast, the abundance of Bacilli, Bacteroidia, Chloroplast, Gammaproteobacteria, and 4C0d-2 decreased (p < 0.001, p < 0.05, p < 0.001, p < 0.01, and p < 0.01, respectively). These effects were reversed by treating the mice with 80 mg/kg PSE and 140 mg/kg MET. However, 10 mg/kg PSE-treated group did not have this effect.
Fourteen orders, namely, Bacteroidales, Bifidobacteriales, Burkholderiales, CW040, Campylobacterales, Clostridiales, Deferribacterales, Desulfovibrionales, Enterobacrerides, Erysipelotrichales, Lactobacillales, RF39, Turicibacterales, and YS2, were analyzed (Supplementary Figures 3A and 3B). The abundance of Bacillales, Turicibacterales, Burkholderiales, Bifidobacteriales, Deferribacterales, Desulfovibrionales, and Erysipelotrichales of the DM group significantly increased compared with that of the control group (p < 0.05, p < 0.0001, p < 0.0001, p < 0.0001, p < 0.0001, p < 0.0001, and p < 0.0001, respectively). By contrast, the abundance of Bacteroidales, Enterobacteriales, Streptophyta, YS2, and Lactobacillales of the DM group significantly decreased compared with that of the control group (p < 0.05, p < 0.01, p < 0.01, and p < 0.0001, respectively). The normal level of the gut microflora of the mice with T2DM was recovered after they were treated with 80 mg/kg PSE and 140 mg/kg MET. However, the abundance of Lactobacillales significantly increased in the 10 mg/kg PSE-treated group.
Twenty families, namely, Alcaligenaceae, Bacteroidaceae, Bifidobacteriaceae, Deferribacteraceae, Desulfovibrionaceae, Enterobacteriaceae, Erysipelotri-chaceae, F16, Helicobacteraceae, Lachnospiraceae, Lactobacillaceae, Mogibacteriaceae, Odoribacteraceae, S24-7, Turicibacteraceae, Paraprevolellaceae, Porphy-romobbnadaceae, Prevoellaceae, Rikenellaceae, and Ruminococcaceae, were analyzed (Supplementary Figures 4A and 4B). The abundance of Alcaligenaceae, Deferribacteraceae, Bifidobacteriaceae, Desulfovibrio-naceae, Erysipelotrichaceae, Eubacteriaceae, Mogi-bacteriaceae, Peptococcaceae, and Peptostrep-tococcaceae of the DM group significantly increased (p < 0.0001, p < 0.0001, p < 0.001, p < 0.0001, p < 0.001, p < 0.001, p < 0.001, p < 0.001, and p < 0.001, respectively). By contrast, the abundance of Clostridiaceae, Enterobacteriaceae, Lactobacillaceae, Rikenellaceae, Odoribacteraceae, and Prevotellaceae of the DM group significantly decreased (p < 0.0001, p < 0.0001, p < 0.001, p < 0.0001, p < 0.0001, and p < 0.001). These changes in the abundance of the microflora of the mice in the DM group were reversed by the treatment with 80 mg/kg PSE and 140 mg/kg MET. Furthermore, Turicibacteraceae was found in the DM group. However, this effect was not observed in the 10 mg/kg PSE-treated group.
Twenty-two genera, namely, AF12, Allobaculum, Bacteroides, Bifidobacterium, Clostridium, Coprococcus, Desulfovibrio, Escherichia, Flexispira, Helicobacter, Lactobacillus, Mucispirillum, Odoribacter, Oscillospira, Parabacteroides, Paraprevotella, Prevotella, Rikenella, Roseburia, Ruminococcus, Sutterella, and Turicibacter, were checked (Supplementary Figures 5A and 5B). The abundance of AF12, Allobaculum, Bifidobacterium, Christensenella, Coprobacillus, Flexispira, Mucispirillum, Odoribacter, Turicibacter, Anaerofustis, and Sutterella of the DM group significantly increased compared with that of the control group (p < 0.05, p < 0.0001, p < 0.001, p < 0.0001, p < 0.0001, p < 0.01, p < 0.001, p < 0.0001, p < 0.0001, p < 0.0001, and p < 0.0001, respectively). The abundance of Escherichia, Lactobacillus, Lactococcus, Odoribacter, Paraprevotella, Prevotella, and Rikenella of the DM group was lower than that of the control group (p < 0.05, p < 0.001, p < 0.05, p < 0.0001, p < 0.0001, p < 0.05, and p < 0.01, respectively). These changes in abundance of gut microbiota at genera were amended after the mice were treated with 80 mg/kg PSE and 140 mg/kg MET. However, 10 mg/kg PSE did not have the same effect.
Ten species, namely, Bacteroides acidifaciens, Bifidobacterium pseudolc, Clostridium methylpentos, Desulfovibrio C21 c2, Escherichia coli, Lactobacillus reuteri, Mucispirillum schaedleri, Parabacteroides distasor, Ruminococcus flavefacie, and Ruminococcus gnavus, were investigated (Supplementary Figures 6A and 6B). The abundance of B. acidifaciens, Conterminous flavefaciens, Ruminococcus gnavus, Lactobacillus reuteri, and Lactococcus garvieae of the DM group decreased (p < 0.0001, p < 0.05, p < 0.01, p < 0.01, and p < 0.05, respectively), whereas the abundance of Bifidobacterium pseudolc, Clostridium colinum, Clostridium hungatei, Mucispirillum schaedleri (p < 0.001, p < 0.01, p < 0.05, and p < 0.001, respectively) of the DM group increased. After 80 mg/kg PSE and 140 mg/kg MET were administered, the abundance of these gut microbiota recovered to normal levels similar to that of the control group. These results suggested that the increase in B. pseudolc and Parabacteroides distasor in gut microflora might be the causative factors of T2DM. The growth of these microorganisms was inhibited by 80 mg/kg PSE, and this effect was similar to that of 140 mg/kg MET. Furthermore, 80 mg/kg PSE improved the clinical symptoms of the mice with T2DM induced by long-term HFD. However, 10 mg/kg PSE did not exhibit such effects.