


Introduction
Renal cell carcinoma (RCC) is a common malignant tumor of the urinary system, the incidence of which has been increasing. It is estimated that there will be 73,750 new cases of RCC in 2020 and 14,830 patients will die of the disease [1]. Clear cell renal cell carcinoma (ccRCC) is the most common pathological type of RCC, accounting for 80%-90% of cases [1, 2]. The clinical symptoms of early RCC are not obvious, and distant metastasis has occurred in 20% -30% of cases by the time of diagnosis. RCC is not sensitive to conventional radiotherapy or chemotherapy, which are effective in less than 20% of cases. Consequently, the prognosis of RCC with metastasis is poor, with a median survival time of only about 10 months [3].
Therapy targeting vascular endothelial growth factor and the rapamycin target protein pathway is effective, but drug resistance is nearly inevitable [4]. Recently, there has been significant progress in treating metastatic RCC with immunotherapy. In contrast to nonspecific immunotherapies with IL-2 or IL-6, immune checkpoint blockade (ICB) therapy has shown substantial efficacy against advanced RCC since being approved as a second-line treatment in 2015. ICB therapy based on programmed death 1 (PD1)/programmed death ligand (PDL1) and cytotoxic T lymphocyte associated antigen (CTLA4) has shown significant survival benefits in many cases of advanced RCC [5–8]. However, only about 20% of patients benefit from the therapy [9], and it is necessary to screen patients using predictive biomarkers to determine the potential efficacy of ICB therapy. In that regard, it is has been shown that tumor mutation burden (TMB) is associated with the response to immunotherapy [10], and that accumulation of somatic mutations correlates with neoantigen expression [11]. Thus, TMB [12], PDL1 [13], and tumor-infiltrating lymphocytes (TILs) [14] have been identified as biomarkers in various solid tumors.
The frequently mutated gene, SYNE1, encodes a series of spectrin structural proteins, which play key roles in cytoskeletal, nuclear and vesicular anchoring [15], and its mutation is associated with a form of cerebellar ataxia [16]. In addition, recent evidence suggests changes in SYNE1 expression levels, somatic mutations, and single nucleotide polymorphisms are related to the occurrence and development of lung cancer [17], oral cancer [18], hepatocellular carcinoma [19], and gastric cancer [20]. In the present study, we analyzed datasets of somatic mutations from The Cancer Genome Atlas (TCGA) in ccRCC patients. In the present study, we assessed the relation between SYNE1 and TMB and prognosis. We also compared immune cell infiltration between those with SYNE1 mutation type (mt) and those with wild type (wt), and evaluated the utility of SYNE1 mutation as a ICB biomarker using the tumor immune dysfunction and exclusion (TIDE) algorithm [21]. Our results suggest SYNE1 may be useful for predicting the efficacy ICB therapy.
Results
Somatic mutations, TMB and clinical outcomes in ccRCC patients
We analyzed the somatic mutations in ccRCC patients from TCGA cohort and identified 30 frequently mutated genes (Figure 1A). The genes and percentages of patients carrying the mutations are as follows: VHL (26%), PBRM1 (18%), TTN (15%), SETD2 (8%), MTOR (7%), BAP1 (6%), MUC16 (6%), DNAH9 (5%), LRP2 (4%), SPEN (4%), HMCN1 (4%), CSMD3 (3%), KMT2C (3%), ANK3 (3%), DNAH2 (3%), DST(3%), FBN2 (3%), RYR3 (3%), MARCA4 (3%), AKAP9 (3%), ATM (3%), BRCA2 (3%), ERBB4 (3%), FLG (3%), KDM5C (3%), MACF1 (3%), PCLO (3%), ROS1 (3%), SYNE1 (3%), USH2A (3%). We also evaluated the correlation between TMB and clinical outcomes using data collected from Cbioportal datasets. The TMB scores across all samples ranged from 0 to 16.05157. After constructing an X-tile plot of TMB and overall survival (OS), a TMB score cutoff of 1.7 was used to divide patients into TMB-low and TMB-high subsets. In contrast to findings from earlier studies of other cancers [22, 23], ccRCC patients in TMB-high had poorer clinical outcomes, irrespective of their disease-free survival (DFS) (p=0.00017) or OS (p=0.00032) status. At the same time, a higher TMB indicated a higher tumor grade (p<0.0001), higher risk of necrosis (p=0.038), and higher T staging (p=0.002) (Figure 1B).
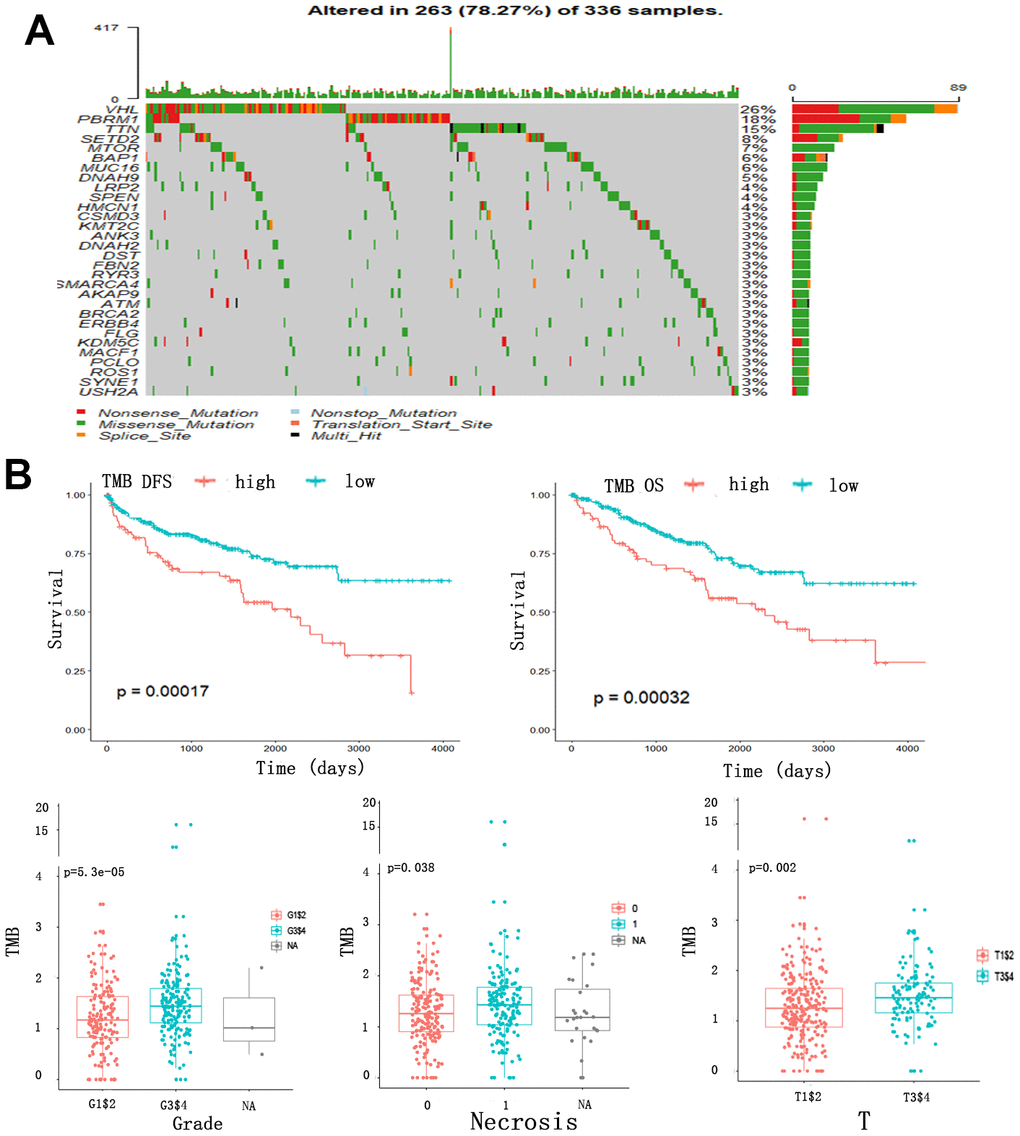
Figure 1. Somatic mutation, TMB and clinical outcomes in ccRCC patients. (A) Oncoplot for frequently mutated genes in ccRCC samples from TCGA cohort. Genes are listed by mutation frequency. The bottom panel shows the different mutation types. (B) TMB and clinical outcomes in ccRCC patients. X-tile plot of TMB and OS. A TMB score cutoff of 1.7 was used to divided patients into TMB-low and TMB-high subsets.
TMB and survival prognosis based on SYNE1 mutation and enrichment pathway analysis of SYNE1 mutation
We detected the SYNE1 mutation in a Venn diagram at the intersection of the top 30 somatic mutations, survival-related mutations, and TMB-related mutations in ccRCC (Figure 2A). Patients with SYNE1 mutation (mt) had poorer survival outcomes, irrespective of DFS (p<0.0001) or OS (p=0.0017) status (Figure 2B). In addition, a higher TMB correlated with SYNE1 mutation (p<0.0001) (Figure 2C). This is consistent with our previous analysis of TMB and clinical outcomes. COX survival analysis revealed that SYNE1 mutation was a risk factor affecting prognosis (HR=0.978; 95% CI, 1.156-6.114; P=0.021). In a multivariate analysis, however, SYNE1 mutation did not remain a significant factor affecting prognosis (Table 1), suggesting SYNE1 mutation may not be an independent risk factor affecting prognosis in ccRCC patients. GSEA results revealed that pathways including GO T cell activation, GO cytokine secretion, GO cell-cell signaling, Reactome neutrophil degranulation, Reactome TCR signaling, and Reactome downstream signaling events of B cell receptor are involved (Figure 2D).
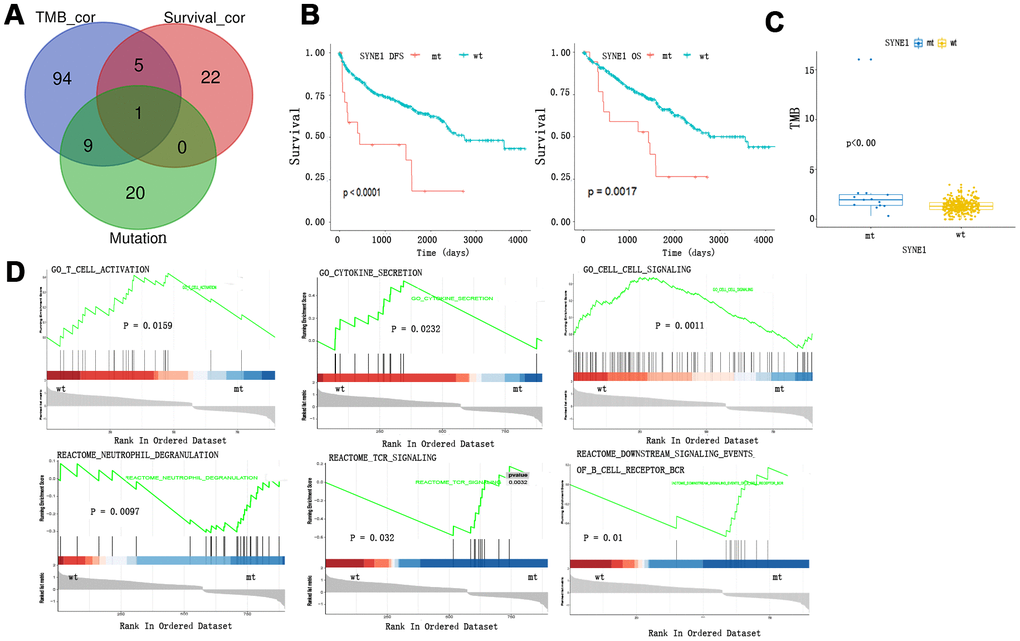
Figure 2. TMB and survival prognosis based on SYNE1 mutation and enrichment pathway analysis. (A) Venn diagram of frequently mutated genes showing TMB correlated and survival correlated mutated genes. (B) SYNE1 mutation and survival prognosis. (C) SYNE1 mutation is related to a higher TMB. (D) GSEA enrichment based on SYNE1 mutation: wt, wild type; mt, mutant type.
Table 1. Univariate and multivariate overall survival analysis of ccRCC patients by the COX proportional hazards model.
| Factors | Univariate | Multivariate | ||
| HR(95%CI) | p value | HR(95%CI) | p value | |
| Grade(G1$2,G3$4) | -0.839 (0.268-0.698) | 0.001 | ||
| Stage(stage1$2,stage3$4) | -1.435 (0.150-0.378) | 0.000 | -1.478 (0.144-0.362) | 0.000 |
| TMB(high,low) | 0.673 (1.401-2.743) | 0.000 | ||
| SYNE1(mt,wt) | 0.978 (1.156-6.114) | 0.021 | ||
| Gender(male,female) | 0.343 (0.918-2.161) | 0.117 | ||
| Age(<70y,>70y) | 1.015 (1.774-4.292) | 0.000 | 1.087 (1.902-4.621) | 0.000 |
Tumor-infiltrating immune cells associated with SYNE1 mutation in ccRCC
To further compare the differential profiles of immune fractions between SYNE1 mt and wt groups, we used the CIBERSORT algorithm to evaluate the association between SYNE1 mutation and tumor-infiltrating immune cells. Twenty-two immune cell types in each ccRCC sample are shown in the boxplot in Figure 3A. We found that numbers of CD8 T cells (p=0.015), monocytes (p=0.046), resting dendritic cells (p=0.031), and eosinophils (p=0.024) were lower in the SYNE1 mt group than in the wt group (Figure 3B). Using a correlation matrix, we found that numbers of CD8 T cells correlated positively with follicular helper T (TH) cells, regulatory T cells (Tregs) and M1 macrophages, while they correlated negatively with CD4 T cells, resting memory T cells, and M0 macrophages (Figure 3C). The heatmap shows that immune cell fractions were lower in the mt group than wt group (Figure 3D).
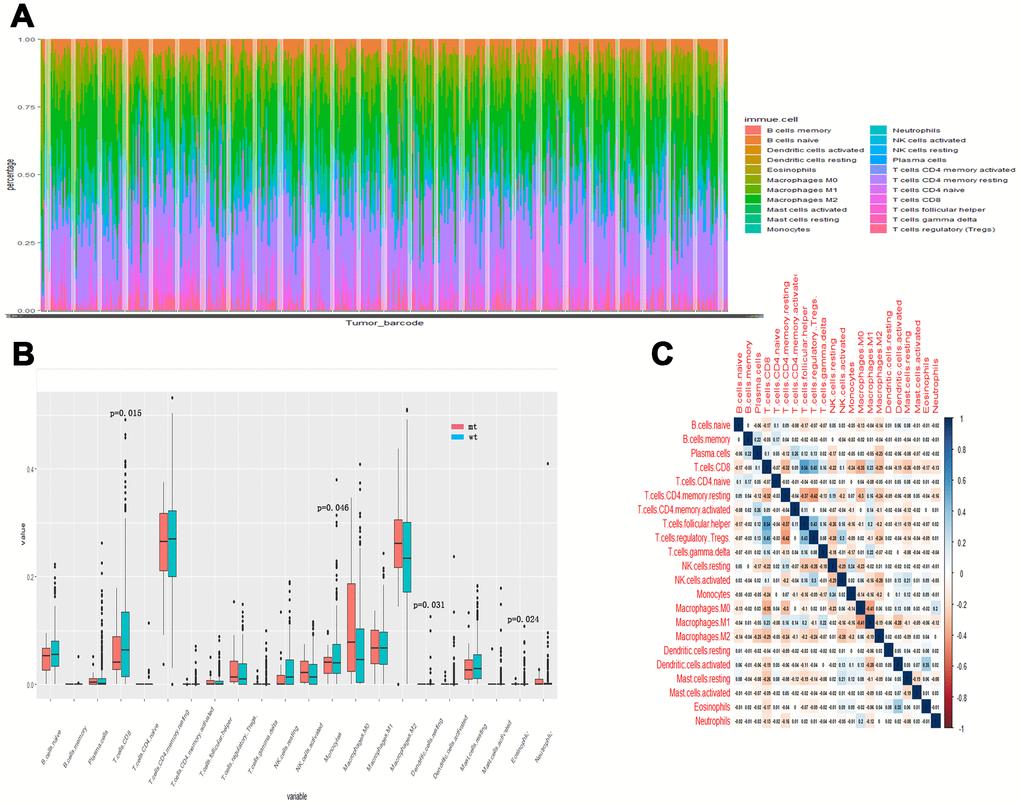
Figure 3. Tumor-infiltrating immune cells associated with SYNE1 mutation in ccRCC. (A) Bar chart of infiltration of 22 immune cells. (B) Boxplot showing differentially infiltrating immune cells based on SYNE1 mutation. Red color represents the mt group and blue represents the wt group. (C) Correlation matrix of immune cell fractions. The blue color represents positive correlation, and red represents negative correlation.
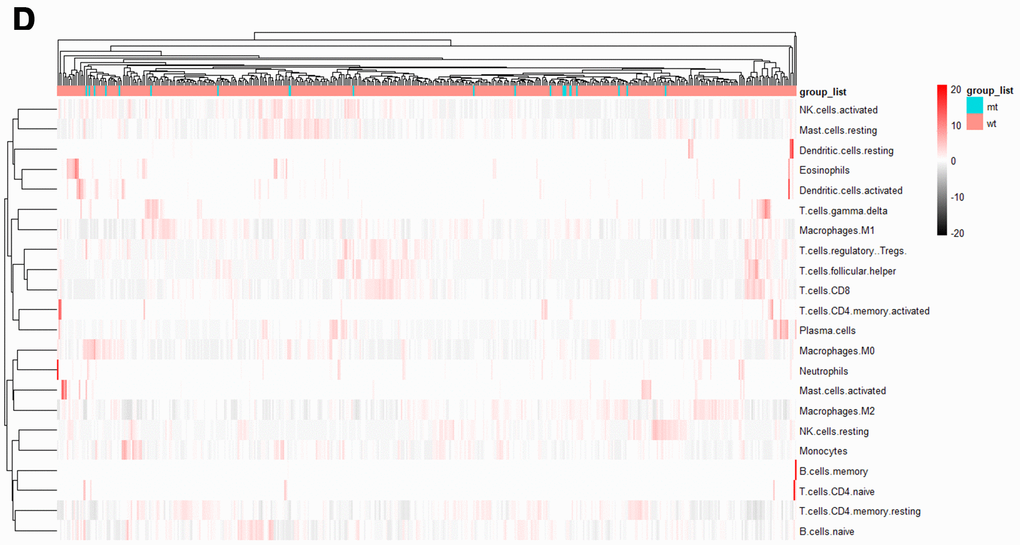
Figure 3. Tumor-infiltrating immune cells associated with SYNE1 mutation in ccRCC. (D) Heatmap of 22 immune cell types based on SYNE1 mutation. The blue color represents the mt group, and red represents the wt group.
Predicting of ICB response based on SYNE1 mutation and biomarker evaluation
To evaluate the ability of SYNE1 mutation to served as a biomarker predictive of the clinical response to ICB therapy, we analyzed datasets from patients with stage 4 ccRCC using the TIDE algorithm. The results showed that the mt group was associated with lower TIDE scores, indicating a stronger response to ICB therapy (Figure 4A). To evaluate its utility as a biomarker, we compared SYNE1 mutation to other existing biomarkers. Bar plots showed that SYNE1 has good prediction accuracy (Figure 4B). Lastly, our results suggest that SYEN1 mutation may be an independent risk factor associated with prognosis for ICB therapy (Figure 4C).
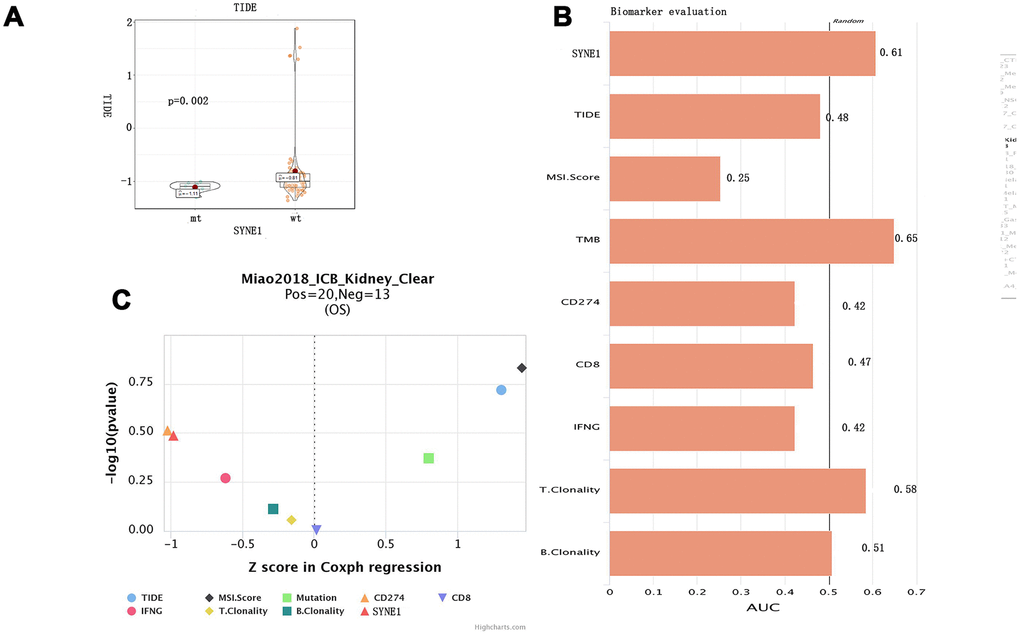
Figure 4. Predicting of ICB response based on SYNE1 mutation and biomarker evaluation. (A) Violin plot showing the differential TIDE between the mt and wt groups. (B) Evaluation of SYNE1 as a biomarker compared with existing biomarkers. (C) Multivariate analysis of SYNE1 and existing biomarkers using the COX proportional hazards model.
Discussion
In recent years immunotherapy used to treat ccRCC patients has changed from traditional nonspecific therapy to specific immunotherapy based on ICB. This greatly improved the efficacy of treatment for advanced RCC. Unfortunately, most RCC patients do not exhibit an immune response with ICB; only a small percentage of patients obtain a benefit. Consequently, it is necessary to identify patients who are more likely to respond to ICB therapy before administering the drug.
In the present study, we analyzed TCGA datasets of somatic mutations in ccRCC patients. We found that SYNE1 was frequently mutated in TCGA cohorts. In contrast to outcomes in patients with other tumors, where higher TMBs correlated with more favorable clinical prognoses, SYNE1 mutation was reportedly associated with higher TMB and poorer clinical prognoses [24]. Our findings are consistent with that earlier observation. GSEA enrichment analysis showed that SYNE1 mutation correlates negatively with T cell activation and cytokine secretion, and correlates positively with neutrophil degranulation and T cell receptor (TCR) signaling. The role of neutrophils in cancer is complex. On the one hand, they can kill tumor cells, but on the other hand, neutrophil degranulation can promote tumor cell immune escape and metastasis [25]. Activation of TCR signaling is closely related to T cell activity, leading to creation of new epitopes. It is reported, however, that only 0.3%-1.3% of tumor gene mutations induce T cell responses via TCR signaling [26]. Firstly, the rate of nonsynonymous mutations and frameshifts occur in protein-coding sequences is low. Secondly, proteasome cleavage of mutation-containing protein can destroy TCR-recognized peptide epitopes [27].
Samples with SYNE1 mutations were correlated with signaling pathways involved in immune responses and alterations in the profiles of infiltrating immune cells. For example, CD8 T cell and monocyte fractions were significantly lower in the mt than wt group. Moreover, recent studies have shown that lower CD8 T cell and monocyte infiltration is closely related to a poor prognosis [28, 29]. Using a correlation matrix, we could see CD8 T cells correlated positively with TH cells and Tregs. There are two parts to the T cell activation signal pathway. The first entails activation TCR signaling; the second involves the assistance of molecules such as CD8 and CD4, which are expressed in TH cells and Tregs [30]. This may explain the results of our GSEA enrichment pathways analysis, which indicated that SYNE1 mutations correlate positively with TCR signaling but correlate negatively with T cell activation.
We evaluated the ability of SYNE1 mutation to serve as a biomarker. Interestingly, although we found that the mt group showed higher TMBs and poorer prognoses, it also correlated with a better response to ICB therapy. And compared with existing biomarkers, SYNE1 mutation exhibited good prediction ability. These findings suggest SYNE1 mutations may play a role in ICB therapy in ccRCC.
Our study has several limitations. First, the sample size was relatively small, and a clinical trial with a larger sample size is needed to validate our hypothesis. In addition, basic experiments should be performed to verify and clarify the mechanism.
Materials and Methods
Clinical cohorts and the mutation data
In this study, we analyzed the relationship between TMB and clinical outcome in 443 patients from the cBioPortal database (https://www.cbioportal.org) and the supplemental file, “mutation-load-updated.txt,” of a TCGA Pan-Cancer study (https://api.gdc.cancer.gov/data/ff3f962c-3573-44ae-a8f4-e5ac0aea64b6) [31]. TMB was determined as the total number of mutations per sample, normalized by the whole-exome sequencing coverage, as described in Knijnenburg et al [32]. Intronic mutations, mutations in the 3′ or 5′ UTR regions or UTR flanking regions, silent mutations, and small, in-frame insertions and deletions were all removed. TCGA clinical data were download from TCGA Pan-Cancer Clinical Data Resource (TCGA-CDR) (https://ars.els-cdn.com/content/image/1-s2.0-S0092867418302290-mmc1.xlsx). SYNE1 mutation data were download from the Kidney Renal Clear Cell Carcinoma (TCGA, Firehose Legacy) dataset (http://download.cbioportal.org/kirc_tcga.tar.gz).
Bioinformatic analysis
MAF files containing somatic variants for American ccRCC samples were download from TCGA datasets and visualized using the maftools package [33]. Gene set enrichment analysis (GSEA) was performed with R studio script [34]. Gene expression data were downloaded from TCGA and divided into two groups based on SYNE1 mutation status. The gene set “msigdb.v7.0.entrez.gmt” was downloaded from the Molecular Signatures Database (http://software.broadinstitute.org/gsea/msigdb/index.jsp) and was used for the enrichment analysis. The CIBERSORT algorithm was used to evaluate the fractions of 22 tumor-infiltrating lymphocyte subsets and were compared based on SYNE1 mutation status [35]. The TIDE algorithm was used to predict ICB responses and evaluate ability to serve as a neoantigen (http://tide.dfci.harvard.edu) [21]. Values of p > 0.05 were considered statistically significant.
Statistical analyses
X-tile plots provided a single and intuitive method to assess the association between TMB and patient survival [36]. The Kaplan-Meier method was used to analyze the correlation between SYNE1 mutation, TMB and patient survival, and the log-rank test was used to compare survival curves. Statistical tests were performed using R software, version 3.6.2 (R Foundation for Statistical Computing; Vienna, Austria). Univariate and multivariate Cox regression analyzing the association between clinical characteristics and survival was performed using SPSS, version 19. Values of p > 0.05 were considered statistically significant.
Author Contributions
Wei Chen planned the entire study; Jiefei Xiao and Pengju Li drafted the manuscript; Jinhuan Wei, Bangfen Zhou and Pengju Li contributed to the data analysis and figure complete; Junhang Luo finalized the manuscript. All authors have read and approved the final manuscript.
Conflicts of Interest
The authors declare that there are no conflicts of interest.
References
- 1. Siegel RL, Miller KD, Jemal A. Cancer statistics, 2020. CA Cancer J Clin. 2020; 70:7–30. https://doi.org/10.3322/caac.21590 [PubMed]
- 2. Hsieh JJ, Purdue MP, Signoretti S, Swanton C, Albiges L, Schmidinger M, Heng DY, Larkin J, Ficarra V. Renal cell carcinoma. Nat Rev Dis Primers. 2017; 3:17009. https://doi.org/10.1038/nrdp.2017.9 [PubMed]
- 3. Kasenda B, Larkin J, Gore M. Immunotherapies in early and advanced renal cell cancer. Prog Tumor Res. 2015; 42:1–10. https://doi.org/10.1159/000436988 [PubMed]
- 4. Rini BI, Atkins MB. Resistance to targeted therapy in renal-cell carcinoma. Lancet Oncol. 2009; 10:992–1000. https://doi.org/10.1016/S1470-2045(09)70240-2 [PubMed]
- 5. McDermott DF, Huseni MA, Atkins MB, Motzer RJ, Rini BI, Escudier B, Fong L, Joseph RW, Pal SK, Reeves JA, Sznol M, Hainsworth J, Rathmell WK, et al. Clinical activity and molecular correlates of response to atezolizumab alone or in combination with bevacizumab versus sunitinib in renal cell carcinoma. Nat Med. 2018; 24:749–757. https://doi.org/10.1038/s41591-018-0053-3 [PubMed]
- 6. McKay RR, Bossé D, Xie W, Wankowicz SA, Flaifel A, Brandao R, Lalani AA, Martini DJ, Wei XX, Braun DA, Van Allen E, Castellano D, De Velasco G, et al. The clinical activity of PD-1/PD-L1 inhibitors in metastatic non-clear cell renal cell carcinoma. Cancer Immunol Res. 2018; 6:758–65. https://doi.org/10.1158/2326-6066.CIR-17-0475 [PubMed]
- 7. Motzer RJ, Rini BI, McDermott DF, Arén Frontera O, Hammers HJ, Carducci MA, Salman P, Escudier B, Beuselinck B, Amin A, Porta C, George S, Neiman V, et al, and CheckMate 214 investigators. Nivolumab plus ipilimumab versus sunitinib in first-line treatment for advanced renal cell carcinoma: extended follow-up of efficacy and safety results from a randomised, controlled, phase 3 trial. Lancet Oncol. 2019; 20:1370–85. https://doi.org/10.1016/S1470-2045(19)30413-9 [PubMed]
- 8. Tomita Y, Kondo T, Kimura G, Inoue T, Wakumoto Y, Yao M, Sugiyama T, Oya M, Fujii Y, Obara W, Motzer RJ, Uemura H. Nivolumab plus ipilimumab versus sunitinib in previously untreated advanced renal-cell carcinoma: analysis of Japanese patients in CheckMate 214 with extended follow-up. Jpn J Clin Oncol. 2020; 50:12–19. https://doi.org/10.1093/jjco/hyz132 [PubMed]
- 9. Braun DA, Burke KP, Van Allen EM. Genomic approaches to understanding response and resistance to immunotherapy. Clin Cancer Res. 2016; 22:5642–50. https://doi.org/10.1158/1078-0432.CCR-16-0066 [PubMed]
- 10. Goodman AM, Kato S, Bazhenova L, Patel SP, Frampton GM, Miller V, Stephens PJ, Daniels GA, Kurzrock R. Tumor mutational burden as an independent predictor of response to immunotherapy in diverse cancers. Mol Cancer Ther. 2017; 16:2598–608. https://doi.org/10.1158/1535-7163.MCT-17-0386 [PubMed]
- 11. Gubin MM, Artyomov MN, Mardis ER, Schreiber RD. Tumor neoantigens: building a framework for personalized cancer immunotherapy. J Clin Invest. 2015; 125:3413–21. https://doi.org/10.1172/JCI80008 [PubMed]
- 12. Chan TA, Yarchoan M, Jaffee E, Swanton C, Quezada SA, Stenzinger A, Peters S. Development of tumor mutation burden as an immunotherapy biomarker: utility for the oncology clinic. Ann Oncol. 2019; 30:44–56. https://doi.org/10.1093/annonc/mdy495 [PubMed]
- 13. Patel SP, Kurzrock R. PD-L1 expression as a predictive biomarker in cancer immunotherapy. Mol Cancer Ther. 2015; 14:847–56. https://doi.org/10.1158/1535-7163.MCT-14-0983 [PubMed]
- 14. Zito Marino F, Ascierto PA, Rossi G, Staibano S, Montella M, Russo D, Alfano R, Morabito A, Botti G, Franco R. Are tumor-infiltrating lymphocytes protagonists or background actors in patient selection for cancer immunotherapy? Expert Opin Biol Ther. 2017; 17:735–46. https://doi.org/10.1080/14712598.2017.1309387 [PubMed]
- 15. Puckelwartz MJ, Kessler E, Zhang Y, Hodzic D, Randles KN, Morris G, Earley JU, Hadhazy M, Holaska JM, Mewborn SK, Pytel P, McNally EM. Disruption of nesprin-1 produces an emery dreifuss muscular dystrophy-like phenotype in mice. Hum Mol Genet. 2009; 18:607–20. https://doi.org/10.1093/hmg/ddn386 [PubMed]
- 16. Gama MT, Braga-Neto P, Dutra LA, Alessi H, Maria LA, Gadelha AA, Ortiz BB, Kunii I, Correia-Silva SR, Dias da Silva MR, Dion PA, Rouleau GA, França MC
Jr , et al. Cognitive and psychiatric evaluation in SYNE1 ataxia. Cerebellum. 2019; 18:731–37. https://doi.org/10.1007/s12311-019-01033-5 [PubMed] - 17. Li Y, Xiao X, Bossé Y, Gorlova O, Gorlov I, Han Y, Byun J, Leighl N, Johansen JS, Barnett M, Chen C, Goodman G, Cox A, et al. Genetic interaction analysis among oncogenesis-related genes revealed novel genes and networks in lung cancer development. Oncotarget. 2019; 10:1760–74. https://doi.org/10.18632/oncotarget.26678 [PubMed]
- 18. Shah K, Patel S, Modi B, Shah F, Rawal R. Uncovering the potential of CD44v/SYNE1/miR34a axis in salivary fluids of oral cancer patients. J Oral Pathol Med. 2018; 47:345–52. https://doi.org/10.1111/jop.12678 [PubMed]
- 19. Faraj Shaglouf LH, Ranjpour M, Wajid S, Jain SK. Elevated expression of cellular SYNE1, MMP10, and GTPase1 and their regulatory role in hepatocellular carcinoma progression. Protoplasma. 2020; 257:157–67. https://doi.org/10.1007/s00709-019-01423-w [PubMed]
- 20. Cong T, Liu GX, Cui JX, Zhang KC, Chen ZD, Chen L, Wei B, Huang XH. [Exome sequencing of gastric cancers screened the differences of clinicopathological phenotypes between the mutant and the wide-type of frequently mutated genes]. Zhonghua Yi Xue Za Zhi. 2018; 98:2242–45. https://doi.org/10.3760/cma.j.issn.0376-2491.2018.28.006 [PubMed]
- 21. Jiang P, Gu S, Pan D, Fu J, Sahu A, Hu X, Li Z, Traugh N, Bu X, Li B, Liu J, Freeman GJ, Brown MA, et al. Signatures of T cell dysfunction and exclusion predict cancer immunotherapy response. Nat Med. 2018; 24:1550–58. https://doi.org/10.1038/s41591-018-0136-1 [PubMed]
- 22. Wu Z, Wang M, Liu Q, Liu Y, Zhu K, Chen L, Guo H, Li Y, Shi B. Identification of gene expression profiles and immune cell infiltration signatures between low and high tumor mutation burden groups in bladder cancer. Int J Med Sci. 2020; 17:89–96. https://doi.org/10.7150/ijms.39056 [PubMed]
- 23. Devarakonda S, Rotolo F, Tsao MS, Lanc I, Brambilla E, Masood A, Olaussen KA, Fulton R, Sakashita S, McLeer-Florin A, Ding K, Le Teuff G, Shepherd FA, et al. Tumor mutation burden as a biomarker in resected non-small-cell lung cancer. J Clin Oncol. 2018; 36:2995–3006. https://doi.org/10.1200/JCO.2018.78.1963 [PubMed]
- 24. Zhang C, Li Z, Qi F, Hu X, Luo J. Exploration of the relationships between tumor mutation burden with immune infiltrates in clear cell renal cell carcinoma. Ann Transl Med. 2019; 7:648. https://doi.org/10.21037/atm.2019.10.84 [PubMed]
- 25. Mollinedo F. Neutrophil degranulation, plasticity, and cancer metastasis. Trends Immunol. 2019; 40:228–42. https://doi.org/10.1016/j.it.2019.01.006 [PubMed]
- 26. Morris EC, Stauss HJ. Optimizing t-cell receptor gene therapy for hematologic Malignancies. Blood. 2016; 127:3305–11. https://doi.org/10.1182/blood-2015-11-629071 [PubMed]
- 27. Beekman NJ, van Veelen PA, van Hall T, Neisig A, Sijts A, Camps M, Kloetzel PM, Neefjes JJ, Melief CJ, Ossendorp F. Abrogation of CTL epitope processing by single amino acid substitution flanking the c-terminal proteasome cleavage site. J Immunol. 2000; 164:1898–905. https://doi.org/10.4049/jimmunol.164.4.1898 [PubMed]
- 28. Yao J, Xi W, Zhu Y, Wang H, Hu X, Guo J. Checkpoint molecule PD-1-assisted CD8+ T lymphocyte count in tumor microenvironment predicts overall survival of patients with metastatic renal cell carcinoma treated with tyrosine kinase inhibitors. Cancer Manag Res. 2018; 10:3419–31. https://doi.org/10.2147/CMAR.S172039 [PubMed]
- 29. Zhu G, Pei L, Yin H, Lin F, Li X, Zhu X, He W, Gou X. Profiles of tumor-infiltrating immune cells in renal cell carcinoma and their clinical implications. Oncol Lett. 2019; 18:5235–42. https://doi.org/10.3892/ol.2019.10896 [PubMed]
- 30. Harris DT, Kranz DM. Adoptive T cell therapies: a comparison of T cell receptors and chimeric antigen receptors. Trends Pharmacol Sci. 2016; 37:220–30. https://doi.org/10.1016/j.tips.2015.11.004 [PubMed]
- 31. Hoadley KA, Yau C, Hinoue T, Wolf DM, Lazar AJ, Drill E, Shen R, Taylor AM, Cherniack AD, Thorsson V, Akbani R, Bowlby R, Wong CK, et al, and Cancer Genome Atlas Network. Cell-of-origin patterns dominate the molecular classification of 10,000 tumors from 33 types of cancer. Cell. 2018; 173:291–304.e6. https://doi.org/10.1016/j.cell.2018.03.022 [PubMed]
- 32. Knijnenburg TA, Wang L, Zimmermann MT, Chambwe N, Gao GF, Cherniack AD, Fan H, Shen H, Way GP, Greene CS, Liu Y, Akbani R, Feng B, et al, and Cancer Genome Atlas Research Network. Genomic and molecular landscape of DNA damage repair deficiency across the cancer genome atlas. Cell Rep. 2018; 23:239–54.e6. https://doi.org/10.1016/j.celrep.2018.03.076 [PubMed]
- 33. Mayakonda A, Lin DC, Assenov Y, Plass C, Koeffler HP. Maftools: efficient and comprehensive analysis of somatic variants in cancer. Genome Res. 2018; 28:1747–56. https://doi.org/10.1101/gr.239244.118 [PubMed]
- 34. Subramanian A, Tamayo P, Mootha VK, Mukherjee S, Ebert BL, Gillette MA, Paulovich A, Pomeroy SL, Golub TR, Lander ES, Mesirov JP. Gene set enrichment analysis: a knowledge-based approach for interpreting genome-wide expression profiles. Proc Natl Acad Sci USA. 2005; 102:15545–50. https://doi.org/10.1073/pnas.0506580102 [PubMed]
- 35. Newman AM, Liu CL, Green MR, Gentles AJ, Feng W, Xu Y, Hoang CD, Diehn M, Alizadeh AA. Robust enumeration of cell subsets from tissue expression profiles. Nat Methods. 2015; 12:453–57. https://doi.org/10.1038/nmeth.3337 [PubMed]
- 36. Camp RL, Dolled-Filhart M, Rimm DL. X-tile: a new bio-informatics tool for biomarker assessment and outcome-based cut-point optimization. Clin Cancer Res. 2004; 10:7252–59. https://doi.org/10.1158/1078-0432.CCR-04-0713 [PubMed]