


Introduction
Parkinson’s disease (PD) is an age-related neurodegenerative disease characterized by increasing accumulation of alpha-synuclein, encoded by the SNCA gene [1]. Clinical motor symptoms of PD such as tremor, rigidity, and bradykinesia are linked to cell loss in the substantia nigra pars compacta. Additionally, an array of cognitive deficits, including impairment of executive function, language, visuospatial/visuoconstructive abilities, memory, depression, apathy, and impulse control disorders are also observed, even in early stages of PD [2–6]. These non-motor symptoms have been associated with disturbances of information flow through frontal-subcortical networks [7]. Through interactions with basal ganglia, the frontal cortex is also involved in controlling motor functions [7]. In line, damage to the frontal cortex or basal ganglia lead to several comparable cognitive impairments [8–11]. Hence, investigating disease-associated changes in frontal cortex may aid in understanding the manifestation of PD.
Through positron emission tomography (PET), functional MRI (fMRI), and magnetic resonance spectroscopy (MRS) functional and metabolic disturbances have been identified in frontal cortex of PD patients [12]. In addition, transcriptomic and proteomic investigations describe abnormalities in mitochondrial, protein folding, and ubiquitin conjugation pathways in the prefrontal cortex of PD patients [13, 14]. However, these studies remain limited in explaining how these molecular changes develop as PD progresses.
In order to trace these molecular perturbations to deviating gene activities in early stages of PD, we used a transgenic rat model of PD overexpressing the full-length human wildtype SNCA locus on a BAC/PAC fusion construct [15]. In this model, overexpression of SNCA leads to C-terminal truncation and conversion into insoluble, proteinase K–resistant alpha-synuclein species, strongly enriched in nigrostriatal system. The progressive aggregation of alpha-synuclein results in age-dependent loss of dopaminergic cells and motor deficits surfacing at around 12 months of age. Thus, we analysed the frontocortical transcriptome of 5- and 12-month-old animals using RNA sequencing (RNA-seq) to capture a presymptomatic and symptomatic time point. In parallel, we profiled the frontocortical transcriptome in PD patients. Through integration of results across rat and human with cell–type–specific data, we revealed a distinctive increase of expression in myelin-associated genes attributed to oligodendrocytes that was shared between both organisms. Taking advantage of the temporal dimension in the rat data, we traced these perturbations to originate from either genotype or age-genotype effects.
Results
SNCA overexpression causes age-dependent gene expression changes in frontocortical rat tissue
Animal models circumvent the inaccessibility that largely exists for patient brain tissue prior to death and, hence, are ideal for studying pathogenic events that unfold over time. The well-characterized transgenic rat model we used in this study overexpresses full-length human SNCA and recapitulates typical PD features such as alpha-synuclein aggregation, progressive death of dopaminergic cells with associated motor symptoms, and neuroinflammation [15–17]. To identify gene expression changes over time, we chose the 5- and 12-month-old time point that reflect a presymptomatic and symptomatic stage in the model at adulthood. Using RNA-seq, we profiled the transcriptome of frontal cortex in five transgenic (TG) and five wildtype (WT) rats at both time points (Supplementary Figure 1) and determined differentially expressed genes (DEGs) along the genotype and age axis.
With respect to genotype, 843 DEGs (553 up- and 290 downregulated) in 5-month-old and 162 DEGs (108 up- and 54 downregulated) in 12-month-old rats were identified (Figure 1A). While the endogenous SNCA transcript showed stable expression across experimental groups, transcripts from the transgene locus led to a >10-fold overexpression of SNCA in TG animals (Figure 1B). The SNCA expression level and transcript shares remained largely similar for both time points (Figure 1B). Functionally, the 843 DEGs identified in 5-month-old animals were enriched for biological processes linked to synaptic functions including regulation of postsynaptic membrane potential and modulation of chemical synaptic transmission (Figure 1C). The 162 DEGs identified in 12-month-old animals were attributed to processes linked to myelination such as central nervous system myelination and axon ensheathment in central nervous system (Figure 1C).
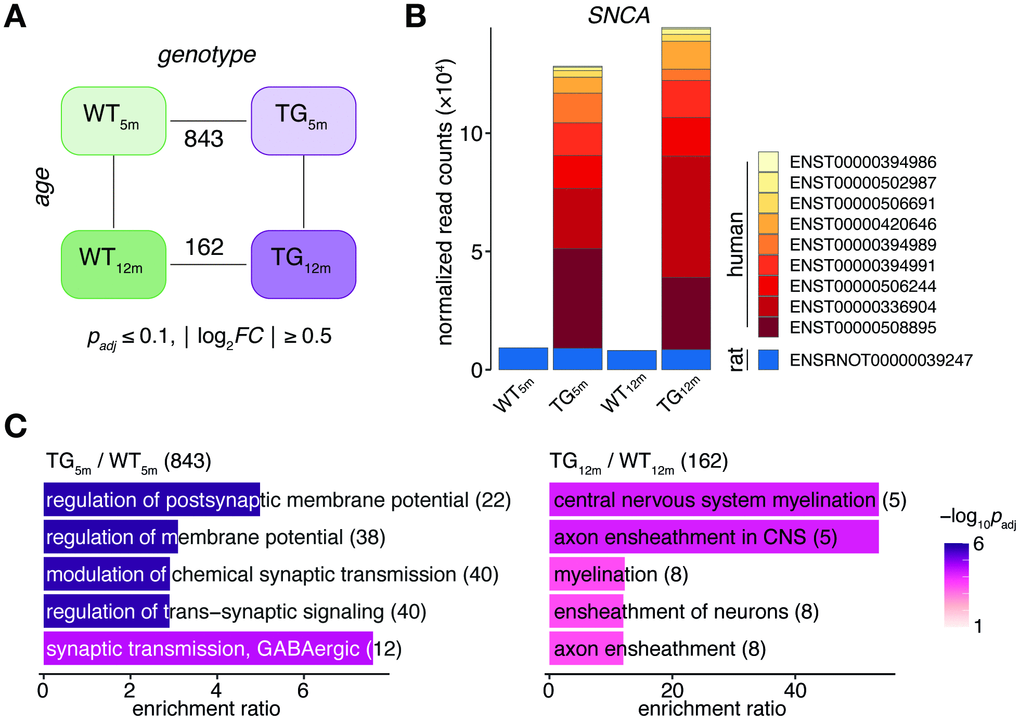
Figure 1. SNCA overexpression in rat causes age-dependent gene expression perturbations in frontocortical tissue. (A) Schematic diagram of experimental groups along the genotype (wild-type WT, transgenic TG), and age (5 and 12 months) axis highlighting number of differentially expressed genes (DEGs) between TG and WT rats using indicated significance cut-offs. (B) Composition and relative expression levels of rat and human SNCA transcript isoforms across experimental groups. (C) Overrepresented biological processes among 843 DEGs identified in 5-month-old (left panel) and among 162 DEGs in 12-month-old TG rats (right panel). Top five significant terms, their adjusted p-values, enrichment ratios, and DEG count shown.
The different DEG counts observed at 5 and 12 months of age despite a stable overexpression of SNCA imply interferences between the transgene and the host system that changed during this time window.
Gene expression patterns point to interactions between SNCA overexpression and age-related adaptations of gene activity
Against a presumed increase of gene expression perturbations over time given an age-dependent disease, DEGs dropped from 843 to 162 between 5 and 12 months of age with only 71 DEGs overlapping (Figure 2A). To better understand this observation, DEGs for both time points were visualized across experimental groups and showed perturbance patterns that partition into four major clusters (Figure 2B). Summarized as medoids, two classes of nearly mirror-imaged expression profiles, G (abbr: Genotype) and AG (abbr: Age-Genotype), became apparent (Figure 2C). Class G contained genes that were either up- or downregulated at both time points and, hence, reflected a mainly genotype-driven expression change irrespective of age (Figure 2B, 2C). In contrast, genes in class AG show differential expression in 5-month-old TG rats only. These DEGs were no longer identified at the 12-month time point, as WT animals underwent expression adaptations during that time which are strikingly similar to the expression difference observed in the 5-month-old animals (Figure 2B, 2C). Hence, class AG suggests age-dependent expression perturbation for certain genes.
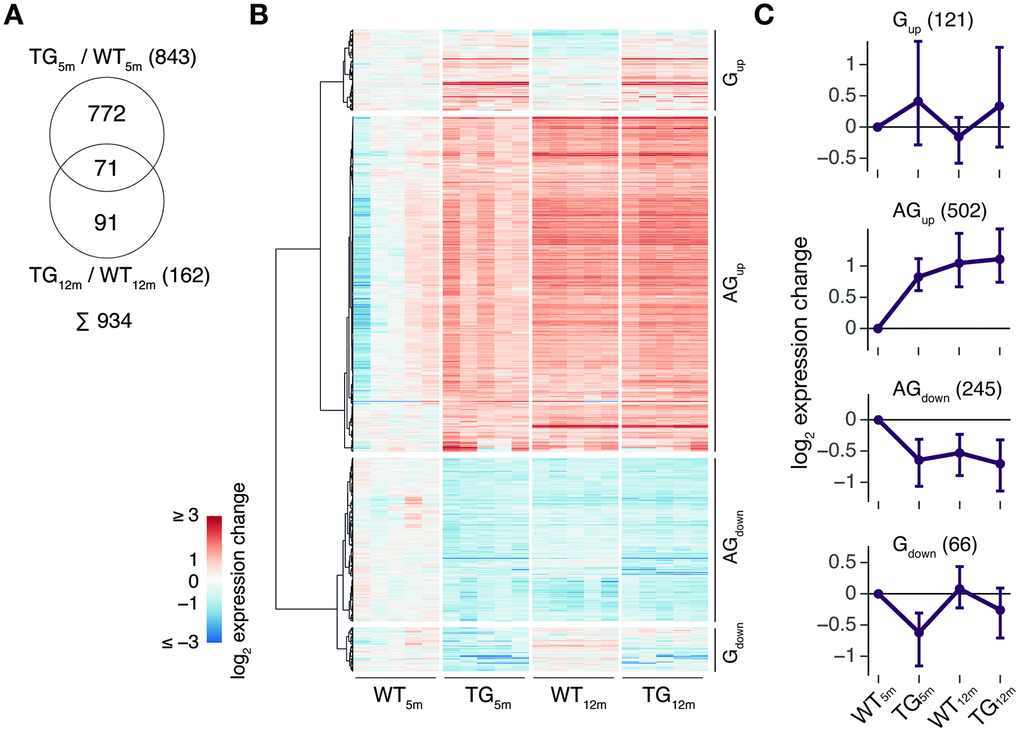
Figure 2. Gene expression patterns point to interactions between SNCA overexpression and age-related adaptations in gene activity. (A) Venn diagram comparing DEGs identified in 5- and 12-month-old TG rats. (B) Hierarchically clustered expression changes (relative to WT5m) for all 934 DEGs identified in 5- and 12-month-old TG rats partitioned into four main perturbance patterns. (C) Gene clusters (see B) summarized as expression medoids (±SD). Cluster cardinalities indicated in brackets.
Distinct classes of aberrant age-related adaptations in rats overexpressing SNC
Consequently, a proper understanding of transgene-induced perturbations requires putting them into perspective against typical adaptations of gene activity over time. Therefore, differential expression was determined along the age dimension among experimental groups. A total of 1590 (1094 up- and 496 downregulated) and 340 DEGs (277 up- and 63 downregulated) were identified for WT and TG animals, respectively (Figure 3A). The different DEG counts and their incomplete overlap (Figure 3B) suggest age-dependent adaptations of gene activity occurred differently in WT and TG animals. Partitioning these DEGs according to their expression patterns over time (Supplementary Figure 2) led to four primary classes each comprising two nearly mirror-imaged profiles (Figure 3C). While there were still some genes, whose expression adaptations in TG animals corresponded to the WT condition (class A, abbr: Age), the majority of genes fell into age-genotype-dependent classes AG1, AG2, and AG3 that clearly showed aberrant expression adaptations in TG animals (Figure 3C). Specifically, classes AG1 and AG3 (similar to class AG, Figure 2B, 2C) showed differential expression in 5- but not in 12-month-old TG animals (Figure 3C). Interestingly, class AG2 contained genes that showed expression adaptations in WT animals only, which TG animals failed to undergo (Figure 3C). This adaptation failure in context of SNCA overexpression was in line with comparable observations we made in a mouse model overexpressing human SNCA [18].
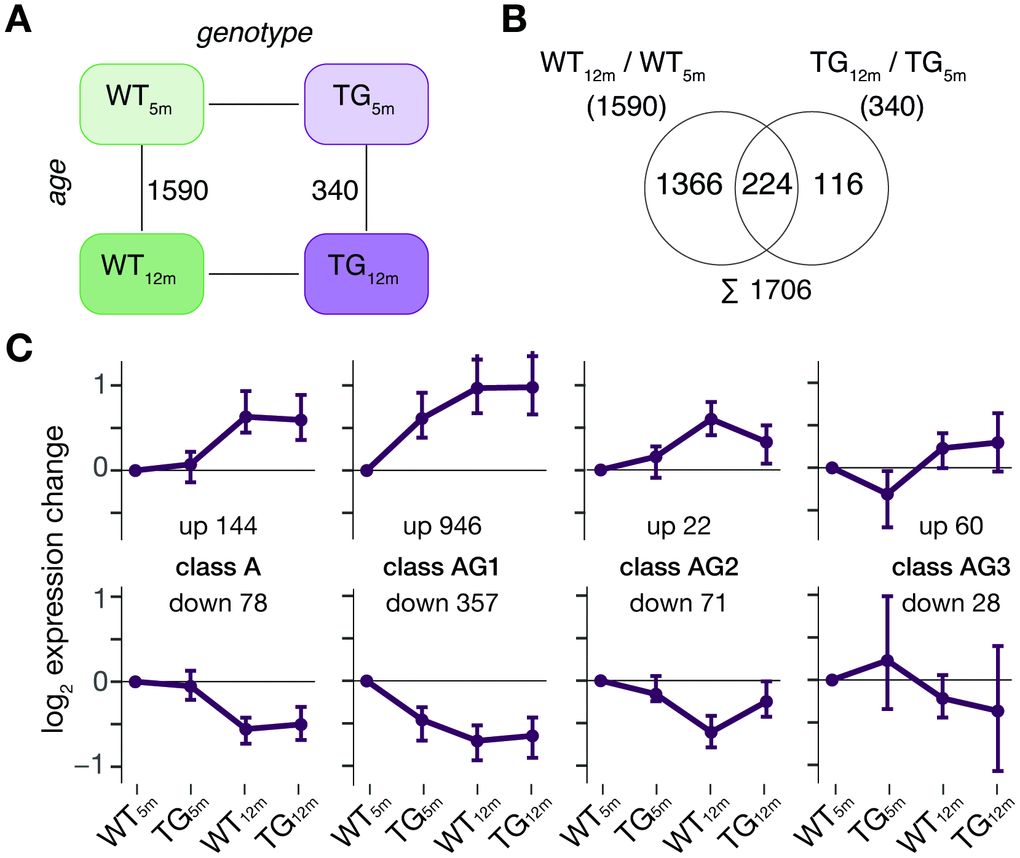
Figure 3. Age-related adaptations in frontocortical gene expression are perturbed in context of SNCA overexpression. (A) Schematic diagram of experimental groups highlighting differentially expressed genes between 5- and 12-month-old rats using the same significance cut-offs of padj ≤ 0.1 and │log2FC│≥ 0.5 as above. (B) Venn diagram comparing DEGs identified in WT and TG rats between 5 and 12 months of age. (C) Partitioning of 1706 DEGs based on their gene expression in 5- and 12-month-old WT and TG rats. Subplots show expression medoids (± SD) of eight primary gene clusters grouped into four classes. Cluster cardinalities indicated.
Together, these results point at distinct classes of aberrant age-related adaptations in transgenic rats, which only become apparent when taking several time points over disease progression into account.
Shared expression changes in rats overexpressing SNCA and PD patients point to myelin-linked genes attributed to oligodendrocytes.
In order to relate gene expression changes between rat and human, we profiled the transcriptome of post mortem tissue from frontal cortex of six PD patients and six healthy controls using RNA-seq (see Supplementary Table 1). SNCA itself showed a tendency of upregulation (log2FC 0.79, padj 0.18) in PD patients (Figure 4A). Among the 2841 DEGs (689 up- and 2152 downregulated) differentially expressed in patients, 38 orthologues were identified in 12-month-old rats, too (Figure 4B). These shared DEGs were most significantly enriched for the biological processes central nervous system myelination, axon ensheathment in central nervous system, and oligodendrocyte development (Figure 4C).
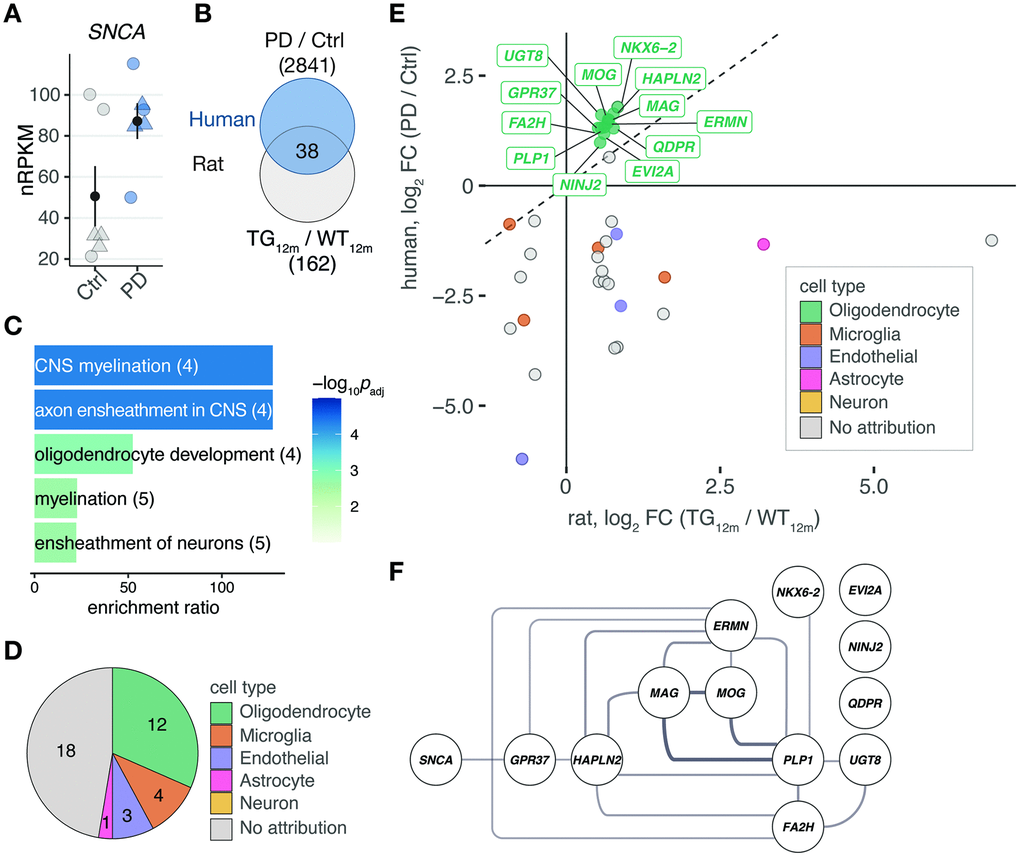
Figure 4. Shared differentially expressed genes in the rat model overexpressing SNCA and PD patients point to myelination and oligodendrocytes. (A) Expression changes of SNCA in PD patients compared to controls plotted as individual data points with mean ± SEM. Circles represent females, rectangles males. (B) Venn diagram comparing 162 DEGs identified in 12-month-old TG rats and 2841 DEGs identified in frontal cortex of PD patients according to cut-offs of padj ≤ 0.1 and │log2FC│≥ 0.5. (C) Overrepresented biological processes among 38 DEGs shared between rat and human (see B). Five most significant terms, their adjusted p-values, enrichment ratios, and underlying gene count shown. (D) Pie chart showing attribution of 38 DEGs shared between rat and human to cell types according to reference data from McKenzie et al. [19]. (E) Scatter plot of 38 DEGs identified in frontal cortex of rat and human. Cell type attributions color-coded. Oligodendrocyte DEGs labelled. (F) Protein-protein interaction network derived from 38 DEGs attributed to oligodendrocytes plus SNCA. Interactions according to String database. Only connected nodes shown. Line width reflects String interaction score.
To further explore the link to oligodendrocytes, the 38 DEGs were examined for their cell type-specific expression in human against reference data for neurons, astrocytes, microglia, oligodendrocytes, and endothelial cells [19]. Strikingly, DEGs specifically expressed in oligodendrocytes represented the largest group (Figure 4D) and showed nearly identical upregulation in 12-month-old rats and PD patients (Figure 4E). Including SNCA to the oligodendrocyte-specific genes through the network of direct (physical) or indirect (functional) protein-protein interactions obtained from String [20], connected SNCA to GPR37 (Figure 4F), a G protein-coupled receptor which has previously been associated with PD [21, 22]. To validate these RNA-seq findings, RT-qPCR was performed for six of the shared oligodendrocyte-linked genes: Fa2h, Gpr37, Mag, Mog, Plp1, and Ugt8 (Figure 5). In rats, a significant increase in gene expression was observed for all six genes (Figure 5A). In humans, the increase of MOG in PD patients reached significance and all other genes showed a strong upregulation trend (Figure 5B).
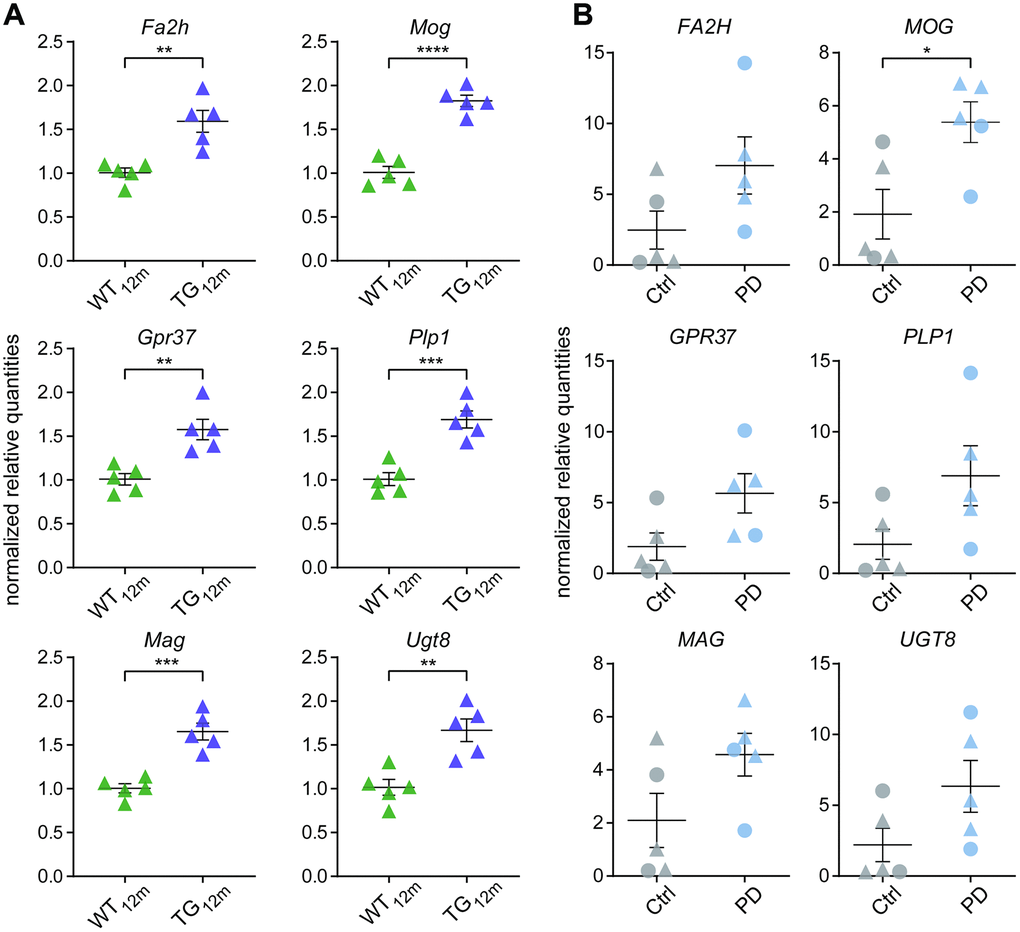
Figure 5. Validation of oligodendrocyte-associated gene expression changes using RT-qPCR. (A) RNA-seq results of shared oligodendrocyte-specific targets were verified by RT-qPCR in rats. RT-qPCR normalized quantities shown relative to WT with individual data points plotted with mean ± SEM. Significances based on unpaired two-tailed t-tests with *p < 0.05, **p < 0.01, ***p < 0.001, ****p < 0.0001. (B) RNA-seq results of shared oligodendrocyte-specific targets were verified by RT-qPCR in human. RT-qPCR normalized quantities shown relative to controls with individual data points plotted with mean ± SEM. Circles represent females, rectangles males. Significances based on unpaired two-tailed t-tests with *p < 0.05.
Together, these results suggest oligodendrocyte-specific perturbances in frontocortical gene expression shared between the rat model and human patients, which potentially impacts on the interaction network of myelin-associated proteins.
Genotype- and age-related perturbations in gene activity cause increase of myelin-linked genes in rats overexpressing SNCA and PD patients
RNA-seq and quantitative PCR results in PD patients showed a significant increase of myelin-associated genes also identified in the rat model (Figures 5 and 6A). Due to the limitations mentioned above for human, tracing these perturbations to an earlier time point and understanding as to how they developed during disease unfolding remains challenging. Here, animal models offer unique advantages and represent ideal systems that allow staging of cohorts, standardizing environmental conditions, and obtaining time series data.
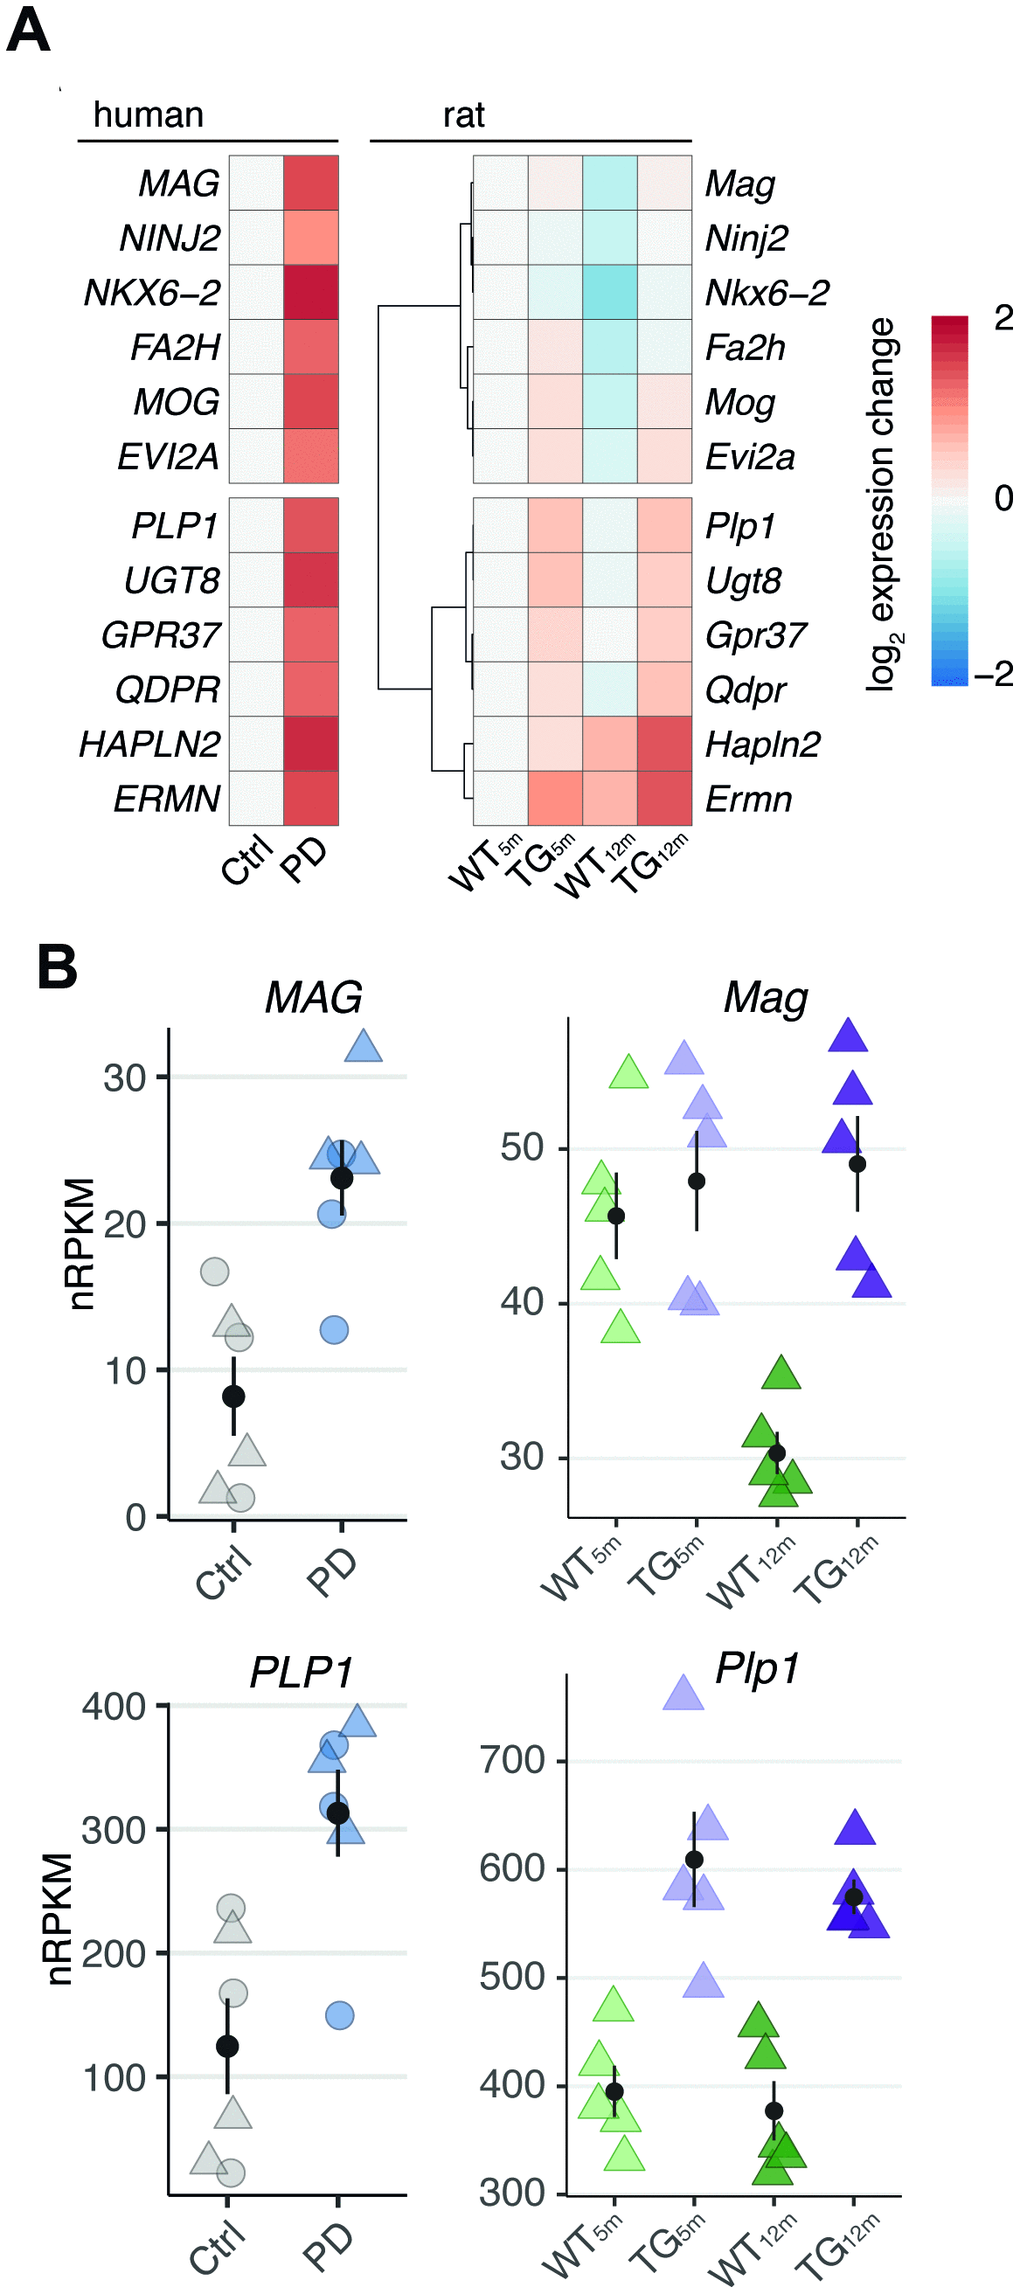
Figure 6. Genotype- and age-related perturbations in gene activity cause increase of myelin-linked genes in rats overexpressing SNCA and PD patients. (A) Left panel shows heatmap of expression changes in frontal cortex of PD patients relative to healthy controls for shared DEGs attributed to oligodendrocytes. Right panel shows hierarchically clustered rat expression changes (relative to WT5m) for the same DEGs. (B) Rat and human expression changes of PLP1 and MAG across experimental groups plotted as individual data points with mean ± SEM. For human data, circles represent females, rectangles males.
Accordingly, we examined the twelve DEGs also in rat by visualizing their expression pattern over time and noticed distinct modes of genotype- and age-related gene expression changes underlying the observed increase (Figure 6A). While, on one hand, genes like PLP1 showed primarily genotype-driven perturbations of altered expression in TG animals irrespective of age (Figure 6B and Supplementary Figure 3) as in class G (Figure 2B, 2C), genes like MAG rather reflected failed age-adequate adaptations (Figure 6B and Supplementary Figure 3) as in class AG2 (Figure 3C).
Taken together, the cross-species data integration suggests oligodendrocyte-specific, myelin-associated gene expression changes to result from two distinctive perturbation modes: either age-independent effects or interferences of SNCA overexpression with age-adequate adaptations of the system.
Discussion
In this study, we examined transcriptome perturbations in frontal cortex of an SNCA overexpressing rat model and post- mortem samples of PD patients. Analyses of these data revealed a strikingly similar increased expression of myelin-associated genes shared between model and human. The temporal expression pattern of these genes in rat suggest their increase to result, on one hand, from age-independent effects of SNCA overexpression and, on the other hand, from interferences of the overexpressed disease gene with age-adequate adaptations in gene activity.
By drawing on cell type-specific human expression data, we were able to attribute the majority of shared differentially expressed genes in frontal cortex of the rat model and patients to be oligodendrocyte-specific. While it is already known for this cell type to play a crucial role in multiple system atrophy (MSA), another synucleinopathy characterized by overexpressed SNCA and accumulation of alpha-synuclein in oligodendrocytes as well as neurons [23], little is known about the role of this cell type in PD. It has been described that oligodendrocytes in PD brains may contain inclusions of alpha-synuclein, referred to as coiled bodies [24, 25].
In line, a recent study integrating GWAS results with single-cell transcriptomic data points to an important role of oligodendrocytes in PD [26]. Specifically, the study shows differentially expressed genes in post-mortem PD brains from six separate cohorts to be enriched for specific cell types: While downregulated genes are attributed to dopaminergic neurons, upregulated genes seem specific for cell types from the oligodendrocyte lineage, agreeing with our findings. In addition, upregulated genes are already strongly enriched for oligodendrocytes at Braak Stages 1-2 [26]. Consistently, we here observed in the rat model increased expression of oligodendrocyte-specific genes already at 12 months of age when motor symptoms begin to fully surface. This suggests perturbations of oligodendrocytes to precede appearance of motor symptoms and pathological changes in the substantia nigra.
A central function of oligodendrocytes is to generate myelin. Despite myelination being crucial for cells that connect cortical and subcortical brain areas [27–29], little is known about the role of myelin in context of aging and neurodegenerative processes [30, 31]. For PD in particular, which has largely been considered a grey matter disease, the role of myelin still is under active debate in the field. While reports generally agree that changes occur in white matter structure as the disease progresses [32–35], they contradict with respect to presumed consequences. On one hand, some studies interpret microstructural changes that are typical for neurodegeneration to reflect loss of white matter due to demyelination and axonal damage [36–39]. On the other hand, recent evidence suggests that changes in white matter microstructure might be compensatory [38, 40, 41].
A lower myelin water fraction, a surrogate for myelin content, has been associated with older age and suggest reduction of myelin with age [42]. Intriguingly, PD patients have a slower decline rate of the myelin water fraction with increasing age [42]. So far, the mechanisms underlying these compensatory alterations have remained unclear. It has been speculated that either the density of axonal packing may be increased in PD patients [38] or, alternatively, compensatory changes may encompass increases in myelin [42].
In line with the latter, we here observed in rat a subset of myelin-associated genes failing to undergo age-adequate adaptations so that their expression remains higher than normal at older age. Hence, failure in adaption of gene activity could indeed reflect compensatory attempts of the system to cope with the overload of disease protein. The slower reduction of myelin and myelin sheath with age in PD patients raises intriguing questions concerning the role of myelin in compensating disease-associated cognitive decline. One could speculate the disease-associated reduction in neuronal function, in turn, to be potentially counter-balanced by myelinated neurons to conduct information faster in the remaining neuronal circuit. To resolve these questions of failure or compensation with respect to the observed effects in PD, our study emphasizes that it is not sufficient to consider the end point of the disease, but to longitudinally trace and relate any alleged perturbations to adequate adaptations of gene activity essential for natural aging.
Materials and Methods
Experimental animals and tissue preparation for RNA isolation
Male homozygous transgenic rats overexpressing the full-length human SNCA gene including its regulatory elements [15] and WT rats with the same genetic background (Sprague-Dawley) were housed in a standard environment till the age of 5 and 12 months. Experimental animals were obtained by crossing heterozygous male with heterozygous female rats, and were confirmed as homozygous or WT by genotyping with quantitative PCR using DNA from ear biopsies with primer sequences specifically for human SNCA (F: 5′-ccgctcgagcggtaggaccgcttgttttagac-3′; R: 5′-ctctttccacgccactatc-3′) and normalized to β-actin as reference (F: 5′-agccatgtacgtagccatcca-3′; R: 5′-tctccggagtccatcacaatg-3′). Animals were anaesthetized, decapitated, and the brain immediately dissected on ice and snap frozen in liquid nitrogen. Subsequently, the tissue was stabilized with RNAlater (Qiagen) at 4°C.
Human samples
Human brain samples were obtained from The Netherlands Brain Bank (NBB), Netherlands Institute for Neuroscience, Amsterdam (open access: http://www.brainbank.nl). All material has been collected from donors for or from whom a written informed consent for a brain autopsy and the use of the material and clinical information for research purposes had been obtained by the NBB. Control brain tissue material was obtained at autopsy from ALS patients at the department of (Neuro)pathology of the Amsterdam UMC, Academic Medical Center, University of Amsterdam, the Netherlands. Informed consent was obtained for the use of brain tissue for research purposes.
The selected cases were than reassessed by two neuropathologists using the routine updated protocol for neurodegenerative diseases [43, 44]. We excluded cases with co-existing other neuropathological lesions (i.e. microvascular infarcts, hippocampal sclerosis, significant Alzheimer Disease neuropathologic changes) to avoid confounding factors. The presence of neuropathological PD hallmarks was assessed following consensus criteria for diagnosis of PD [45].
RNA sequencing of rat and human frontocortical tissue
The polyadenylated fraction of RNA isolated from frontal cortex (n = 5 animals in each of the four experimental groups) was used for RNA-seq. Total RNA, miRNA, and DNA were simultaneously extracted using the DNA/RNA/microRNA Universal Kit (Qiagen) using the manufacturer protocol. Quality was assessed with an Agilent 2100 Bioanalyzer. Samples with high RNA integrity number (RIN > 7) were selected for library construction. Using the TruSeq RNA Sample Prep Kit (Illumina) and 100 ng of total RNA for each sequencing library, poly(A) selected paired-end sequencing libraries (125 bp read length) were generated according to manufacturer’s instructions. All libraries were sequenced on an Illumina HiSeq 2500 platform at a depth of 20–35 million reads each.
Human samples presented a quality with RNA integrity number (4.8 < RIN < 7.6). Library preparation using enrichment of coding RNA was performed for 40 ng of total RNA with the TruSeq RNA Access Library Perp Kit (Illumina). Libraries were sequenced as paired-end 75 bp reads on a NextSeq 500 (Illumina) at a depth of approximately 20 – 45 million reads each.
Quality control, alignment, differential expression, enrichment tests, and functional analyses
Read quality of RNA-seq data in fastq files was assessed using FastQC (v0.11.4) [46] to identify sequencing cycles with low average quality, adapter contamination, or repetitive sequences from PCR amplification. Reads were aligned using STAR (v2.6.0a and v2.7.0a) [47] allowing gapped alignments to account for splicing against a custom-built genome composed of the Ensembl R. norvegicus genome v93 and the human SNCA transgene as well as H. sapiens genome v95. Alignment quality was analyzed using samtools (v1.1) [48]. Normalized read counts for all genes were obtained using Rsubread (v2.0.0) and DESeq2 (v1.18.1) [49]. Transcripts covered with less than 50 reads were excluded from subsequent analyses leaving 12,307 (rat) and 15,337 (human) genes for determining differential expression. The factorial design of the experiment was captured in a general linearized model defining gene expression as a function of genotype, age, and interaction of both. Significance thresholds were set to |log2 FC| ≥ 0.5 and BH-adjusted p-value ≤ 0.1. Surrogate variable analysis (sva, v3.26.0) [50] was used to minimize unwanted variation between samples. Gene-level abundances were derived from DESeq2 as normalized read counts and used for calculating the log2-transformed expression changes of the expression heatmap and medoids. Ratios relative to mean expression in WT5m. Read counts provided by DESeq2 also went into calculating nRPKMs (normalized Reads Per Kilobase per Million total reads) as a measure of relative gene expression as motivated before [51]. Orthologous genes between rat and human were determined with the biomaRt package. Cell type-specific expression data were adapted from McKenzie et al. [19] using the top ranked specificity genes based on human data. WebGestalt was employed to identify overrepresented biological processes among Gene Ontology terms [52].
Reverse transcription-quantitative PCR (RT-qPCR)
RNA-seq results for Fa2h, Gpr37, Mag, Mog, Plp1, and Ugt8 were validated using RT-qPCR with primers specific for rat and human (see Supplementary Table 2 for primers sequences). One hundred nanograms of total RNA were used for reverse transcription (QuantiTect Reverse Transcription kit, Qiagen) following the manufacturer’s instructions. After diluting the resulting cDNA (1:20), 2 μl were used together with SYBR green master mix (Qiagen) and primers (0.25 μM). Expression was calculated relative to the mean of the WT (rat) and control group (human) according to the Pfaffl model [53] after normalizing to the geometric mean relative expression of Pgk1 and Pdhb reference genes in rat, and PGK1 and SDHA in human. Reference genes were selected based on expression stability calculated with Genorm [54] and Normfinder [55]. Differences between the TG and WT group and well as PD patients and controls were tested with unpaired two-tailed t-tests using significance thresholds of p < 0.05.
Data availability
Human RNA-seq data have been deposited at the European Genome-phenome Archive (EGA) hosted by the EBI and the CRG under accession: EGAS00001004425. Raw sequencing files of rat data are available from GEO under accession: GSE150646.
Ethical approval
All experiments were carried out in line with the ethical guidelines of the European Council Directive (2010/63/EU) and were approved by the local Animal Welfare and Ethics committee of the Country Commission Tübingen, Germany (§4 v. 14.11.2016).
All procedures performed using human brain tissue were in accordance with the ethical standards of the Amsterdam University Medical Center and the local Medical Ethics Committee (AMC; W15_092; W16_317) and with the 1964 Helsinki declaration and its later amendments or comparable ethical standards.
Author Contributions
TH and JMSH analysed the data and wrote the manuscript. ZW performed and analyzed the quantitative PCR with support of TFO. CE and EH obtained ethical approval for the animal work and were responsible for breeding, sample collection, and RNA isolation. JDM and EA provided human brain tissues from controls and PD patients with clinical information and isolated RNA from these samples. NC coordinated NGS experiments and, together with JHS, OR, and JMSH conceived and designed the study. All authors read and approved the manuscript.
Acknowledgments
We would like to thank the NGS Competence Center Tübingen (NCCT) for preparing the RNA-seq libraries and sequencing the samples. We would further like to acknowledge support by the German Research Foundation (DFG) and the Open Access Publishing Fund of the University of Tübingen.
Conflicts of Interest
The authors declare no conflicts of interest.
Funding
Research presented in this manuscript received funding from the EU Joint Programme - Neurodegenerative Disease Research (JPND) for the project “Identification of genes that modulate the severity of neurodegenerative diseases (NeuroGem)” (FKZ01ED1507). TH was funded through the Interdisciplinary Center of Clinical Research Tübingen (IZKF, 2596-0-0). JMSH received a fellowship from the Brigitte-Schlieben-Lange program that is supported by the Ministry of Science, Research and the Arts Baden-Württemberg. JDM and EA were funded by the Stichting Parkinson’s fond (Hoofdweg, the Netherlands). TFO was supported by the German Research Foundation (DFG) under Germany’s Excellence Strategy - EXC 2067/1-390729940, and by SFB1286 (project B6). The NGS Competence Center Tübingen was supported by the German Research Foundation (NCCT-DFG, project 407494995).
References
- 1. Spillantini MG, Schmidt ML, Lee VM, Trojanowski JQ, Jakes R, Goedert M. Alpha-synuclein in lewy bodies. Nature. 1997; 388:839–40. https://doi.org/10.1038/42166 [PubMed]
- 2. Monchi O, Petrides M, Mejia-Constain B, Strafella AP. Cortical activity in Parkinson’s disease during executive processing depends on striatal involvement. Brain. 2007; 130:233–44. https://doi.org/10.1093/brain/awl326 [PubMed]
- 3. Owen AM. Cognitive dysfunction in Parkinson’s disease: the role of frontostriatal circuitry. Neuroscientist. 2004; 10:525–37. https://doi.org/10.1177/1073858404266776 [PubMed]
- 4. Steeves TD, Miyasaki J, Zurowski M, Lang AE, Pellecchia G, Van Eimeren T, Rusjan P, Houle S, Strafella AP. Increased striatal dopamine release in Parkinsonian patients with pathological gambling: a [11C] raclopride PET study. Brain. 2009; 132:1376–85. https://doi.org/10.1093/brain/awp054 [PubMed]
- 5. Taylor AE, Saint-Cyr JA, Lang AE. Frontal lobe dysfunction in Parkinson’s disease. The cortical focus of neostriatal outflow. Brain. 1986; 109:845–83. https://doi.org/10.1093/brain/109.5.845 [PubMed]
- 6. Zgaljardic DJ, Foldi NS, Borod JC. Cognitive and behavioral dysfunction in Parkinson's disease: neurochemical and clinicopathological contributions. J Neural Transm (Vienna). 2004; 111:1287–301. https://doi.org/10.1007/s00702-004-0178-z [PubMed]
- 7. Alexander GE, DeLong MR, Strick PL. Parallel organization of functionally segregated circuits linking basal ganglia and cortex. Annu Rev Neurosci. 1986; 9:357–81. https://doi.org/10.1146/annurev.ne.09.030186.002041 [PubMed]
- 8. Brown LL, Schneider JS, Lidsky TI. Sensory and cognitive functions of the basal ganglia. Curr Opin Neurobiol. 1997; 7:157–63. https://doi.org/10.1016/s0959-4388(97)80003-7 [PubMed]
- 9. Brown RG, Marsden CD. Cognitive function in Parkinson’s disease: from description to theory. Trends Neurosci. 1990; 13:21–29. https://doi.org/10.1016/0166-2236(90)90058-i [PubMed]
- 10. Leisman G.a.M, Robert, The Development of the Frontal Lobes in Infancy and Childhood: Asymmetry and the Nature of Temperament and Affect. Hauppauge, NY: Nova Scientific Publishers, 2013: p. 23–56.
- 11. Leisman G. M.R, Carrick F. R, Clinical motor and cognitive neurobehavioral relationships in the basal ganglia, in Basal Ganglia, ed Franz E. Rijeka: InTech, 2013: p. 1–30. https://doi.org/10.5772/55227
- 12. Niethammer M, Feigin A, Eidelberg D. Functional neuroimaging in Parkinson’s disease. Cold Spring Harb Perspect Med. 2012; 2:a009274. https://doi.org/10.1101/cshperspect.a009274 [PubMed]
- 13. Dumitriu A, Golji J, Labadorf AT, Gao B, Beach TG, Myers RH, Longo KA, Latourelle JC. Integrative analyses of proteomics and RNA transcriptomics implicate mitochondrial processes, protein folding pathways and GWAS loci in Parkinson disease. BMC Med Genomics. 2016; 9:5. https://doi.org/10.1186/s12920-016-0164-y [PubMed]
- 14. Dumitriu A, Latourelle JC, Hadzi TC, Pankratz N, Garza D, Miller JP, Vance JM, Foroud T, Beach TG, Myers RH. Gene expression profiles in Parkinson disease prefrontal cortex implicate FOXO1 and genes under its transcriptional regulation. PLoS Genet. 2012; 8:e1002794. https://doi.org/10.1371/journal.pgen.1002794 [PubMed]
- 15. Nuber S, Harmuth F, Kohl Z, Adame A, Trejo M, Schönig K, Zimmermann F, Bauer C, Casadei N, Giel C, Calaminus C, Pichler BJ, Jensen PH, et al. A progressive dopaminergic phenotype associated with neurotoxic conversion of α-synuclein in BAC-transgenic rats. Brain. 2013; 136:412–32. https://doi.org/10.1093/brain/aws358 [PubMed]
- 16. Kohl Z, Ben Abdallah N, Vogelgsang J, Tischer L, Deusser J, Amato D, Anderson S, Müller CP, Riess O, Masliah E, Nuber S, Winkler J. Severely impaired hippocampal neurogenesis associates with an early serotonergic deficit in a BAC α-synuclein transgenic rat model of Parkinson’s disease. Neurobiol Dis. 2016; 85:206–17. https://doi.org/10.1016/j.nbd.2015.10.021 [PubMed]
- 17. Krashia P, Cordella A, Nobili A, La Barbera L, Federici M, Leuti A, Campanelli F, Natale G, Marino G, Calabrese V, Vedele F, Ghiglieri V, Picconi B, et al. Blunting neuroinflammation with resolvin D1 prevents early pathology in a rat model of Parkinson’s disease. Nat Commun. 2019; 10:3945. https://doi.org/10.1038/s41467-019-11928-w [PubMed]
- 18. Hentrich T, Wassouf Z, Riess O, Schulze-Hentrich JM. SNCA overexpression disturbs hippocampal gene expression trajectories in midlife. Aging (Albany NY). 2018; 10:4024–41. https://doi.org/10.18632/aging.101691 [PubMed]
- 19. McKenzie AT, Wang M, Hauberg ME, Fullard JF, Kozlenkov A, Keenan A, Hurd YL, Dracheva S, Casaccia P, Roussos P, Zhang B. Brain cell type specific gene expression and co-expression network architectures. Sci Rep. 2018; 8:8868. https://doi.org/10.1038/s41598-018-27293-5 [PubMed]
- 20. Szklarczyk D, Gable AL, Lyon D, Junge A, Wyder S, Huerta-Cepas J, Simonovic M, Doncheva NT, Morris JH, Bork P, Jensen LJ, Mering CV. STRING v11: protein-protein association networks with increased coverage, supporting functional discovery in genome-wide experimental datasets. Nucleic Acids Res. 2019; 47:D607–13. https://doi.org/10.1093/nar/gky1131 [PubMed]
- 21. Imai Y, Soda M, Inoue H, Hattori N, Mizuno Y, Takahashi R. An unfolded putative transmembrane polypeptide, which can lead to endoplasmic reticulum stress, is a substrate of parkin. Cell. 2001; 105:891–902. https://doi.org/10.1016/s0092-8674(01)00407-x [PubMed]
- 22. Murakami T, Shoji M, Imai Y, Inoue H, Kawarabayashi T, Matsubara E, Harigaya Y, Sasaki A, Takahashi R, Abe K. pael-R is accumulated in lewy bodies of Parkinson’s disease. Ann Neurol. 2004; 55:439–42. https://doi.org/10.1002/ana.20064 [PubMed]
- 23. Valera E, Masliah E. The neuropathology of multiple system atrophy and its therapeutic implications. Auton Neurosci. 2018; 211:1–6. https://doi.org/10.1016/j.autneu.2017.11.002 [PubMed]
- 24. Seidel K, Mahlke J, Siswanto S, Krüger R, Heinsen H, Auburger G, Bouzrou M, Grinberg LT, Wicht H, Korf HW, den Dunnen W, Rüb U. The brainstem pathologies of Parkinson’s disease and dementia with lewy bodies. Brain Pathol. 2015; 25:121–35. https://doi.org/10.1111/bpa.12168 [PubMed]
- 25. Wakabayashi K, Hayashi S, Yoshimoto M, Kudo H, Takahashi H. NACP/alpha-synuclein-positive filamentous inclusions in astrocytes and oligodendrocytes of Parkinson’s disease brains. Acta Neuropathol. 2000; 99:14–20. https://doi.org/10.1007/pl00007400 [PubMed]
- 26. Bryois J, Skene NG, Hansen TF, Kogelman LJ, Watson HJ, Liu Z, Brueggeman L, Breen G, Bulik CM, Arenas E, Hjerling-Leffler J, Sullivan PF, and Eating Disorders Working Group of the Psychiatric Genomics Consortium, and International Headache Genetics Consortium, and 23andMe Research Team. Genetic identification of cell types underlying brain complex traits yields insights into the etiology of Parkinson’s disease. Nat Genet. 2020; 52:482–93. https://doi.org/10.1038/s41588-020-0610-9 [PubMed]
- 27. Fields RD. Myelination: an overlooked mechanism of synaptic plasticity? Neuroscientist. 2005; 11:528–31. https://doi.org/10.1177/1073858405282304 [PubMed]
- 28. Fields RD. White matter in learning, cognition and psychiatric disorders. Trends Neurosci. 2008; 31:361–70. https://doi.org/10.1016/j.tins.2008.04.001 [PubMed]
- 29. Haroutunian V, Katsel P, Roussos P, Davis KL, Altshuler LL, Bartzokis G. Myelination, oligodendrocytes, and serious mental illness. Glia. 2014; 62:1856–77. https://doi.org/10.1002/glia.22716 [PubMed]
- 30. Bartzokis G. Alzheimer’s disease as homeostatic responses to age-related myelin breakdown. Neurobiol Aging. 2011; 32:1341–71. https://doi.org/10.1016/j.neurobiolaging.2009.08.007 [PubMed]
- 31. Ettle B, Schlachetzki JC, Winkler J. Oligodendroglia and myelin in neurodegenerative diseases: more than just bystanders? Mol Neurobiol. 2016; 53:3046–62. https://doi.org/10.1007/s12035-015-9205-3 [PubMed]
- 32. Chen F, Wu T, Luo Y, Li Z, Guan Q, Meng X, Tao W, Zhang H. Amnestic mild cognitive impairment in Parkinson’s disease: white matter structural changes and mechanisms. PLoS One. 2019; 14:e0226175. https://doi.org/10.1371/journal.pone.0226175 [PubMed]
- 33. Huang X, Wen MC, Ng SY, Hartono S, Chia NS, Choi X, Tay KY, Au WL, Chan LL, Tan EK, Tan LC. Periventricular white matter hyperintensity burden and cognitive impairment in early Parkinson’s disease. Eur J Neurol. 2020; 27:959–66. https://doi.org/10.1111/ene.14192 [PubMed]
- 34. Lenka A, Ingalhalikar M, Shah A, Saini J, Arumugham SS, Hegde S, George L, Yadav R, Pal PK. Abnormalities in the white matter tracts in patients with Parkinson disease and psychosis. Neurology. 2020; 94:e1876–84. https://doi.org/10.1212/WNL.0000000000009363 [PubMed]
- 35. Mishra VR, Sreenivasan KR, Yang Z, Zhuang X, Cordes D, Mari Z, Litvan I, Fernandez HH, Eidelberg D, Ritter A, Cummings JL, Walsh RR. Unique white matter structural connectivity in early-stage drug-naive parkinson disease. Neurology. 2020; 94:e774–84. https://doi.org/10.1212/WNL.0000000000008867 [PubMed]
- 36. Gallagher C, Bell B, Bendlin B, Palotti M, Okonkwo O, Sodhi A, Wong R, Buyan-Dent L, Johnson S, Willette A, Harding S, Ninman N, Kastman E, Alexander A. White matter microstructural integrity and executive function in Parkinson’s disease. J Int Neuropsychol Soc. 2013; 19:349–54. https://doi.org/10.1017/S1355617712001373 [PubMed]
- 37. Nagae LM, Honce JM, Tanabe J, Shelton E, Sillau SH, Berman BD. Microstructural Changes within the Basal Ganglia Differ between Parkinson Disease Subtypes. Front Neuroanat. 2016; 10:17. https://doi.org/10.3389/fnana.2016.00017 [PubMed]
- 38. Schuff N, Wu IW, Buckley S, Foster ED, Coffey CS, Gitelman DR, Mendick S, Seibyl J, Simuni T, Zhang Y, Jankovic J, Hunter C, Tanner CM, et al. Diffusion imaging of nigral alterations in early Parkinson’s disease with dopaminergic deficits. Mov Disord. 2015; 30:1885–92. https://doi.org/10.1002/mds.26325 [PubMed]
- 39. Zhang Y, Wu IW, Buckley S, Coffey CS, Foster E, Mendick S, Seibyl J, Schuff N. Diffusion tensor imaging of the nigrostriatal fibers in Parkinson’s disease. Mov Disord. 2015; 30:1229–36. https://doi.org/10.1002/mds.26251 [PubMed]
- 40. Mole JP, Subramanian L, Bracht T, Morris H, Metzler-Baddeley C, Linden DE. Increased fractional anisotropy in the motor tracts of Parkinson’s disease suggests compensatory neuroplasticity or selective neurodegeneration. Eur Radiol. 2016; 26:3327–35. https://doi.org/10.1007/s00330-015-4178-1 [PubMed]
- 41. Sanjari Moghaddam H, Dolatshahi M, Mohebi F, Aarabi MH. Structural white matter alterations as compensatory mechanisms in Parkinson’s disease: a systematic review of diffusion tensor imaging studies. J Neurosci Res. 2020; 98:1398–416. https://doi.org/10.1002/jnr.24617 [PubMed]
- 42. Dean DC
3rd , Sojkova J, Hurley S, Kecskemeti S, Okonkwo O, Bendlin BB, Theisen F, Johnson SC, Alexander AL, Gallagher CL. Alterations of myelin content in Parkinson’s disease: a cross-sectional neuroimaging study. PLoS One. 2016; 11:e0163774. https://doi.org/10.1371/journal.pone.0163774 [PubMed] - 43. Kovacs GG. Molecular pathology of neurodegenerative diseases: principles and practice. J Clin Pathol. 2019; 72:725–35. https://doi.org/10.1136/jclinpath-2019-205952 [PubMed]
- 44. Kovacs G.G, Introduction. In G.Kovacs (Ed.), Neuropathology of Neurodegenerative Diseases: A Practical Guide Cambridge: Cambridge University Press, 2014: p. 1–7. https://doi.org/10.1017/CBO9781107588660.001
- 45. Dickson DW, Braak H, Duda JE, Duyckaerts C, Gasser T, Halliday GM, Hardy J, Leverenz JB, Del Tredici K, Wszolek ZK, Litvan I. Neuropathological assessment of Parkinson’s disease: refining the diagnostic criteria. Lancet Neurol. 2009; 8:1150–57. https://doi.org/10.1016/S1474-4422(09)70238-8 [PubMed]
- 46. Babraham Institute. FastQC: a quality control tool for high throughput sequence data. 2010. http://www.bioinformatics.babraham.ac.uk/projects/fastqc.
- 47. Dobin A, Davis CA, Schlesinger F, Drenkow J, Zaleski C, Jha S, Batut P, Chaisson M, Gingeras TR. STAR: ultrafast universal RNA-seq aligner. Bioinformatics. 2013; 29:15–21. https://doi.org/10.1093/bioinformatics/bts635 [PubMed]
- 48. Li H, Handsaker B, Wysoker A, Fennell T, Ruan J, Homer N, Marth G, Abecasis G, Durbin R, and 1000 Genome Project Data Processing Subgroup. The sequence alignment/map format and SAMtools. Bioinformatics. 2009; 25:2078–79. https://doi.org/10.1093/bioinformatics/btp352 [PubMed]
- 49. Love MI, Huber W, Anders S. Moderated estimation of fold change and dispersion for RNA-seq data with DESeq2. Genome Biol. 2014; 15:550. https://doi.org/10.1186/s13059-014-0550-8 [PubMed]
- 50. Leek JT, Johnson WE, Parker HS, Jaffe AE, Storey JD. The sva package for removing batch effects and other unwanted variation in high-throughput experiments. Bioinformatics. 2012; 28:882–83. https://doi.org/10.1093/bioinformatics/bts034 [PubMed]
- 51. Srinivasan K, Friedman BA, Larson JL, Lauffer BE, Goldstein LD, Appling LL, Borneo J, Poon C, Ho T, Cai F, Steiner P, van der Brug MP, Modrusan Z, et al. Untangling the brain’s neuroinflammatory and neurodegenerative transcriptional responses. Nat Commun. 2016; 7:11295. https://doi.org/10.1038/ncomms11295 [PubMed]
- 52. Liao Y, Wang J, Jaehnig EJ, Shi Z, Zhang B. WebGestalt 2019: gene set analysis toolkit with revamped UIs and APIs. Nucleic Acids Res. 2019; 47:W199–205. https://doi.org/10.1093/nar/gkz401 [PubMed]
- 53. Pfaffl MW. A new mathematical model for relative quantification in real-time RT-PCR. Nucleic Acids Res. 2001; 29:e45. https://doi.org/10.1093/nar/29.9.e45 [PubMed]
- 54. Vandesompele J, De Preter K, Pattyn F, Poppe B, Van Roy N, De Paepe A, Speleman F. Accurate normalization of real-time quantitative RT-PCR data by geometric averaging of multiple internal control genes. Genome Biol. 2002; 3:RESEARCH0034. https://doi.org/10.1186/gb-2002-3-7-research0034 [PubMed]
- 55. Andersen CL, Jensen JL, Ørntoft TF. Normalization of real-time quantitative reverse transcription-PCR data: a model-based variance estimation approach to identify genes suited for normalization, applied to bladder and colon cancer data sets. Cancer Res. 2004; 64:5245–50. https://doi.org/10.1158/0008-5472.CAN-04-0496 [PubMed]