


Introduction
Hematopoiesis is the process of generating mature blood cells and immune cells, which originate in a few populations of hematopoietic stem cells (HSCs) [1, 2]. HSCs are defined as cells with both the capacity to self-renew and the ability to differentiate into various types of myeloid and lymphoid lineages [3, 4]. HSCs are frequently used in therapeutic applications to treat hematologic and immune disorders such as leukemia, anemia, congenital immunodeficiencies, metabolic disorders, and autoimmune diseases [5]. The CD34 antigen, an important biomarker that functions as a regulator of hematopoietic cell adhesion to stromal cells within the marrow microenvironment, is expressed on most HSCs. In clinical settings, cells expressing the CD34 antigen are considered HSCs, and the number of CD34+ cells infused proves to be the major prognostic factor for engraftment and survival [6]. In addition, many studies have demonstrated that the CD34+CD38– fraction contains more primitive HSCs that can undergo hematopoiesis than the CD34+CD38+ fraction [7].
Currently, the main sources of HSCs for transplantation are collected from bone marrow, mobilized peripheral blood and cord blood (CB) [8]; however, the major limitation of CB HSC transplantation is the low number of HSCs in each CB unit, and this insufficient HSC number limits its treatment applications in children and delays the recovery of neutrophils and platelets after transplantation. Therefore, ex vivo expansion of CB HSCs can overcome the above limitations and is an important issue for clinical purposes [1].
For cell culture, serum, especially fetal bovine serum (FBS), is commonly used to support cell proliferation and cryopreservation, although the composition of each batch of serum varies [9]. Importantly, serum might contain bacterial, mycoplasma, and viral contamination and induce an immune response [10]. To comply with clinical regulations, the development of serum-free medium for HSC expansion is essential for basic research and clinical purposes.
Previously, a serum-free medium for ex vivo expansion of HSCs (SF-HSC medium) was proposed by our study using systematic and statistical methodologies [11–13]. After one week of culture, the number of HSCs expanded over 30-fold and satisfied the criteria of colony-forming cells, long-term culture-initiating cells and severe combined immunodeficiency (SCID) mouse-repopulating cells. In addition, serum-free expanded HSCs maintained the ability to differentiate into various types of myeloid and lymphoid lineages in vitro [14–16]. Importantly, our results showed that serum-free expanded HSCs expressed high levels of CD34 and did not express CD38. It is worth noting that the HSCs cultured in SF-HSC medium plus 10% FBS also maintained CD34 expression but induced a high level of CD38 expression. The expression of CD38 in HSCs meant that the cells tended to differentiate and lose the characteristic of stemness. However, the mechanism and pathway between the FBS effect and CD38 expression for HSC expansion have not been well studied; therefore, we aimed to explore the key genes that caused the expression of CD38 in HSCs for expansion under serum-containing conditions using systematic biological approaches and then further investigated the effects of FBS on HSC expansion. In this study, we compared the gene expression profiles of ex vivo-expanded HSCs under serum-containing (10% FBS) and serum-free culture systems and then analyzed the molecular functions of differentially expressed genes using microarray chips (Figure 1). This study provides a transcriptional profile and new insights into the genomic functionality of HSCs under different expanded cultures. Taken together, we believe that serum-free expansion can provide a promising source of primitive and functional HSCs for basic research and clinical applications.
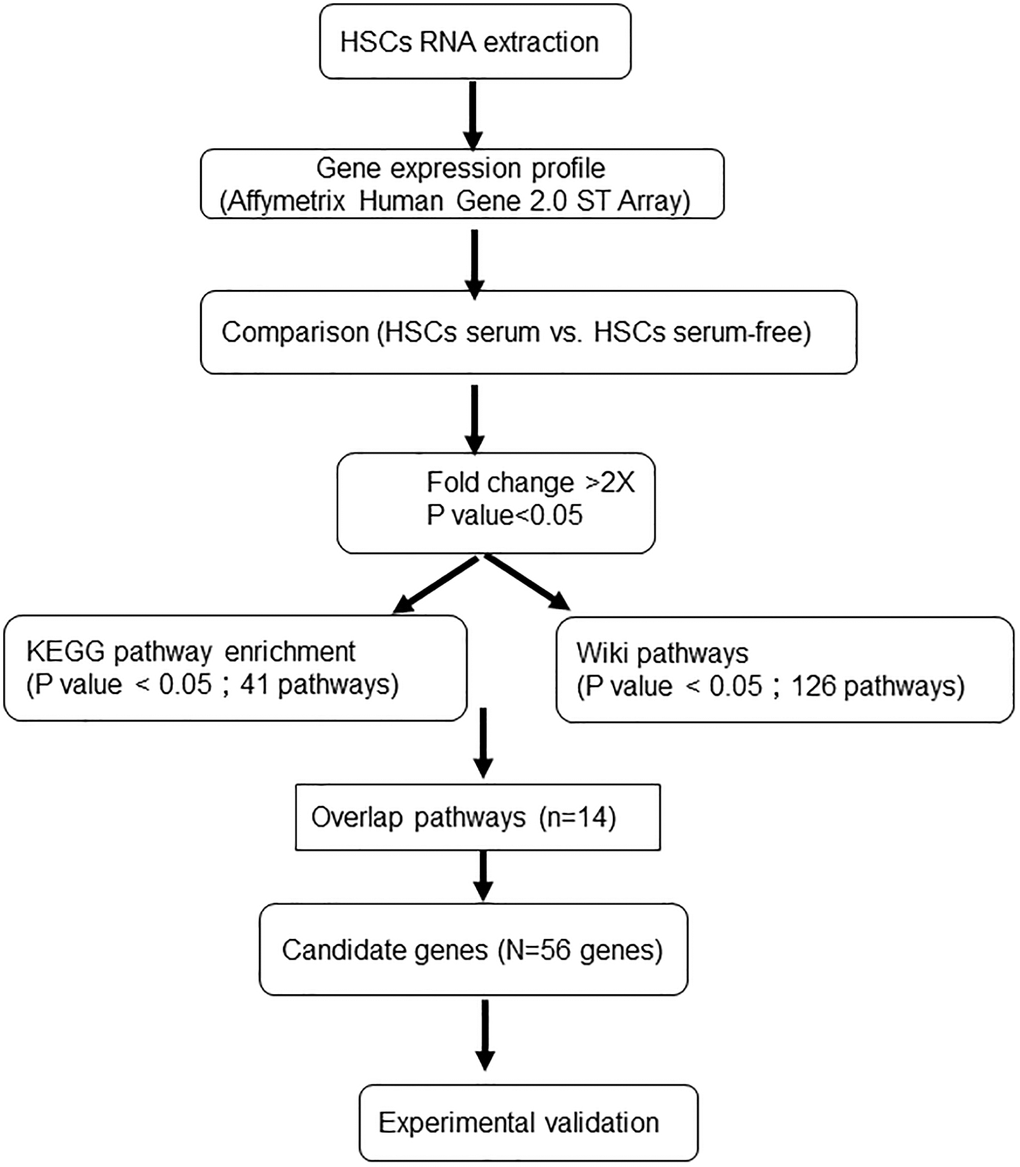
Figure 1. Experimental procedure for the gene microarray analysis of human HSCs expanded under different culture systems.
Results
In vitro expansion of HSCs
We first assessed our two culture conditions as experimental systems for the in vitro expansion of human hematopoietic stem cells. A previous study indicated that specific serum factors stimulated CD38 expression in the erythroid developmental process [7]. To determine whether there were similar effects on undifferentiated HSCs, CD34 and CD38 expression was examined by flow cytometry. CD38 expression on 7-day-expanded HSCs of the serum culture system was increased compared to that on cells of the serum-free culture system (Figure 2). In addition, the expression of other surface antigens on HSCs was also demonstrated (Table 1).
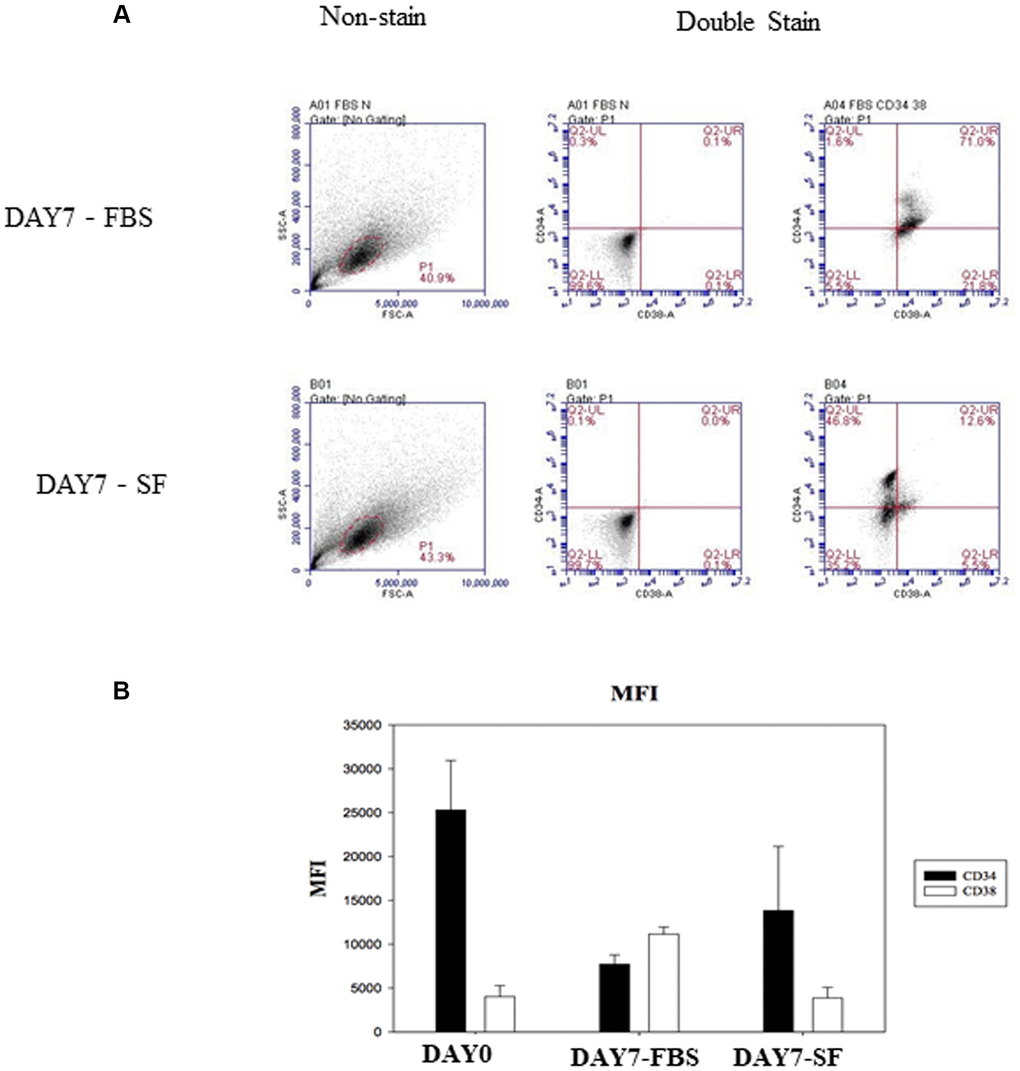
Figure 2. Identify CD34 and CD38 expression by flow cytometry after HSCs cultured for 7 days. (A) The isolated HSC (CD34+/CD38–) were examined by flow cytometry with SSC-conjugated anti-CD34 and FSC-conjugated anti-CD38. Non-stained HSCs are used to determine the background auto-fluorescence to set the negative population allowing cells stained with CD38 and CD34 to be visualized (right side). The percentage of surface marker-positive cells in the population is indicated. (B) Flow cytometry expression of CD34 and CD38 on hematopoietic stem cells. Comparison of mean fluorescence intensity (MFI) of CD34 and CD38 in serum-expanded (DAY7-FBS) vs. serum-free-expanded (DAY7-SF) HSCs.
Table 1. Hematopoietic stem cell surface markers expression under different culture systems.
| ID | Serum Avg (log2) | Serum-free Avg (log2) | Fold change | P-val | Gene symbol | Description | Aliases |
| 16965268 | 7.7 | 5.47 | 4.67 | 4.01E-06 | CD38 | CD38 Molecule | |
| 16698801 | 7.06 | 8.55 | –2.81 | 1.53E-05 | CD34 | CD34 Molecule | |
| 16974534 | 6.06 | 7.66 | –3.03 | 1.48E-05 | PROM1 | Prominin 1 | CD133 |
| 16903140 | 9.72 | 9.22 | 1.41 | 0.0029 | CXCR4 | Chemokine (C-X-C motif receptor 4) | |
| 16745366 | 3.7 | 3.74 | –1.03 | 0.8263 | THY1 | Thy-1 cell surface antigen | CD90 |
| 16966855 | 9.16 | 9.61 | –1.36 | 0.0033 | KIT | v-kit Hardy-Zuckerman 4 feline sarcoma viral oncogene homolog | c-Kit |
| 16675578 | 9.47 | 8.62 | 1.8 | 0.0002 | PTPRC | Protein tyrosine phosphatase, receptor type, C | CD45RA |
Global gene expression profiles of HSCs under different culture systems
To identify the differences in the genomic functions of HSCs expanded in vitro under different culture systems, gene-expression profiles of ex vivo expanded serum and serum-free culture systems were compared, and then the molecular function of differentially expressed genes was analyzed (Supplementary Table 1). First, RNA was obtained from expanded HSCs and compared using cDNA microarrays. To define the differential expression profile within the different cell populations, Affymetrix Transcriptome Analysis Console (TAC) software was used. Genes with fold change >2 or <−2 and with p-value <0.05 were considered significantly altered between the conditions (HSC serum vs. HSC serum-free). In total, 1139 differentially expressed genes between the two culture systems were identified. Hierarchical clustering showed that the transcriptome profiles of the two cell populations were very different (Figure 3A). Of these, 578 genes were upregulated in the serum culture system, and 261 were downregulated (Figure 3B).
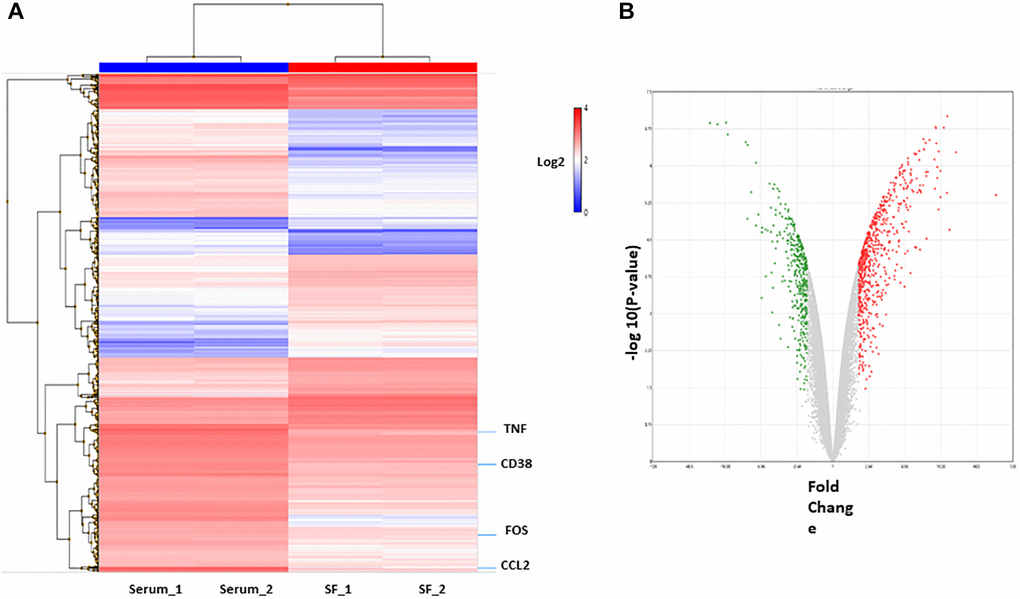
Figure 3. Differentially expressed genes in culture system with or without serum. (A) Hierarchical cluster showing the genes differentially expressed between the two groups. Significant genes (fold change of 2.0 and p < 0.05.) are shown in the heatmap. (B) The volcano plot shows 839 genes differentially expressed (578 genes upregulated (red) and 261 downregulated (green) in serum condition).
Functional annotations of the differentially expressed genes
Pathway enrichment analysis was then used to determine the biological roles of differentially expressed genes. Among these genes, we deleted no gene symbol genes that were no annotated in the databases, and 839 genes were chosen for further annotation. KEGG and Gene Ontology GO pathway analyses provided a measure of the critical functions that were preferentially represented by using DAVID software. Additionally, WikiPathways was also used to analyze the enriched pathways, and there were 14 overlapping pathways between KEGG and WikiPathways (Figure 4A), which included cytokine-cytokine receptor interaction, Toll-like receptor signaling pathway, NF-kappa B signaling pathway and TNF signaling pathway. Among these pathways, we found 56 candidate genes in our enrichment analysis. Most of these genes were classified as cytokines or chemokines that mainly regulated inflammation and the immune response of HSCs in the FBS culture system (Figure 4B). We listed significant differential expression genes involved in inflammation pathway in Supplementary Table 2.
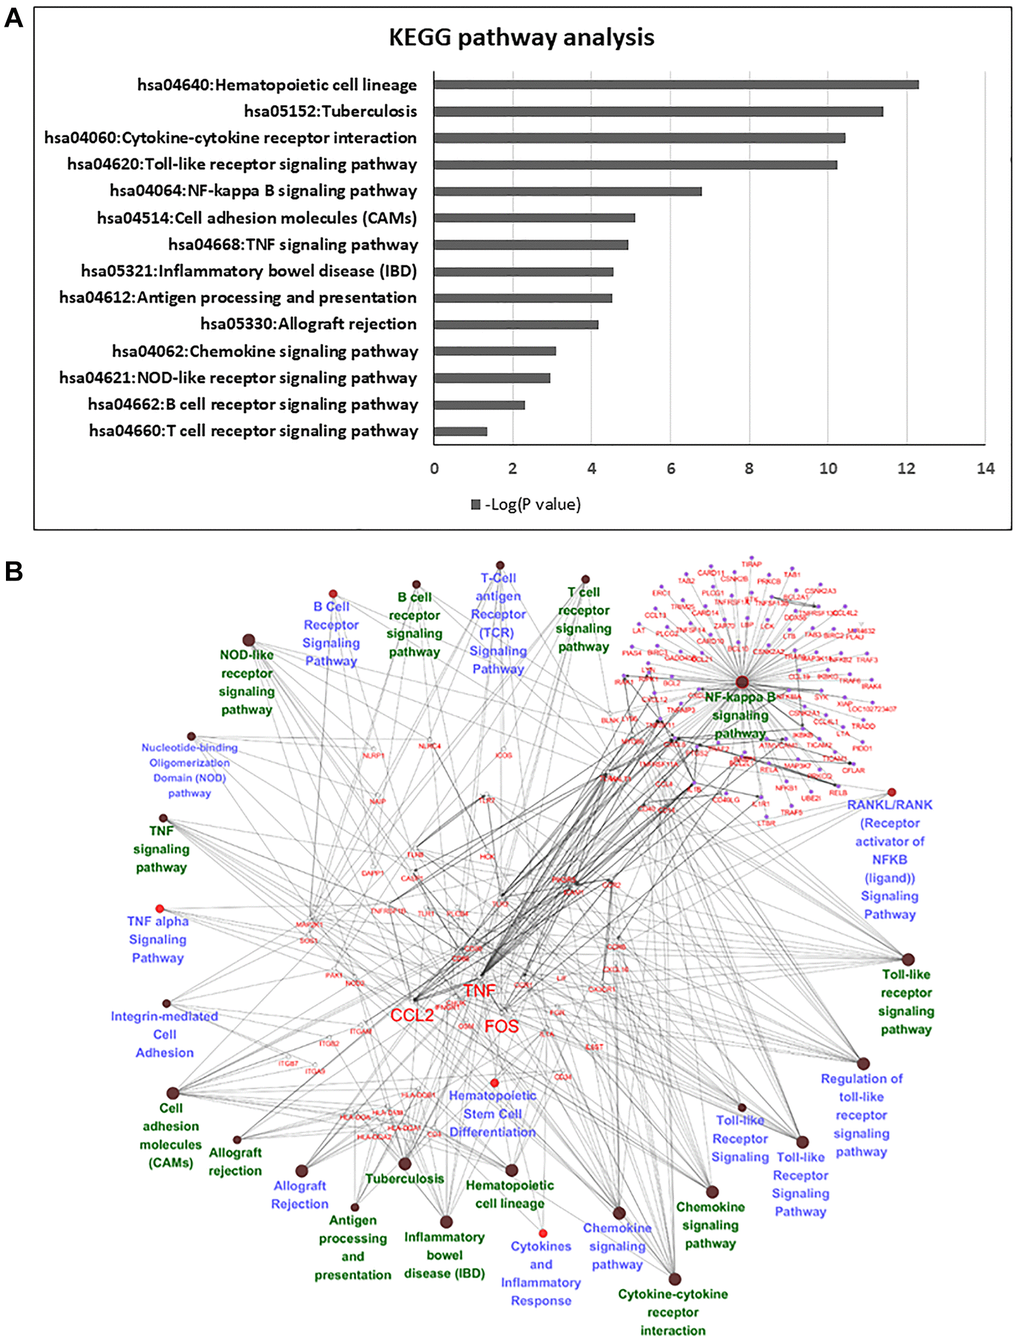
Figure 4. Pathway analysis of differentially expressed genes in serum and serum-free culture systems. (A) The list of candidate genes from 14 overlapping pathways between Wiki pathway and KEGG pathway. (B) Network analysis with cytoscape in 56 candidate genes in the 14 overlapping pathways.
Confirmation of microarray analysis by experimental validation
To validate the microarray results, the CCL2, FOS and TNF genes were selected for experimental validation. These genes are mainly involved in the TNF signaling pathway, which plays an important role in regulating inflammation and cell survival or death [17]. We tested RT-qPCR and Western blotting to determine whether these genes were regulated at both the mRNA and protein levels, and as expected, the CCL2, FOS and TNF genes showed upregulated expression in serum-expanded HSCs (Figure 5A). At the protein level, we further confirmed that the CCL2 protein was increased in serum-expanded HSCs (Figure 5B), whereas FOS and TNF exhibited no significant change in protein expression. We further measured the protein levels in serum and serum-free cultured hematopoietic stem cells by ELISA kits. The results showed that the TNF-α protein levels were not significantly different between the two groups (Supplementary Figure 1).
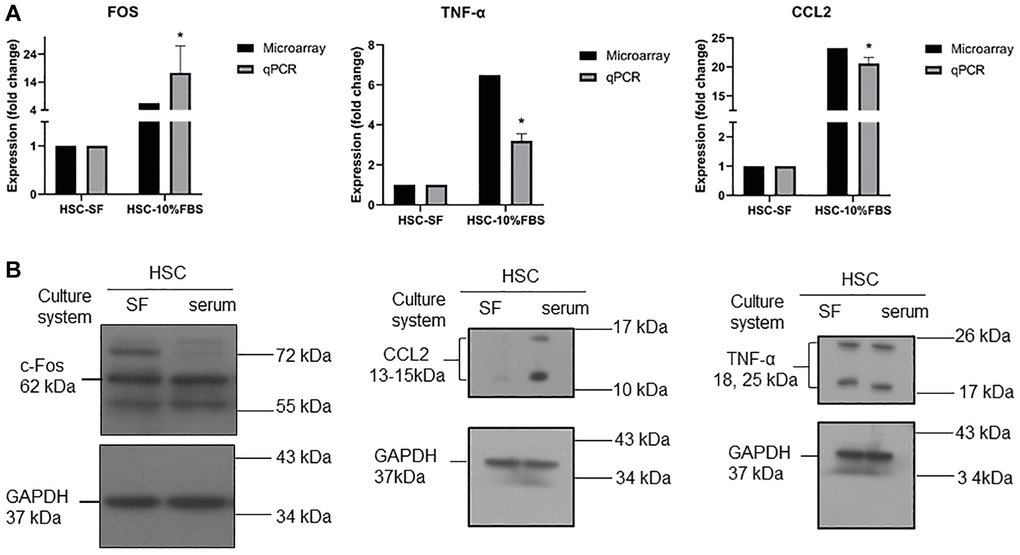
Figure 5. (A) RT-qPCR analysis for mRNA expression of CCL2, TNFα, and FOS in serum and serum-free cultured hematopoietic stem cells. Quantification of gene expression normalized with respect to GAPDH. (n = 3, data are expressed as means ± SD. *p < 0.05 versus serum free condition). (B) Western blot analysis for protein expression of CCL2, TNFα, and FOS in serum and serum-free cultured hematopoietic stem cells. GADPH was used as a loading control.
Expression of other blood cell CD markers on HSCs
By validation of RT-qPCR and Western blotting, CCL2 showed a similar pattern at the mRNA and protein levels. We focused on the CCL2 gene, which most likely regulates the function of HSCs in the FBS culture system. CCL2 is involved in the differentiation of hematopoietic stem cells into monocytes and regulates the inflammatory response of HSCs [18]. Next, we examined the expression of other mature blood cell CD markers in HSCs (Table 2). CD14 and CD4 were highly expressed in the FBS culture system, indicating that HSCs under serum culture conditions are more similar to differentiated blood cells and are associated with inflammation and immune function. CD38 is overexpression in inflammatory pathways [19] and CD38-deficient dendritic cells had an intrinsic inability to mobilize calcium and migrate in response to chemokines C-C chemokine ligand (CCL) [20, 21]. The Schematic showing the FBS serum increase CD38 expression through the C-C chemokine ligand (CCL) associated inflammation pathway (Figure 6).
Table 2. Other blood cells CD markers expression from HSCs microarray results.
| Monocyte/Macrophage | |||||||
| CD marker | Gene symbol | ID | Serum Avg (log2) | Serum-free Avg (log2) | Fold change | P-val | Description |
| CD14* | CD14 | 17000793 | 7.17 | 3.88 | 9.8 | 0.00000343 | CD14 Molecule |
| CD16 | FCGR3A | 16695700 | 2.62 | 2.66 | –1.03 | 0.83 | Fc fragment of IgG, low affinity llla, receptor (CD16a) |
| FCGR3B | 16695715 | 1.5 | 1.67 | –1.3 | 0.5408 | Fc fragment of IgG, low affinity lllb, receptor (CD16b) | |
| NK Cells (Natural killer cells) | |||||||
| CD marker | Gene symbol | ID | Serum Avg (log2) | Serum-free Avg (log2) | Fold change | P-val | Description |
| CD56 | NCAM1 | 16731297 | 2.31 | 2.43 | –1.09 | 0.2209 | Neutral cell adhesion molecule 1 |
| CD marker | Gene symbol | ID | Serum Avg (log2) | Serum-free Avg (log2) | Fold change | P-val | Description |
| T Cells | |||||||
| CD3 | CD3D | 16745016 | 2.03 | 2.16 | –1.1 | 0.336 | CD3d molecule, delta (CD3-TCR complex) |
| CD3E | 16731795 | 2.65 | 2.51 | 1.11 | 0.16 | CD3e molecule, epsilon (CD3-TCR complex) | |
| CD3G | 16731806 | 2.54 | 2.53 | 1.01 | 0.9389 | CD3g molecule, gamma (CD3-TCR complex) | |
| CD4* | CD4 | 16747417 | 6.66 | 5.09 | 2.99 | 0.0000478 | CD4 molecule |
| CD8 | CD8A | 16899928 | 3.92 | 3.74 | 1.13 | 0.1165 | CD8a molecule |
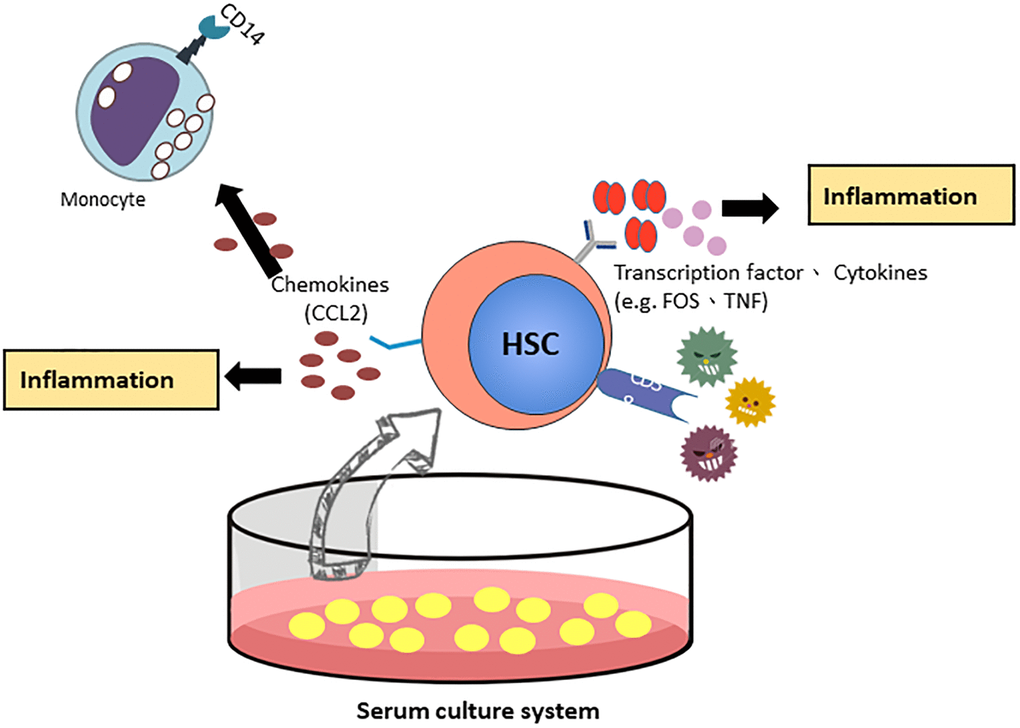
Figure 6. The proposed model of CCL2 involved HSCs ex vivo expanded culture systems.
A systematic approach with gene expression analysis of HSC expansion under different culture systems demonstrated significant differences between FBS and serum-free culture conditions. The results showed that FBS increased the expression of inflammatory signaling pathways that might affect their proliferation, expansion, and differentiation patterns in culture. This finding was consistent with HSC biology and might have implications for HSC expansion and transplantation [22].
Discussion
In this study, CD34+ cells were isolated from human newborn UCB by the magnetic cell sorting method, and the collected HSCs were transferred into an ex vivo culture system under 2 different conditions (serum-free and serum-containing HSC media separately). We demonstrated that the serum-free expanded cells could preserve more primitive stemness, such as surface antigen expression of CD34+ and CD38–; however, the HSCs expanded in the serum-containing (FBS) system for 7 days might express the CD38 surface antigen. In general, the CD34+/CD38– immunophenotype defines a primitive subpopulation of HSCs [23]. CD38 is a kind of NAD glycohydrolase that is usually expressed on erythrocytes, monocytes and macrophages but not on primitive HSCs [7]. In addition, some investigators found that CD38 was more active in the erythrocytes of patients with cancer and systemic diseases, and the increased CD38 expression was notably significant [24].
In normal physiology, the balance between HSC self-renewal and differentiation relies on HSC niches, which are a complex and dynamic environment [25–27]. Since HSCs have great potential for cell therapy, establishing a static ex vivo expansion system under homeostasis and mimicking the physiological HSC niche might be the key step for transplantation. HSCs from human newborn UCB master the continuous production of new blood cells throughout life and promise fast hematopoietic recovery after engraftment [28–30]. Previous studies have reported that HSCs could be expanded in the presence of serum [31, 32] or SF-HSC expansion systems with low and optimal cytokine concentrations [11, 33]. Hence, the aim of this study was to determine the discrepancy between the two culture systems via genomic tools.
According to the results of the microarray and pathway enrichment analyses, we found 14 overlapping pathways between KEGG and WikiPathways, including cytokine-cytokine receptor interaction, Toll-like receptor signaling pathway, NF-kappa B signaling pathway and TNF signaling pathway. Among these pathways, we chose three key genes related to inflammation (CCL2, c-FOS and TNF-α) from 56 candidate genes for further experiments. We focused on these three genes because they were mainly involved in the TNF signaling pathway and regulated cell inflammation, survival, and even death [17]. TNF signaling pathways are complex, and basically, the initial response to TNF is triggered by binding to TNFR1 (TNF receptor 1) and TNFR2 (TNF receptor 2) [34]. Both TNFR1 and TNFR2 have diverse functions and abilities in different tissues to interact with identical or unrelated molecules to regulate the downstream pathway [35]. To maintain homeostatic HSC stemness, cell-intrinsic and cell-extrinsic factors should be controlled tightly.
TNF-α (tumor necrosis factor-α) was named after the discovery of its cytotoxicity to tumor cells in 1984 [36]; it plays a kind of antineoplastic cytokine in cytotoxicity for promoting tumor development and progression [37]. In addition, TNF-α is also proinflammatory and involved in immunomodulation, inflammatory responses, and even all steps of leukemogenesis [34, 38, 39]. Of note, scientists have proven that TNF-α influences HSCs, especially HSCs with long-term exposure to proinflammatory cytokines, and might be linked to self-renewal abilities [40, 41]. HSCs possess both self-renewal and multipotent differentiation capacities; therefore, self-renewal maintenance without differentiation is a crucial issue for ex vivo HSC expansion systems [42].
CCL2 (also called monocyte chemoattractant protein-1, MCP-1) is the best-known CC chemokine, and the physiological functions of CCL2 induce a proinflammatory response on monocytes in the circulatory system [43]; moreover, CCL2 signaling is imperative to recruit mast cells to the tissue, indicating that CCL2 is involved in inflammatory cell trafficking [18]. Another interesting concept is c-FOS, which is a member of the FOS family of transcription factors and can cooperate with c-Jun as a heterodimer (activator protein-1, AP-1). Indeed, c-FOS is regarded as a proto-oncogene, and there have been many reports in the past related to FOS expression in human tumors [44]. Furthermore, it is well known that c-FOS signaling is hypersensitive to the addition of FBS [45, 46]. In other words, serum-containing conditions increased CCL2 expression during HSC expansion. These ex vivo serum-containing expanded cells might directly or indirectly interact with immune cells post engraftment, and thus, might contribute to the outcome of serious inflammation. However, the TNF and FOS protein expression results did not match the mRNA levels. The mRNA-protein relationship remains to be investigated and needs to be further validated. A previous study demonstrated that TNF gene expression is controlled at the transcriptional level in human monocytes [47]. Protein levels are largely determined by transcript concentrations, and posttranscriptional processes may lead to stronger deviations from an ideal correlation [48]. The protein and mRNA expression are determined by the relationships between the rates of the processes producing and degrading the participating molecules. Additionally, post-transcriptional, translational and degradation regulation affected the protein levels. The gene expression levels were not frequently reflected at the protein level and the correlation can be as little as 40% depending on the system [49, 50].
In conclusion, the SF-HSC expansion system mimics steady HSC niches for primitive stemness preservation, and it could provide a safe and high-quality cell source for HSC engraftment. To date, the FBS-based culture system still possesses too many unknown or unpredictable risks, but in contrast, the formula of SF-HSC medium is clearly defined, and the quality is totally guaranteed by standard procedures. As a consequence, we believe that this technique is promising and ready for clinical applications.
Materials and Methods
Isolation of HSCs from umbilical cord blood
Newborn umbilical cord blood (UCB) was collected after approval from the Institutional Review Board of Taoyuan General Hospital, Ministry of Health and Welfare, Taiwan (TYGH104058). After obtaining donor consent, the isolation methods for CD34+ HSCs were as described previously. Briefly, mononuclear cells were isolated from UCB by Ficoll-Paque (Amersham Biosciences, Uppsala, Sweden) density gradient centrifugation. Freshly isolated CD34+ HSCs were obtained from mononuclear cells by magnetic cell sorting using CD34 microbeads and a VarioMACS Separator (Miltenyi Biotec Gmbh, Bergisch Gladbach, Germany).
Ex vivo culture and expansion of HSCs
For HSC expansion under serum-free conditions, CD34+ cells were initially seeded at 5 × 10⁴ cells/mL in SF-HSC medium at 37°C in a 5% CO2 incubator for 7 days. SF-HSC medium was prepared with Iscove’s modified Dulbecco’s medium (IMDM) containing a cytokine cocktail (8.5 ng/mL thrombopoietin (TPO), 4.1 ng/mL IL-3, 15 ng/mL stem cell factor (SCF), 6.7 ng/mL Flt3-ligand, 0.8 ng/mL IL-6, 3.2 ng/mL G-CSF and 1.3 ng/mL GM-CSF; all from PeproTech, Inc., Rocky Hill, NJ) and serum substitutes (1.5 g/L human serum albumin, 4.4 mg/mL human insulin, 60 mg/mL iron-saturated human transferrin and 25.9 μM 2-mercaptoethanol; all from Sigma-Aldrich, St Louis, MO, USA) and sterility and lack of mycoplasma contamination was confirmed. For HSC expansion under serum-containing conditions, CD34+ cells were initially seeded at 5 × 10⁴ cells/mL in SF-HSC medium plus 10% fetal bovine serum (FBS, GE Healthcare Bio-Sciences, Pittsburgh, PA) at 37°C in a 5% CO2 incubator for 7 days. After a 7-day expansion culture, the characteristics of serum-free expanded HSCs were compared with those of serum-containing expanded HSCs (Figure 1).
Analysis of surface antigens
To analyze the surface antigens, anti-CD34 and anti-CD38 fluorescence monoclonal antibodies (eBioscience, San Diego, CA, USA) were used. Matched labeled isotypes were used as controls. The labeled cells were analyzed using a BD Accuri™ C6 flow cytometer with CFlow Plus software (Becton-Dickinson Biosciences, San Jose, CA, USA).
RNA extraction
HSCs were expanded as described above from the same batch of cord blood donations in a 6-well plate. After 7 days of culture, high-quality total RNA was extracted and purified from HSCs grown in different culture systems using the RNeasy Mini Kit (Qiagen, Hilden, Germany). All procedures were performed according to the manufacturers’ instructions.
Microarrays and gene expression analysis
The quality of the RNA samples was measured in an Agilent 2100 Bioanalyzer (Agilent Technologies, Foster City, CA, USA). RNA integrity numbers (RINs) greater than 8 were further processed for microarray studies. Gene expression profiles were evaluated in the Affymetrix GeneChip™ Human Gene 2.0 ST Array (Thermo Fisher Scientific, CA, USA). The detailed protocol for fragmentation, hybridization, washing, staining, and further processing of the arrays was performed according to the manufacturer’s protocol. Array data analysis at the gene level was conducted with Affymetrix Transcriptome Analysis Console (TAC) software. Genes with fold change >2 or <−2 and with p-value < 0.05 were considered significantly differentially expressed between the conditions (HSCs serum vs. HSCs serum-free). All data are publicly available in the Gene Expression Omnibus database (GEO ID: GSE126909).
Functional annotation and pathway analysis
Functional annotation in differentially expressed gene sets was assessed using the Database for Annotation, Visualization, and Integrated Discovery (DAVID) tool (http://david.abcc.ncifcrf.gov/) and WIkiPathways. Gene Ontology (GO) and Kyoto Encyclopedia of Genes and Genomes (KEGG) analyses from the DAVID [51, 52] tool displayed annotated genes involved in enriched pathways if the calculated Expression Analysis Systematic Explorer (EASE) score was below 0.05. Integration of biological networks was performed using Cytoscape [53].
Real time RT-PCR
To confirm differentially expressed genes identified by the microarray analysis, quantitative real-time polymerase chain reaction (RT-qPCR) was performed for the following three selected genes: FOS, CCL2 and TNF. First, a total of 0.1 μg of RNA was converted to first-strand cDNA using the ProtoScript® II First Strand cDNA Synthesis Kit (New England Biolabs, Inc., USA) in the presence of oligo-dT primers. After cDNA amplification reactions were run using the ABI™ StepOne™ Real-Time PCR System (Applied Biosystems, Foster City, CA, USA) with KAPA SYBR® FAST Master Mix (2X) ABI Prism™ (KAPA BIOSYSTEMS, Boston, MA, USA), the gene expression levels were normalized to the expression level of the internal housekeeping gene GAPDH. Relative quantification was calculated using the 2−ΔΔCT method. All oligonucleotides used in this study were designed with PRIMER 3 software available online (http://bioinfo.ut.ee/primer3-0.4.0/). The sequences of the forward (F) and reverse (R) primers are shown in Supplementary Table 3. The results were normalized to GAPDH quantified from the same samples.
Western blotting
For protein extraction, the cells were harvested from the culture dishes and washed using PBS before lysing homogeneously in 30 μl PRO-PREP™ Protein Extraction Solution (iNtRON Biotechnology). Thirty micrograms of total protein were dissolved in 5X loading dye, heated at 95°C for 10 min, and then placed on ice for 3 min for centrifugation. The proteins were separated using SDS-PAGE (5% stacking gel/10 and 12% separating gel) and transferred to a polyvinylidene difluoride (PVDF) membrane. Then, the membrane was blocked using 5% milk in TBST for 1 hour and incubated with a primary antibody (at the appropriate dilution and diluent as recommended in the product datasheet) with gentle agitation overnight at 4°C. The antibodies were purchased as follows: anti-GAPDH antibody [GT239] (HRP) (GeneTex, Inc., USA), rabbit anti-c-Fos polyclonal antibody (Santa Cruz Biotechnology, Santa Cruz, CA), rabbit anti-CCL2 polyclonal antibody (#2027) (Cell Signaling Technology, Leiden, The Netherlands), and anti-TNF-α (D5G9) rabbit monoclonal antibody (Cell Signaling Technology, Leiden, The Netherlands). The membrane was then incubated for 1 hour at RT with anti-rabbit HRP-conjugated secondary antibodies to detect the labeled bands using the Pierce™ ECL substrate (Thermo Fisher Scientific, CA, USA).
TNFα ELISA
The cell-free supernatants were used to determine TNF-α in the conditioned medium with a Human TNF-alpha DuoSet ELISA kit (R&D Systems, Inc., USA).
Author Contributions
CL Y.: conception and design, collection and assembly of data, financial support, manuscript writing and final approval; PY H.: conception and design, financial support, and final approval. YK L.: conception and design, collection and assembly of data and final approval; TC L., TY T. and YT L.: collection and assembly of data, data analysis and interpretation, and final approval; CY C.: manuscript writing and final approval. YC H.: conception and design, financial support, collection and assembly of data, manuscript writing and final approval.
Conflicts of Interest
The authors declare no conflicts of interest related to this study.
Funding
This work was supported by grant [MOST 107-2221-E155-020-MY3] and [MOST 108-2628-E-155-001-MY3] to C-L Yao and [MOST 107-2314-B-008-002-] to Y-C Hsu from the Ministry of Science and Technology, Taiwan. This study is supported by grants from Kaohsiung Medical University, Kaohsiung Medical University Research Center Grant (KMU-TC108B01), Ministry of Science and Technology, Taiwan, 108-2320-B-037-006-. Kaohsiung Municipal Siaogang Hospital, Kmhk-104-041 and H-108-002.
References
- 1. McAdams TA, Miller WM, Papoutsakis ET. Hematopoietic cell culture therapies (Part I): cell culture considerations. Trends Biotechnol. 1996; 14:341–49. https://doi.org/10.1016/0167-7799(96)10047-0 [PubMed]
- 2. Till JE, McCulloch EA. A direct measurement of the radiation sensitivity of normal mouse bone marrow cells. Radiat Res. 1961; 14:213–22. [PubMed]
- 3. Moore KA, Ema H, Lemischka IR. In vitro maintenance of highly purified, transplantable hematopoietic stem cells. Blood. 1997; 89:4337–47. [PubMed]
- 4. Shih CC, Hu MC, Hu J, Medeiros J, Forman SJ. Long-term ex vivo maintenance and expansion of transplantable human hematopoietic stem cells. Blood. 1999; 94:1623–36. [PubMed]
- 5. Felfly H, Haddad GG. Hematopoietic stem cells: potential new applications for translational medicine. J Stem Cells. 2014; 9:163–97. [PubMed]
- 6. Danet GH, Lee HW, Luongo JL, Simon MC, Bonnet DA. Dissociation between stem cell phenotype and NOD/SCID repopulating activity in human peripheral blood CD34(+) cells after ex vivo expansion. Exp Hematol. 2001; 29:1465–73. https://doi.org/10.1016/s0301-472x(01)00750-0 [PubMed]
- 7. Albeniz I, Türker-Şener L, Baş A, Kalelioğlu I, Nurten R. Isolation of hematopoietic stem cells and the effect of CD38 expression during the early erythroid progenitor cell development process. Oncol Lett. 2012; 3:55–60. https://doi.org/10.3892/ol.2011.455 [PubMed]
- 8. Flores-Guzmán P, Gutiérrez-Rodríguez M, Mayani H. In vitro proliferation, expansion, and differentiation of a CD34+ cell-enriched hematopoietic cell population from human umbilical cord blood in response to recombinant cytokines. Arch Med Res. 2002; 33:107–14. https://doi.org/10.1016/s0188-4409(01)00368-x [PubMed]
- 9. Jochems CE, van der Valk JB, Stafleu FR, Baumans V. The use of fetal bovine serum: ethical or scientific problem? Altern Lab Anim. 2002; 30:219–27. https://doi.org/10.1177/026119290203000208 [PubMed]
- 10. Tekkatte C, Gunasingh GP, Cherian KM, Sankaranarayanan K. "Humanized" stem cell culture techniques: the animal serum controversy. Stem Cells Int. 2011; 2011:504723. https://doi.org/10.4061/2011/504723 [PubMed]
- 11. Yao CL, Feng YH, Lin XZ, Chu IM, Hsieh TB, Hwang SM. Characterization of serum-free ex vivo–expanded hematopoietic stem cells derived from human umbilical cord blood CD133+ cells. Stem Cells Dev. 2006; 15:70–78. https://doi.org/10.1089/scd.2006.15.70 [PubMed]
- 12. Yao CL, Liu CH, Chu IM, Hsieh TB, Hwang SM. Factorial designs combined with the steepest ascent method to optimize serum-free media for ex vivo expansion of human hematopoietic progenitor cells. Enzyme Microb Technol. 2003; 33:343–52.
- 13. Yao CL, Hsu SC, Hwang SM, Lee WC, Chiou TJ. A stromal-free, serum-free system to expand ex vivo hematopoietic stem cells from mobilized peripheral blood of patients with hematologic malignancies and healthy donors. Cytotherapy. 2013; 15:1126–35. https://doi.org/10.1016/j.jcyt.2013.04.002 [PubMed]
- 14. Kao IT, Yao CL, Kong ZL, Wu ML, Chuang TL, Hwang SM. Generation of natural killer cells from serum-free, expanded human umbilical cord blood CD34+ cells. Stem Cells Dev. 2007; 16:1043–52. https://doi.org/10.1089/scd.2007.0033 [PubMed]
- 15. Chen TW, Yao CL, Chu IM, Chuang TL, Hsieh TB, Hwang SM. Large generation of megakaryocytes from serum-free expanded human CD34+ cells. Biochem Biophys Res Commun. 2009; 378:112–17. https://doi.org/10.1016/j.bbrc.2008.11.019 [PubMed]
- 16. Chen TW, Hwang SM, Chu IM, Hsu SC, Hsieh TB, Yao CL. Characterization and transplantation of induced megakaryocytes from hematopoietic stem cells for rapid platelet recovery by a two-step serum-free procedure. Exp Hematol. 2009; 37:1330–39.e5. https://doi.org/10.1016/j.exphem.2009.07.012 [PubMed]
- 17. Turner MD, Nedjai B, Hurst T, Pennington DJ. Cytokines and chemokines: at the crossroads of cell signalling and inflammatory disease. Biochim Biophys Acta. 2014; 1843:2563–82. https://doi.org/10.1016/j.bbamcr.2014.05.014 [PubMed]
- 18. Fischer KD, Agrawal DK. Hematopoietic stem and progenitor cells in inflammation and allergy. Front Immunol. 2013; 4:428. https://doi.org/10.3389/fimmu.2013.00428 [PubMed]
- 19. Glaría E, Valledor AF. Roles of CD38 in the Immune Response to Infection. Cells. 2020; 9:228. https://doi.org/10.3390/cells9010228 [PubMed]
- 20. Partida-Sánchez S, Goodrich S, Kusser K, Oppenheimer N, Randall TD, Lund FE. Regulation of dendritic cell trafficking by the ADP-ribosyl cyclase CD38: impact on the development of humoral immunity. Immunity. 2004; 20:279–91. https://doi.org/10.1016/s1074-7613(04)00048-2 [PubMed]
- 21. Beceiro S, Pap A, Czimmerer Z, Sallam T, Guillén JA, Gallardo G, Hong C, A-Gonzalez N, Tabraue C, Diaz M, Lopez F, Matalonga J, Valledor AF, et al. Liver X Receptor Nuclear Receptors Are Transcriptional Regulators of Dendritic Cell Chemotaxis. Mol Cell Biol. 2018; 38:e00534–17. https://doi.org/10.1128/MCB.00534-17 [PubMed]
- 22. Dircio-Maldonado R, Flores-Guzman P, Corral-Navarro J, Mondragón-García I, Hidalgo-Miranda A, Beltran-Anaya FO, Cedro-Tanda A, Arriaga-Pizano L, Balvanera-Ortiz O, Mayani H. Functional Integrity and Gene Expression Profiles of Human Cord Blood-Derived Hematopoietic Stem and Progenitor Cells Generated In Vitro. Stem Cells Transl Med. 2018; 7:602–14. https://doi.org/10.1002/sctm.18-0013 [PubMed]
- 23. Wisniewski D, Affer M, Willshire J, Clarkson B. Further phenotypic characterization of the primitive lineage- CD34+CD38−CD90+CD45RA− hematopoietic stem cell/progenitor cell sub-population isolated from cord blood, mobilized peripheral blood and patients with chronic myelogenous leukemia. Blood Cancer J. 2011; 1:e36. https://doi.org/10.1038/bcj.2011.35 [PubMed]
- 24. Albeniz I, Demir Ö, Türker-Şener L, Yalçintepe L, Nurten R, Bermek E. Erythrocyte CD38 as a prognostic marker in cancer. Hematology. 2007; 12:409–14. https://doi.org/10.1080/10245330701383841 [PubMed]
- 25. Boulais PE, Frenette PS. Making sense of hematopoietic stem cell niches. Blood. 2015; 125:2621–29. https://doi.org/10.1182/blood-2014-09-570192 [PubMed]
- 26. Itkin T, Gur-Cohen S, Spencer JA, Schajnovitz A, Ramasamy SK, Kusumbe AP, Ledergor G, Jung Y, Milo I, Poulos MG, Kalinkovich A, Ludin A, Kollet O, et al. Distinct bone marrow blood vessels differentially regulate haematopoiesis. Nature. 2016; 532:323–28. https://doi.org/10.1038/nature17624 [PubMed]
- 27. Wei Q, Frenette PS. Niches for Hematopoietic Stem Cells and Their Progeny. Immunity. 2018; 48:632–48. https://doi.org/10.1016/j.immuni.2018.03.024 [PubMed]
- 28. Eaves CJ. Hematopoietic stem cells: concepts, definitions, and the new reality. Blood. 2015; 125:2605–13. https://doi.org/10.1182/blood-2014-12-570200 [PubMed]
- 29. Jaing TH. Umbilical cord blood: a trustworthy source of multipotent stem cells for regenerative medicine. Cell Transplant. 2014; 23:493–96. https://doi.org/10.3727/096368914x678300 [PubMed]
- 30. Rödling L, Schwedhelm I, Kraus S, Bieback K, Hansmann J, Lee-Thedieck C. 3D models of the hematopoietic stem cell niche under steady-state and active conditions. Sci Rep. 2017; 7:4625. https://doi.org/10.1038/s41598-017-04808-0 [PubMed]
- 31. Ko KH, Nordon R, O’Brien TA, Symonds G, Dolnikov A. Ex vivo expansion of hematopoietic stem cells to improve engraftment in stem cell transplantation. Methods Mol Biol. 2017; 1524:301–11. https://doi.org/10.1007/978-1-4939-6603-5_19 [PubMed]
- 32. Prosper F, Vanoverbeke K, Stroncek D, Verfaillie CM. Primitive long-term culture initiating cells (LTC-ICs) in granulocyte colony-stimulating factor mobilized peripheral blood progenitor cells have similar potential for ex vivo expansion as primitive LTC-ICs in steady state bone marrow. Blood. 1997; 89:3991–97. [PubMed]
- 33. Hsu SC, Lu LC, Chan KY, Huang CH, Cheng SL, Chan YS, Yang YS, Lai YT, Yao CL. Large-scale production and directed induction of functional dendritic cells ex vivo from serum-free expanded human hematopoietic stem cells. Cytotherapy. 2019; 21:755–68. https://doi.org/10.1016/j.jcyt.2019.04.059 [PubMed]
- 34. Blaser H, Dostert C, Mak TW, Brenner D. TNF and ROS Crosstalk in Inflammation. Trends Cell Biol. 2016; 26:249–61. https://doi.org/10.1016/j.tcb.2015.12.002 [PubMed]
- 35. Locksley RM, Killeen N, Lenardo MJ. The TNF and TNF receptor superfamilies: integrating mammalian biology. Cell. 2001; 104:487–501. [PubMed]
- 36. Aggarwal BB, Moffat B, Harkins RN. Human lymphotoxin. Production by a lymphoblastoid cell line, purification, and initial characterization. J Biol Chem. 1984; 259:686–91. [PubMed]
- 37. Bowers E, Slaughter A, Frenette PS, Kuick R, Pello OM, Lucas D. Granulocyte-derived TNFα promotes vascular and hematopoietic regeneration in the bone marrow. Nat Med. 2018; 24:95–102. https://doi.org/10.1038/nm.4448 [PubMed]
- 38. Semenzato G. Tumour necrosis factor: a cytokine with multiple biological activities. Br J Cancer. 1990; 61:354–61. https://doi.org/10.1038/bjc.1990.78 [PubMed]
- 39. Zhou X, Li Z, Zhou J. Tumor necrosis factor α in the onset and progression of leukemia. Exp Hematol. 2017; 45:17–26. https://doi.org/10.1016/j.exphem.2016.10.005 [PubMed]
- 40. Nakagawa MM, Chen H, Rathinam CV. Constitutive Activation of NF-κB Pathway in Hematopoietic Stem Cells Causes Loss of Quiescence and Deregulated Transcription Factor Networks. Front Cell Dev Biol. 2018; 6:143. https://doi.org/10.3389/fcell.2018.00143 [PubMed]
- 41. Sato T, Onai N, Yoshihara H, Arai F, Suda T, Ohteki T. Interferon regulatory factor-2 protects quiescent hematopoietic stem cells from type I interferon-dependent exhaustion. Nat Med. 2009; 15:696–700. https://doi.org/10.1038/nm.1973 [PubMed]
- 42. Papa L, Djedaini M, Hoffman R. Ex vivo HSC expansion challenges the paradigm of unidirectional human hematopoiesis. Ann N Y Acad Sci. 2020; 1466:39–50. https://doi.org/10.1111/nyas.14133 [PubMed]
- 43. Shi C, Pamer EG. Monocyte recruitment during infection and inflammation. Nat Rev Immunol. 2011; 11:762–74. https://doi.org/10.1038/nri3070 [PubMed]
- 44. Abarrategi A, Gambera S, Alfranca A, Rodriguez-Milla MA, Perez-Tavarez R, Rouault-Pierre K, Waclawiczek A, Chakravarty P, Mulero F, Trigueros C, Navarro S, Bonnet D, García-Castro J. c-Fos induces chondrogenic tumor formation in immortalized human mesenchymal progenitor cells. Sci Rep. 2018; 8:15615. https://doi.org/10.1038/s41598-018-33689-0 [PubMed]
- 45. Johnson RS, Spiegelman BM, Papaioannou V. Pleiotropic effects of a null mutation in the c-fos proto-oncogene. Cell. 1992; 71:577–86. [PubMed]
- 46. Rankin CA, Grantham JJ, Calvet JP. C-fos expression is hypersensitive to serum-stimulation in cultured cystic kidney cells from the C57BL/6J-cpk mouse. J Cell Physiol. 1992; 152:578–86. https://doi.org/10.1002/jcp.1041520318 [PubMed]
- 47. Sariban E, Imamura K, Luebbers R, Kufe D. Transcriptional and posttranscriptional regulation of tumor necrosis factor gene expression in human monocytes. J Clin Invest. 1988; 81:1506–10. https://doi.org/10.1172/jci113482 [PubMed]
- 48. Liu Y, Beyer A, Aebersold R. On the Dependency of Cellular Protein Levels on mRNA Abundance. Cell. 2016; 165:535–50. https://doi.org/10.1016/j.cell.2016.03.014 [PubMed]
- 49. Vogel C, Marcotte EM. Insights into the regulation of protein abundance from proteomic and transcriptomic analyses. Nat Rev Genet. 2012; 13:227–32. https://doi.org/10.1038/nrg3185 [PubMed]
- 50. Maier T, Guell M, Serrano L. Correlation of mRNA and protein in complex biological samples. FEBS Lett. 2009; 583:3966–73. https://doi.org/10.1016/j.febslet.2009.10.036 [PubMed]
- 51. Shao Z, Zhao H, Zhao H. DNA assembler, an in vivo genetic method for rapid construction of biochemical pathways. Nucleic Acids Res. 2009; 37:e16. https://doi.org/10.1093/nar/gkn991 [PubMed]
- 52. Huang TT, Gonzales CB, Gu F, Hsu YT, Jadhav RR, Wang CM, Redding SW, Tseng CE, Lee CC, Thompson IM, Chen HR, Huang TH, Kirma NB. Epigenetic deregulation of the anaplastic lymphoma kinase gene modulates mesenchymal characteristics of oral squamous cell carcinomas. Carcinogenesis. 2013; 34:1717–27. https://doi.org/10.1093/carcin/bgt112 [PubMed]
- 53. Cline MS, Smoot M, Cerami E, Kuchinsky A, Landys N, Workman C, Christmas R, Avila-Campilo I, Creech M, Gross B, Hanspers K, Isserlin R, Kelley R, et al. Integration of biological networks and gene expression data using Cytoscape. Nat Protoc. 2007; 2:2366–82. https://doi.org/10.1038/nprot.2007.324 [PubMed]