


Introduction
The Pachytene CHeckpoint 2 (pch-2) gene has been studied for its functions in monitoring and correcting DNA errors during cell mitosis [1]. In budding yeast, PCH2 and silent information regulator 2 (SIR2) are found predominantly in the nucleolus. Mutation of PCH2, or SIR2, bypasses checkpoint-induced pachytene arrest, and PCH2 and SIR2 are both needed to prevent meiotic interhomolog recombination within the repeated ribosomal RNA genes that are present in the nucleolus [1, 2]. Increased expression of the SIR2 family proteins, now called the ‘‘sirtuins,’’ has been shown to enhance lifespan in a range of organisms, including S. cerevisiae, C. elegans, D. melanogaster, and M. musculus. The lifespan extension for animals imparted by the sirtuins is up to 50% [3]. However, new data indicate that some of the reported effects in C. elegans and D. melanogaster may have been due to confounding genetic backgrounds and other aspects in experimental designs [4-6]. The latest study in brain-specific Sirt1-overexpressing (BRASTO) transgenic mice demonstrated a significant life span extension of 11%, and aged BRASTO mice also exhibited a clear delay in aging phenotypes [7]. Over-expression of Sirt6, another mammalian homolog of Sirt2, extends lifespan in male mice around 15%, but has no effects in females [8]. However, no functional association between PCH2 and SIR2 has ever been linked to aging or to lifespan before. Based on these observations, we investigated whether there exists a link between pch-2 expression, and lifespan, in C. elegans. Our findings suggest that there is an association.
Results
To study the evolutionary conservation of pch-2, we first examined protein sequences of Pch-2 and its homologs among various species using the NCBI RefSeq database. We performed a phylogenetic analysis using Phylogeny.fr [9], and the protein sequence alignment of Pch-2 and its homologs was evaluated. Pch-2, similar to Sir2, is an evolutionarily conserved gene with a functional domain of P-loop_NTPase, that is found across species including yeast (S. cerevisiae), worm (C. elegans), fly (D. melanogaster), zebrafish (D. rerio), rodent (R. novegicus, M. musculus) and human (H. sapiens) (Fig. 1a & Supplement Table 1). Interestingly, the meiotic checkpoint function of pch-2 and its homologs have been studied not only in yeast, but also in worm and mouse [10, 11]. Collectively, these findings provide evidence for evolutionarily conserved functions for pch-2 in both recombination, and in the formation of higher order chromosome structures. We thus concluded that pch-2 provides some fundamental function across the animal kingdom.
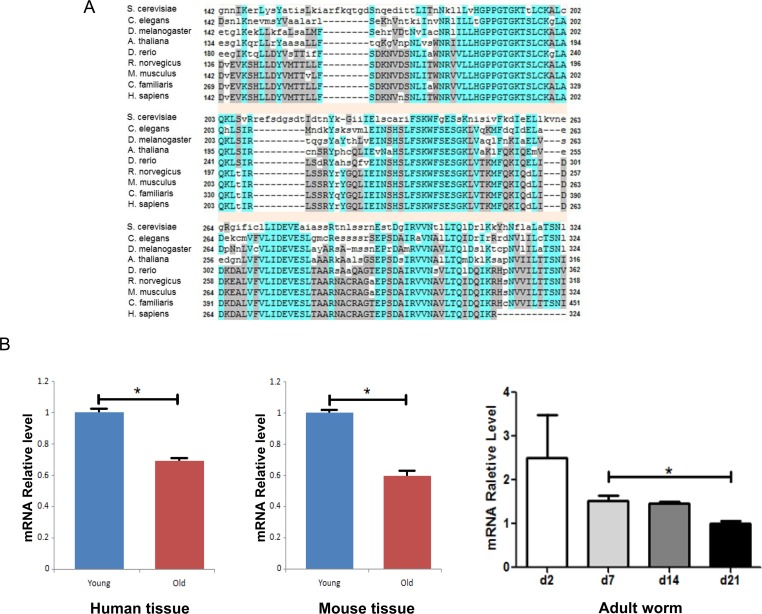
Figure 1. Pch-2 is an evolutionarily conserved gene and its expression declines with tissue aging across species (A) Sequences alignment of pch-2 genes cross species ranging from yeast, worm, fly and rodent, to human. (B) Pch-2 mRNA expression changes with age in human, mouse and worm. * indicates p <0.05.
To evaluate expression of pch-2 homologs in mammalian species, we examined brain and gonadal tissues from mouse and human samples, since pch-2 is known to be involved in preventing meiotic inter-homolog recombination. We measured expression levels of pch-2 homolog TRIP13 mRNA in young subjects (N=5 for 3 month-old mice from two aging colonies, C57B/6 and DBA2; N=8 for 18-25 year-old humans) and old subjects (N=5 for 22 month-old for mice, from two aging colonies; and N=10 for >60 year-old humans). We found that expression declines significantly with physiological aging in ovary and brain tissues of both human and mouse (Fig. 1B). This was judged by both fold change in mRNA expression, as well as by p-values for mouse and human tissues. We also observed a clear trend of decreasing pch-2 expression in C. elegans over the lifespan of the animals, from day 2 to day 21 (Fig 1B). This observation suggests an evolutionarily conserved loss of expression of pch-2 with tissue aging, in C. elegans, mouse and human.
To investigate any potential role in the pch-2 gene family in lifespan and stress resistance, we first generated a human pch-2 homolog - TRIP13 - over-expression retroviral vector (see Supplement). We used this retrovirus to infect normal dermal human fibroblasts under hygromycin selection, and compared the TRIP13-overexpressing fibroblasts to those infected with empty vector, as well as non-infected controls. We found, after retroviral infection and hygromycin selection, that doubling times of WT, empty vector, and TRIP13 over-expressing populations were 57 hour, 84 hours and 130 hours, respectively. After populations were established under selection, we applied the environmental stressors 600uM H2O2 (oxidative stress), 10uM etoposide (apoptotic stress) and the UV radiation (DNA damage stressor) at 50J/m2. After 600uM H2O2 treatment, the TRIP13 over-expressing populations showed significantly enhanced cell survival rate when compared to control groups, both the empty vector and WT (Fig. 2A, p<0.0001). When treated with 10uM etoposide for 3 days, TRIP13 over-expressing cells also survived at a significantly higher rate (Fig. 2B, p<0.001). Similar results were observed in TRIP13 over-expressing populations after UV radiation when compared to the control groups (Fig. 2C, p<0.01). Importantly, since the population doubling times of TRIP13-transfected cells was slower than that of controls, this improved survival after application of stressors was not simply an artifact of faster cell cycling. This indicates that TRIP13 confers an enhancement of fibroblast cell survival under various stressors of oxidation, apoptosis and DNA damage. All of these stressors are potentially involved in the normal aging process.
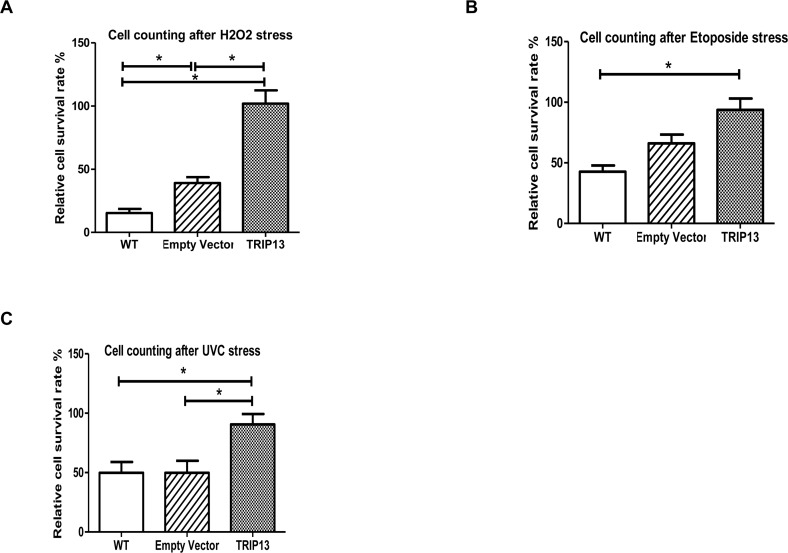
Figure 2. TRIP13 over-expression human fibroblast cells are resistant to stressors of oxidation, apoptosis and DNA damage (A) After 600uM H2O2 treatment, the TRIP13 over-expression fibroblast cells showed enhanced cell numbers when compared to control cells, wild type (WT) and empty vector (p<0.0001). (B) TRIP13 over-expression fibroblasts were treated with 10uM etoposide for 3 days, and exhibited higher cell numbers following treatment (p<0.001). (C) TRIP13 cells demonstrated significantly higher resistance after UV radiation when compared to the control groups (p<0.01). (Relative cell survival was as compared to numbers of cells plated originally, prior to culturing and stressors.) * indicates significant differences between groups.
Based upon these observations, we wondered whether pch-2 plays a role in longevity. Given that lifespan in C. elegans is only 3-4 weeks, as opposed to approximately 2-3 years in mice [12, 13], we elected to examine the impact of the pch-2 gene on lifespan in C. elegans. We first generated pch-2 over-expressing C. elegans lines by a microinjection method (Supplement Fig.1), and studied the functional impact of pch-2 on worm longevity. To identify over-expressing pch-2 lines, we selected those animals co-expressing GFP by direct visualization. In GFP-expressing lines, we also measured the expression levels of pch-2 using quantitative reverse transcription polymerase reaction (qRT-PCR). We distinguished between the expression of endogeneous and exogenous pch-2 by using an expression vector-specific primer and a pch-2-specific primer. In GFP-positive over-expressing lines, the level of exogenous pch-2 expression was three times higher than the level of endogenous pch-2 in the wild-type (WT) controls with selection marker GFP (Fig. 3A, Fig. 3B). After confirming over-expression of pch-2, we then subjected pch-2 over-expressing and WT worms to a lifespan measurement [14]. The median lifespans of WT and pch-2 over-expressers were 18 days and 22 days, respectively, with maximum lifespans of 28 days and 35 days, respectively (Fig. 3C). Hence, pch-2 over-expressing lines extended both median and maximum lifespan by approximately 25% as compared to WT (log rank test, n=126/140, p<0.001).
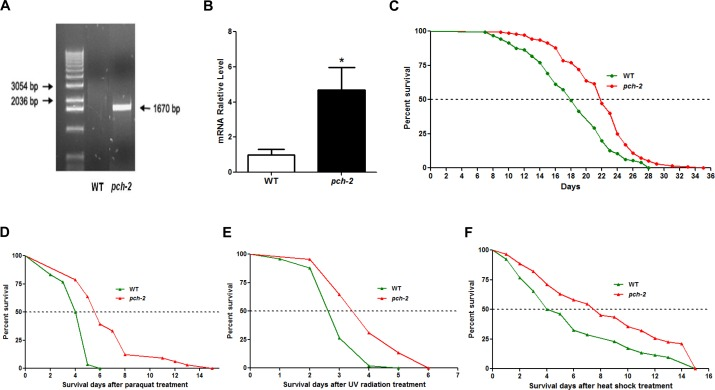
Figure 3. Pch-2 over-expression extends lifespan and enhances stress-resistance in C. elegans (A) genotyping of pch-2 shows a band at 1670bp indicating the transgene in the pch-2 over-expressing line. (B) qRT-PCR validation of pch-2 over-expression worm lines by using transgene-specific primers shows increased pch-2 gene expression (p<0.01). (C) lifespan measurement was conducted for both WT (GFP-expressing, n=126) and pch-2 over-expressing (n=140) animals. Both median lifespan and maximum lifespan of pch-2 over-expression lines show a 25% extension when compared to WT lines (p<0.001, p values were derived from student t test and log-rank test). (D) After 4mM paraquat treatment, the median survival of pch-2 over-expressing lines (n=33) was increased by 40%, and the maximum survival of pch-2 over-expressing lines was increased 150% (n=30) (p<0.001). (E) The median survival of pch-2 over-expressing lines (n=49) was increased 45% after UV radiation when compared to WT (n=45) (p<0.001). (F) With heat shock, the median survival of pch-2 over-expressing lines (n=62) was increased by 85% when compared to WT (n=52) (p<0.001).
We next determined whether pch-2 over-expressing lines could withstand various stressors better than WT (GFP-expressing) controls. Young adult worms with pch-2 over-expression and controls were treated on day 1 with the oxidative stressor paraquat at 4 mM for their survival duration. The median survival of pch-2 over-expressing lines was 5.6 days, while that of control lines was 4.0 days. The maximum survival of pch-2 over-expression and WT lines were 15 days and 6 days, respectively, which is an increase of 40% and 150% in median and maximal survival for pch-2 over-expressers (p<0.001 for both median and maximal survival as compared to WT controls by log rank test) (Fig. 3D).
To provide a DNA damage stressor, day 1 worms were exposed to UV radiation at 0.1 J/cm2. The median survival of pch-2 over-expressing lines was 3.4 days and that of control lines was 2.6 days after UV radiation, while the maximum survival were 6 days and 5 days, respectively (45% and 20% higher for pch-2, respectively, p<0.001) (Fig. 3E). Lastly, heat shock was administered on day 1 worms at 35°C for 2 hours, after which animals were removed to routine conditions and their survival tallied. Intriguingly, the median survival of pch-2 over-expression lines was 85.0% longer than that of control lines (7.4 days vs. 4 days) (p<0.0001), but the maximum survival was not changed between two lines (Fig. 3F). Hence, pch-2 conferred significantly increased resistance to multiple stressors which affect both DNA and protein integrity [15].
As further confirmation of our observations, we examined lifespan after RNAi-induced pch-2 and sir-2 knockdown in WT N2 animals. A pch-2 specific RNAi clone F10B5.5 and a sir-2 specific RNAi clone T27E4.8 were used to feed WT N2 worms, thereby reducing pch-2 and sir-2 expression. The median lifespan of RNAi vector animals was 17 days, but this was shortened to 10.5 days after pch-2 RNAi treatment. Maximum lifespan shortened to 19 days from 27 days, and both median and maximum lifespan were significantly shortened by pch-2 RNAi treatment (p<0.0001) (Fig. 4A). Interestingly, similar results were also obtained from RNAi inhibition in sir-2 WT N2 animals (Fig. 4A). Only one-third expression level of pch-2 and sir-2 remained after RNAi treatment, as assessed by qRT-PCR (Fig. 4B & C). Furthermore, RNAi treatment was specific, and treatment of worms with pch-2 RNAi did not impact transcript levels for sir-2, for example. Hence, knockdown of sir-2 and pch-2 resulted in similar decrements in lifespan in WT worms.
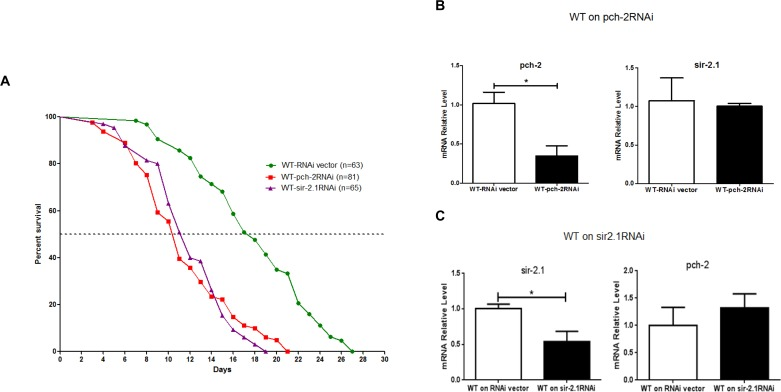
Figure 4. Inhibition of pch-2 and sir-2 expression by RNAi impacts lifespan (A) A shortened lifespan, both median (62%, 64%) and maximum (70%, 78%), was caused by pch-2 and sir2 specific RNAi (n=81, 65) as compared to RNAi vector lines (n=63) (p <0.0001). (B) In WT worms, RNAi for pch-2 resulted in significantly reduced expression by ~ 70% as validated by qRT-PCR, but did not have a significant effect on sir-2 transcripts. (C) Similarly, in WT worms, RNAi for sir-2 resulted a significant reduction of sir-2 expression about 50% by qRT-PCR validation, and without notable effect on pch-2 expression (*p <0.001).
In addition, we evaluated the lifespan of pch-2 over-expression worm lines when subjected to pch-2 RNAi treatment. The median lifespans of pch-2 RNAi and pch-2 over-expressers were 7 days and 23 days, respectively, with maximum lifespans of 20 days and 36 days, respectively (Fig. 5). Hence, pch-2 RNAi inhibition in pch-2 over-expressing lines shortened both median and maximum lifespan significantly when compared to pch-2 over-expressing worms (log rank test, p<0.0001).
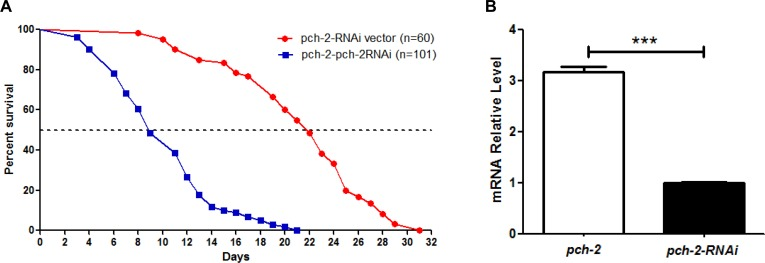
Figure 5. Inhibition of pch-2 by RNAi impacts lifespan of pch-2 over-expressing C. elegans (A) A shortened lifespan, both median (30%) and maximum (56%), was induced by pch-2-specific RNAi in C. elegans that were engineered to over-express pch-2 (n=101), as compared to RNAi vector lines (n=60) (p <0.0001). (B) qRT-PCR validated the RNAi effect, indicating a significant reduction (~70%) of pch-2 transcripts in pch-2 over-expressing worms treated with RNAi. ***p <0.001.
To further investigate the role of pch-2 in worm longevity, we wondered if pch-2 and sir-2 may have functional connections in worm lifespan determination. Therefore, we scrutinized the lifespan of pch-2 over-expressing worm lines with sir-2 RNAi treatment, and the sir-2 longevity worm line (LG394 from CGC) when subjected to pch-2 RNAi treatment. The median lifespans sir-2 longevity animals that were subjected to pch-2 RNAi, and the sir-2 longevity line itself, were 14 days and 23 days, with maximum lifespans of 22 days and 29 days, respectively (Fig. 6A). The median lifespans of pch-2 over-expressors that were exposed to sir-2 RNAi, and the untreated pch-2 over-expressers, were 14 days and 23 days, with maximum lifespans of 22 days and 31 days, respectively (Fig. 6A). Hence, pch-2 RNAi inhibition in the sir-2 longevity line, and sir-2 RNAi inhibition in pch-2 over-expressing lines, shortens both median and maximum lifespan significantly, and by a similar amount (log rank test, p<0.0001 for both lines) (Fig.6). qRT-PCR confirmation on the impact on the transcript levels of pch-2 and sir-2 RNAi showed a clear effects of pch-2 and sir-2 inhibition (Fig. 6B & C), confirming that RNAi treatment knocked down the target transcripts. However, there were no observed cross-over effects of both RNAi administrations on each other (Fig. 6B & C). These genetic epistasis studies show that pch-2 and sir-2 operate independently and reciprocally to extend lifespan of worms, and that expression levels of one gene do not appear to directly impact expression levels of the other gene.
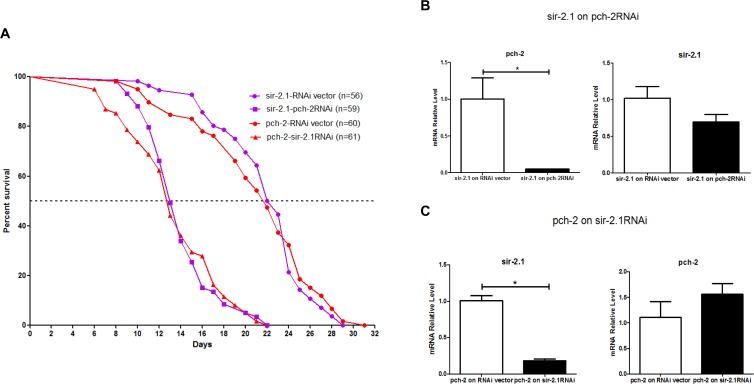
Figure 6. RNAi inhibition of both pch-2 in sir-2.1 over-expressing worms, and sir-2.1 in pch-2 over-expressing worms, shortens lifespan (A) Purple curves show lifespans of sir-2.1 over-expressing worms, while red curves show lifespans of pch-2 over-expressing worms. In sir-2 over-expressing worms, pch-2 RNAi significantly decreased lifespan (56% and 75% decrease in median and maximum lifespan, respectively). In pch-2 over-expressing worms, sir-2.1 RNAi induced a 57% and 70% decrease in median and maximum lifespans (p <0.0001 for both effects). (B) qRT-PCR validated the RNAi effect, indicating a significant reduction (~90%) of pch-2 transcipts in sir-2 over-expressing worms that were treated with pch-2 RNAi. (C) qRT-PCR validating a significant reduction (~70%) of sir-2 transcripts in pch-2 over-expressing worms that were treated with sir-2 RNAi. *p <0.001.
Discussion
Classic genetic and functional genomics screens have identified a number of genes that are involved in C. elegans lifespan regulation. Dozens of single-gene mutations have been demonstrated to lead to worm lifespan extension of 20% or more. Many of these genes are components or downstream targets of the Insulin/IGF-1 and TOR signaling pathways [12, 16]. Intriguingly, reducing the expression of most of these genes by RNAi, for example, increases worm lifespan [17]. There are a small proportion of the Insulin/IGF-1 pathway downstream key mediators, such as, DAF-16, SKN-1 and DAF-16-regulated genes including HSF-1 and RPN-6, that extend worm lifespan in over-expressors [18-21]. Pch-2, however, is not known to be involved with either the Insulin/IGF-1 or the TOR pathways. In current studies, over-expression of TRIP13, the human homolog of pch-2, in human fibroblasts exhibits enhanced resistance to environmental detrimental stressors including oxidative stress, apoptosis and UV radiation. The cells with over-expression Trip13 have a slower proliferating rate than controls, meaning that increased proliferation in Trip13 over-expressors cannot account for observed increases in cell number after stress. Furthermore, over-expression of pch-2 in C. elegans led to increased lifespan, thereby suggesting that pch-2 is protective against worm aging. Conversely, decreasing pch-2 expression with RNAi led to a decrease in lifespan. The mechanism by which pch-2 enhances lifespan may be independent of the widely-studied Insulin/IGF-1 and TOR pathways, but may possibly be related to mechanisms by which the sirtuins increase lifespan, given that inhibition of both pch-2 and sir-2 decreased lifespan by similar amounts, and given the spatial co-localization of these gene products in nucleoli. Since the expression of Trip13 declines with mammalian tissue aging (Fig. 1), these data taken together suggest that pch-2 (mammalian Trip13) may play an important role in the aging process.
Studies suggest that the anti-aging effects of sir-2 and the sirtuins are at least partly through maintenance of genome stability, by sensing and repairing damaged DNA. Sirtuins may also be playing a role as chromatin regulators in silencing unfavorable gene transcription [20], and in regulating the metabolic response to environmental stimuli [22]. Both pch-2 and sir-2 have been closely associated for checkpoint functions2 and protection of repetitive DNA (rDNA) in yeast [23]. Interestingly, our investigations on worm lifespan modulation suggest that pch-2 and sir-2 independently and reciprocally influence lifespan. We therefore propose a plausible mechanism that pch-2 is interacting with sir-2 in lifespan extension (Fig. 7). However, it is still unclear how pch-2 and sir-2 interact to influence downstream effectors, while regulating lifespan in worms and, possibly, in mammals.
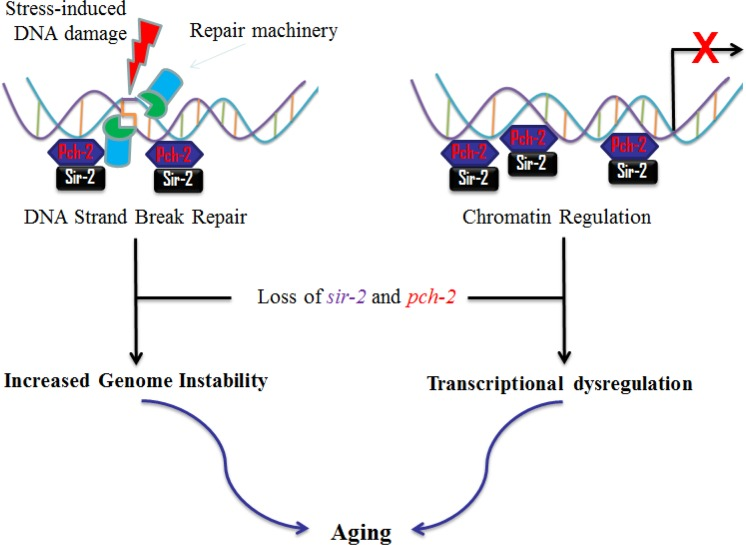
Figure 7. Proposed interactions of pch-2 and sir-2 in aging in C. elegans Based on our data and the literature, we propose that pch-2 may, similar to sir-2, affect the aging process of C. elegans. Briefly, pch-2 may play roles in surveillance of DNA damage and chromatin regulation, in concert with sir-2. Reduction of pch-2 expression induces genome instability and transcriptional dysregulation, and, therefore, may promote aging in C. elegans.
In summary, we have described a novel gene that is involved in lifespan extension in C. elegans. This gene effectively extends lifespan in over-expressing lines under a variety of stressors, and knockdown of the gene results in shortening of lifespan. The mechanism of action of pch-2 may be tied to the actions of the sirtuin family, though more studies are needed on how they impact functions of each other in terms of lifespan determination. Furthermore, the lifespan effects of this gene should also be studied in other animal systems, including in mammalian species.
Methods
Nematode strains and maintenance
The C. elegans nematode strain N2 used for all the experiments was a gift from the Reinke lab. Sir-2 over-expressing line LG394 was purchased from Caenorhabditis Genetics Center (CGC). All the C. elegans stocks, including constructed strains, were maintained at 25 °C on nema-tode growth medium agar (NGM) plates seeded with E. coli strain OP50, as described in WormBook [24].
Molecular cloning
Multiple DNA fragments were cloned by using Gateway three-fragment vector construction kit. (Invitrogen, Carlsbad, CA).
Step 1: Produce three fragments with flanking site by PCR:
Three fragments: promoter myo-3 (gift from Koelle lab), gene GFP or pch-2, and 3′-UTR were amplified by PCR using primers that incorporate flanking attB4 and attB1r sites in fragment myo-3, flanking attB1 and attB2 sites in the GFP or pch-2 genes, and flanking attB2r and attB3 sites in 3′-UTR. Templates for amplifying myo-3, GFP, and 3′-UTR are others’ plasmids (gift from Reinke lab), and the gene pch-2 was amplified from C. elegans genomic DNA (gift from Reinke lab).
Step 2: Entry clones were generated by BP reaction:
Three PCR products from step 1and three donor vectors P4-P1r, P1-P2, P2-P3 were used in three separated BP recombination reactions between an att B-flanked DNA fragment and an att P-containing donor vector to generate an entry clone. We generated three entry clones: pENTRTML4-R1-myo-3, pENTRTML1-L2-GFP and pENTRTML1-L2-pch-2, and pENTRTMR2-L3-3′-UTR.
Step 3: Expression clones were generated by LR reaction:
Expression clones were generated by LR reactions between an att L-containing entry clone and an att R-containing destination vector. Three entry clones from step 2 and the destination vector pDESTTMR4-R3 were used together in a single LR reaction to generate the expression clones pCFJ150 with 3 fragments, which were named pCFJ150-GFP and pCFJ150-pch-2.
Microinjection
A DNA mixture of 10 ng plasmid pCFJ150-GFP, and 10 ng plasmid pCFJ150-pch-2, and 50 ng carrier plasmid pUC-19 was microinjected into the syncytial gonad of wild type N2 animals24. After 48-72 hr, we scored the progeny of injected worms using a fluorescent stereomicroscope (Olympus S2x16). Each green transformed progeny was transferred to a separate NGM plate as an independent line using a worm pick. Only the lines for which the F1 progeny could pass the transgene onto their progeny with efficiencies (green positive worms as a fraction of all progeny) greater than 50% were kept and used in further experiments. GFP alone with the carrier DNA were injected to obtain the control lines for these experiments. Each transgenic line was maintained by transferring 5-10 green worms to a new NGM plate every 3-4 days.
Genotyping
Single adult worms were picked and put into 10 ul lysis buffer (50 mM KCl, 10 mM Tris pH8.3, 2.5 mM MgCl2, 0.45% NP40, 0.45% Tween 20, 0.01% gelatin) with fresh 1.0 mg/ml Proteinase K. Worms were digested at 60°C for an hour and 95°C for 15 min. Digested lysate template was amplified by PCR using oligonucleotide primer sequences forward: 5′-ctatgaccatgattacgccaagc; and reverse: 5′-gatgatgaggattcacgacaca. The PCR product was indicated by a 1670bp band on a 1% agarose gel. The pch-2 over-expressing lines were all genotyped to ensure the over-expressors were really over-expressing pch-2.
Lifespan assay
To quantify lifespan, L4 larvae from the age-synchronized population of worms were transferred to NGM plates supplied with 100ug/ml Ampicillin and 500 nM 5-fluoro-20-deoxyuridine (FUDR) seeded with sufficient OP50 bacteria. Worms were monitored by tapping their head with a platinum worm pick every 1 or 2 days until they were dead. Worms were scored as dead if they did not respond by moving the head to tapping. Worms which had fled or crawled off the agar and died on the side were censored and removed from analysis [25]. At least three individual experiments were performed in each group.
Paraquat treatment and heat shock
Age-synchronized L4 larvae were first transferred to FUDR plates. After 24 hr, for the paraquat assay young adults were moved to FUDR plates supplied with 4mM paraquat for the duration of the experiment [26]. For heat shock, the plates with young adult worms were moved to a 35°C incubator for 2 hr, and then removed back to 25°C conditions [27]. All of the worms were subsequently monitored every day for survival, and survival curves were based on daily counting.
UV radiation
Young adult worms were irradiated on NGM plates without OP50 under a germicidal bulb (254 nm) at 0.1 J/cm2 by using an UV crosslinkers. (CL-1000 Ultraviolet Crosslinkers, LLC Upland, CA, US). Then the worms were transferred to FUDR plates that were seeded with OP50. Worms were checked daily through their lives to generate survival curves [17].
RNAi induction
Gene knock down by RNAi was performed by feeding the worms with bacteria which produced dsRNA against the gene of interest. RNAi for pch-2 was a gift (Weidhaas lab). Briefly, on the first day, the RNAi clone in E. coli was incubated overnight at room temperature on RNAi agar plates with 25 μg/ml carbenicillin and 1 mM isopropylthiogalactosidase (IPTG) to induce dsRNA expression. On the second day, L4 larvae were transferred to the seeded plates to be monitored for their life spans. Bacteria containing RNAi empty vector were used as food for the control group [28]. Sir-2 over-expressing line LG394 and WT worms were studied with RNAi.
RNA isolation and Quantitative PCR
Total RNA was isolated from 10 adult worms per sample using RNeasy mini kit from QIAGEN. Nematodes were washed in M9 buffer27 three times and excess M9 was carefully removed. The samples were re-suspended in 350 μL lysis buffer with β-mercaptoethanol, mixed with an equal volume of 70% ethanol. The mixture was transferred to a spin column and followed by washing steps according the manufacturer's protocol. DNase digestion was performed in the column and RNA was eluted in 13 μL RNase-free water. Total of 12 μL RNA was used to synthesize cDNA using the Ominscript kit (QIAGEN). For real-time PCR, each 25 μL reaction containing 12.5 μL of 2x SybrGreen supermix (Bio-Rad), 0.4 μM of each primer, and 2 μL of template cDNA was performed on a C1600 Thermal Cycler (Bio-Rad). Relative gene expression level was normalized to act-1 and calculated using the ΔΔCt (cycle threshold) method.
Examination of the expression of pch-2 homologs in mouse and human tissues
Total RNA of mouse and human ovaries were isolated with the RNeasy mini kit (QIAGEN). Five young animals (3 months old) and 5 old animals (22 months old) were used for the gene expression analysis. Eight young humans (ages 18-25 yrs old) and 10 old humans (ages >60 yrs old) were included for this study. Gene expression was analyzed by Affymetrix gene array (version ST 1.0) and the differential expression of pch-2 homologs was judged by both fold change and by p value [24].
Fibroblast cell culture
Human normal adult dermal fibroblast cells were purchased from ATTC (Manassas, VA). Cell culture was maintained at 37°C, 5% CO2 in DMEM (Invitrogen, Grand Island, NY) supplemented with 10% FBS and 100u/ml Penicillin-Streptomycin.
Transfection and cell infection
Retroviruses were produced by transfection of the retroviral constructs in the Platinum-A Retroviral packing cell line (Cell Biolabs). Briefly, Plat-A cells were grown to 70% confluency in 10-cm dishes with DMEM, 10% FBS without antibiotics and transiently transfected with Lipofectamine (Invitrogen). Purified 10 ug plasmid DNA of pBABEhygro-hTRIP13 was mixed with Lipofectamine 2000 transfection reagent 30ul in Opti-MEM according to the manufacturer's protocol and were incubated overnight, then exchanged with growth medium without antibiotics. After 48 hours of infection, retroviral supernatants were collected by brief centrifugation at 1200 rpm for 5 minutes. Empty vector pBABEhygro was packaged in parallel as control.
Human dermal fibroblast cells were grown to 50% confluency and infected by retrovirus with growth medium at ratio 1:1 for 2 doses of overnight in the presence of 10 ug/ul polybrene. After 72 hours of infection, the infected cells were selected and maintained in growth medium with 90 ug/ml hygromycin to obtain a stable line. Wild type (WT) was uninfected fibroblast cells at the same passage of infected lines as one of the controls. Empty vector cell line was generated by infection with pBABE-hygro without the transgene insert. The TRIP13 cell line was generated by infection with pBABEhygro-TRIP13.
Cell culture stresses
1) H2O2 treatment
Cells were plated in 6-well plates for 24 h and replaced by growth medium with 600 uM
H2O2 and incubated for 2 h. Then cells were changed back with growth medium and incubated for 4 days. Cells were trypsinized and split at a 1:2 ratio in 6-well plates and incubated for 24 h. Cells were treated for a second time H2O2 for 2 h and then were replaced with growth medium for 24 h.
2) Etoposide treatment
Etoposide (Sigma, St. Louis, MO) was dissolved in Me2SO and added to growth medium at final concentration of 10 uM. Cells were plated in 6-well plates for 24 h and replaced by growth medium with etoposide for 3 days. Growth medium add Me2SO only was as control.
3) UVC radiation
Cells were plated in 6 well plates for 24 h and replaced medium with PBS. Cells were put in a crosslinker (UVP, Upland, CA) for UVC exposure at 50J/m2. Then cells were changed back into growth medium and incubated for 24 h.
4) Cell counting
Cells were washed with PBS and trypsinized with 0.25% trypsin for 5 minutes. Cells were diluted in growth medium and mix with equal volume of trypan blue, and 20 ul of mixture was loaded into counting chamber and counted by Cellometer Auto T4 Cell Counter. (Nexcelom Bioscience, Lawrence, MA). All cells were counted 24 hours after administration of the final stress for that condition. For all experiments, cell stress was performed on triplicate cultures (n=3).
Supplementary Materials
Author Contributions
X.X. and L.E.N. conceived the project. X.X. and H.Q. designed and performed experiments and data analysis. X.X., H.Q. and L.E.N. interpreted the results and wrote the manuscript.
Acknowledgments
We are grateful to Michelle Kudron and Guiling Wang in Reinke lab, and to Kevin Collins and Judy Pepper in Koelle lab, and to Sunitha Nallur in Weidhaas lab at Yale for providing reagents, technical support and thoughtful technical discussions. We particularly thank Mark Wilson for his thoughtful suggestion, discussion and reviewing on the manuscript. This work was supported by Yale University.
Conflicts of Interest
L.E.N. has a financial interest in Humacyte, Inc, a regenerative medicine company. Humacyte did not fund these studies, and Humacyte did not affect the design, interpretation, or reporting of any of the experiments herein.
References
- 1. Roeder GS and Bailis JM. The pachytene checkpoint. Trends Genet. 2000; 16: 395 -403. [PubMed] .
- 2. San-Segundo PA and Roeder GS. Pch2 links chromatin silencing to meiotic checkpoint control. Cell. 1999; 97: 313 -324. [PubMed] .
- 3. Baur JA, Ungvari Z, Minor RK, Le Couteur DG, de Cabo R. Are sirtuins viable targets for improving healthspan and lifespan? Nat Rev Drug Discov. 2012; 11: 443 -461. [PubMed] .
- 4. Burnett C, Valentini S, Cabreiro F, Goss M, Somogyvári M, Piper MD, Hoddinott M, Sutphin GL, Leko V, McElwee JJ, Vazquez-Manrique RP, Orfila AM, Ackerman D, et al. Absence of effects of Sir2 overexpression on lifespan in C. elegans and Drosophila. Nature. 2011; 477: 482 -485. [PubMed] .
- 5. Viswanathan M and Guarente L. Regulation of Caenorhabditis elegans lifespan by sir-2.1 transgenes. Nature. 2011; 477: E1 -2.4. [PubMed] .
- 6. Lombard DB, Pletcher SD, Cantó C, Auwerx J. Ageing: longevity hits a roadblock. Nature. 2011; 477: 410 -411. [PubMed] .
- 7. Satoh A, Brace CS, Rensing N, Cliften P, Wozniak DF, Herzog ED, Yamada KA, Imai S. Sirt1 Extends Life Span and Delays Aging in Mice through the Regulation of Nk2 Homeobox 1 in the DMH and LH. Cell Metab. 2013; 18: 416 -430. [PubMed] .
- 8. Kanfi Y1, Naiman S, Amir G, Peshti V, Zinman G, Nahum L, Bar-Joseph Z, Cohen HY. The sirtuin SIRT6 regulates lifespan in male mice. Nature. 2012; 483: 218 -221. [PubMed] .
- 9. Dereeper A1, Guignon V, Blanc G, Audic S, Buffet S, Chevenet F, Dufayard JF, Guindon S, Lefort V, Lescot M, Claverie JM, Gascuel O. Phylogeny.fr: robust phylogenetic analysis for the non-specialist. Nucleic Acids Res. 2008; 36: W465 -469. [PubMed] .
- 10. Bhalla N and Dernburg AF. A conserved checkpoint monitors meiotic chromosome synapsis in Caenorhabditis elegans. Science. 2005; 310: 683 -686. [PubMed] .
- 11. Roig I, Dowdle JA, Toth A, de Rooij DG, Jasin M, Keeney S. Mouse TRIP13/PCH2 is required for recombination and normal higher-order chromosome structure during meiosis. PLoS Genet. 2010; 6: doi: 10.1371/journal.pgen.1001062 .
- 12. Kenyon C. The genetics of ageing. Nature. 2010; 464: 504 -512. [PubMed] .
- 13. Fontana L, Partridge L, Longo VD. Extending healthy life span--from yeast to humans. Science. 2010; 328: 321 -326. [PubMed] .
- 14. Sutphin GL and Kaeberlein M. Measuring Caenorhabditis elegans life span on solid media. J Vis Exp. 2009; 27: doi: 10.3791/1152 .
- 15. Guarente L and Kenyon C. Genetic pathways that regulate ageing in model organisms. Nature. 2000; 408: 255 -262. [PubMed] .
- 16. Yanos ME, Bennett CF, Kaeberlein M. Genome-Wide RNAi Longevity Screens in Caenorhabditis elegans. Curr Genomics. 2012; 13: 508 -518. [PubMed] .
- 17. Finch CE and Ruvkun G. The genetics of aging. Annu Rev Genomics Hum Genet. 2001; 2: 435 -462. [PubMed] .
- 18. Lin K, Dorman JB, Rodan A, Kenyon C. daf-16: An HNF-3/forkhead family member that can function to double the life-span of Caenorhabditis elegans. Science. 1997; 278: 1319 -22. [PubMed] .
- 19. Tullet JM, Hertweck M, An JH, Baker J, Hwang JY, Liu S, Oliveira RP, Baumeister R, Blackwell TK. Direct inhibition of the longevity-promoting factor SKN-1 by insulin-like signaling in C. elegans. Cell. 2008; 132: 1025 -1038. [PubMed] .
- 20. Hsu AL, Murphy CT, Kenyon C. Regulation of aging and age-related disease by DAF-16 and heat-shock factor. Science. 2003; 300: 1142 -1145. [PubMed] .
- 21. Vilchez D, Morantte I, Liu Z, Douglas PM, Merkwirth C, Rodrigues AP, Manning G, Dillin A. RPN-6 determines C. elegans longevity under proteotoxic stress conditions. Nature. 2012; 489: 263 -268. [PubMed] .
- 22. Sack MN and Finkel T. Mitochondrial metabolism, sirtuins, and aging. Cold Spring Harb Perspect Biol. 2012; 4: doi: 10.1101/cshperspect.a013102 .
- 23. San-Segundo PA and Roeder GS. Role for the silencing protein Dot1 in meiotic checkpoint control. Mol Biol Cell. 2000; 11: 3601 -3615. [PubMed] .
- 24. Stiernagle T. Maintenance of C.elegans. WormBook. 2006; 11: 1 -11. [PubMed] .
- 25. Berkowitz LA, Knight AL, Caldwell GA, Caldwell KA. Generation of stable transgenic C. elegans using microinjection. J Vis Exp. 2008; 18: pii: 833 .
- 26. Van Raamsdonk JM and Hekimi S. Superoxide dismutase is dispensable for normal animal lifespan. Proc Natl Acad Sci U S A. 2012; 15: 5785 -5790. [PubMed] .
- 27. Guha S, Cao M, Kane RM, Savino AM, Zou S, Dong Y. The longevity effect of cranberry extract in Caenorhabditis elegans is modulated by daf-16 and osr-1. Age. 2013; 5: 1559 -1574. [PubMed] .
- 28. Fraser AG, Kamath RS, Zipperlen P, Martinez-Campos M, Sohrmann M, Ahringer J. Functional genomic analysis of C. elegans chromosome I by systematic RNA interference. Nature. 2000; 408: 325 -330. [PubMed] .