


Introduction
Hepatocellular carcinoma (HCC) is a major health threat and a primary cause of cancer-associated human mortalities [1–3]. HCC’s incidence and the mortality rate are rising [4–6]. Tumor immunity has become one research focus for HCC [7–9]. Dendritic cells (DCs) are antigen-presenting cells (APC) in tumor immunity, initiate key immune responses [10, 11]. The proper activation of DCs is important for efficient anti-tumor immunity [10, 11]. Conversely, depletion or inhibition of DCs could lead to pro-cancer tumor environments [10, 11]. DIgR2, or dendritic cell-derived immunoglobulin receptor 2, is a member of IgSF inhibitory receptor, inhibiting DC-induced antigen-specific T-cell responses [12]. DCs-derived DIgR2 directly binds to T cells, suppressing T-cell-mediated tumor immunity [12].
Hepatic stellate cells (HSC) are the primary source of extracellular matrix in the fibrogenesis process [13–15]. Recent literatures have implied that tumor-specific hepatic stellate cells (tHSCs) promote HCC tumorigenesis and progression [13–15]. tHSCs, characterized by α-smooth muscle actin expression, can differentiate into myofibroblasts [13–15]. The tumor-promoting tHSCs express intercellular adhesion molecule 1 (ICAM-1) and vascular cell adhesion molecule 1 (VCAM-1), among others, to facilitate migration, invasion and proliferation of tumor cells [13–15]. Our recent studies have discovered that tHSCs induces DIgR2 expression in bone marrow-derived dendritic cells (mDCs) to inhibit T cell functions [16, 17]. The underlying signaling mechanisms are not fully understood.
Under basal conditions, nuclear-factor-E2-related factor 2 (Nrf2) binds to its suppressor protein, Kelch-like ECH-associated protein 1 (Keap1) [18–21]. The latter is a Cullin 3 (Cul3) E3 ubiquitin ligase [18–21], dictating Nrf2 ubiquitination and proteasomal degradation [18–21]. Agents or stimuli modifying cysteine residues of Keap1 will lead to Keap1-Nrf2 disassociation, Nrf2 protein accumulation and nuclear translocation. It will eventually lead to transcription and expression of ARE (anti-oxidant response element)-dependent antioxidant genes [18–21]. The results of this study will show that Nrf2 activation mediates tHSCs-induced DIgR2 expression in mDCs.
Results
tHSCs co-culture induces Nrf2 signaling activation in mDCs
Our previous studies have shown that tHSCs co-culture induces DIgR2 expression in bone marrow-derived DCs (mDCs) [16, 17]. The current study aims to test the potential involvement of Nrf2 signaling in the process. First, we tested whether tHSCs co-culture activated Nrf2 signaling activation in mDCs. As described [16, 17], mDCs were co-cultured with primary tHSCs (mDCs to tHSCs ratio, 20: 1). A co-immunoprecipitation (“Co-IP”) assay was performed to test the association between Nrf2 and its suppressor protein Keap1 [22, 23]. As shown, Nrf2 immunoprecipitated with Keap1 in the untreated control mDCs (Figure 1A). Following co-culture with tHSCs, Nrf2 was disassociated with Keap1 (Figure 1A). Furthermore, Nrf2 protein was accumulated in the cytoplasm of mDCs (Figure 1B). Additionally, analyzing nuclear lysate proteins in mDCs confirmed that stabilized Nrf2 translocated to cell nuclei following tHSCs stimulation (Figure 1C). These results show that tHSCs co-culture induced Nrf2-Keap1 disassociation, Nrf2 protein accumulation and nuclear translocation in mDCs (Figure 1A–1C).
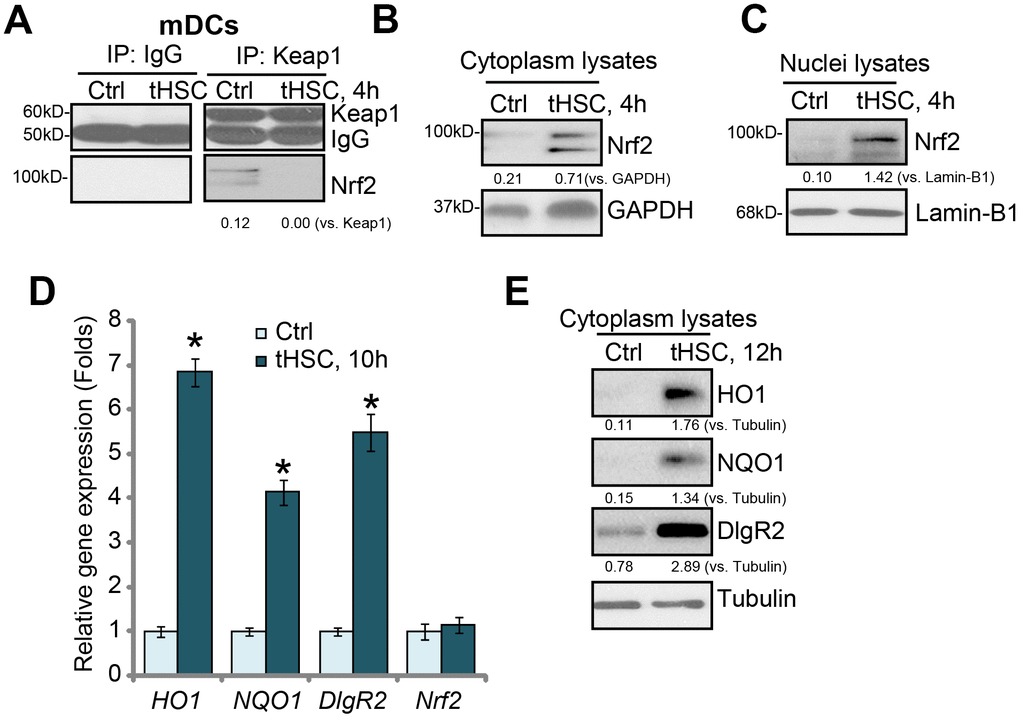
Figure 1. tHSCs co-culture induces Nrf2 signaling activation in mDCs. The bone marrow-derived dendritic cells (mDCs) were co-cultured with/without tumor HSCs (tHSCs; mDCs to tHSCs ratio, 20: 1) for applied time, Nrf2-Keap1 association was tested by the co-immunoprecipitation (“Co-IP”) (A); Expression of listed proteins in cytoplasm lysates (B and E) and nuclei lysates (C) were tested by Western blotting; Expression of listed mRNAs was tested by qPCR (D). Listed proteins were quantified and normalized to the loading control (A–C, E). Lamin-B1 is a nuclear marker protein (C). “Tubulin” stands for the loading control β-Tubulin (Same for all Figures). Data are presented as the mean ± standard deviation (n=5). “Ctrl” stands for mDCs only (no tHSCs stimulation). * P < 0.05 vs. “Ctrl” group. The experiments in this figure were repeated four times, and similar results were obtained.
Following nuclear translocation, Nrf2 will bind to ARE to promote transcription and expression of multiple anti-oxidant and detoxifying enzymes, including heme oxygenase-1 (HO-1) and NAD(P)H:quinone oxidoreductase 1 (NQO1) [22, 23]. We show that HO1 and NQO1 mRNA (Figure 1D) and protein (Figure 1E) levels were significantly increased in tHSCs-stimulated mDCs. In line with our previous studies [16, 17], DlgR2 mRNA and protein levels were increased as well in mDCs with tHSCs stimulation (Figure 1D and 1E). The Nrf2 mRNA levels were however unchanged (Figure 1D), indicating that Nrf2 protein upregulation was due to post-transcriptional regulation (Nrf2-Keap1 disassociation). These results suggest that tHSCs co-culture induced Nrf2 signaling activation in mDCs.
Nrf2 activation is required for tHSCs-induced DIgR2 expression in mDCs
Next, we tested the functional activity of Nrf2 activation in tHSCs-induced DIgR2 expression in mDCs. To block Nrf2 activation, genetic strategies [24, 25] were utilized. First, the Nrf2 shRNA lentiviral particles were added to mDCs, with puromycin selection the stable cells were established. Additionally, the CRISPR/Cas9 gene editing method was employed to complete knockout (KO) Nrf2 in mDCs (see Methods). Testing Nrf2 mRNA and protein expression confirmed that Nrf2 was depleted in stable mDCs with Nrf2 shRNA or Nrf2 KO construct, even after tHSCs stimulation (Figure 2A and 2B). tHSCs-induced HO1 and NQO1 expression, the Nrf2 target genes [26, 27], was blocked by Nrf2 shRNA or KO (Figure 2A and 2B). Importantly, Nrf2 shRNA or KO reversed tHSCs-induced DIgR2 mRNA and protein expression in mDCs (Figure 2A and 2B). These results indicate that Nrf2 activation is required for tHSCs-induced DIgR2 expression in mDCs.
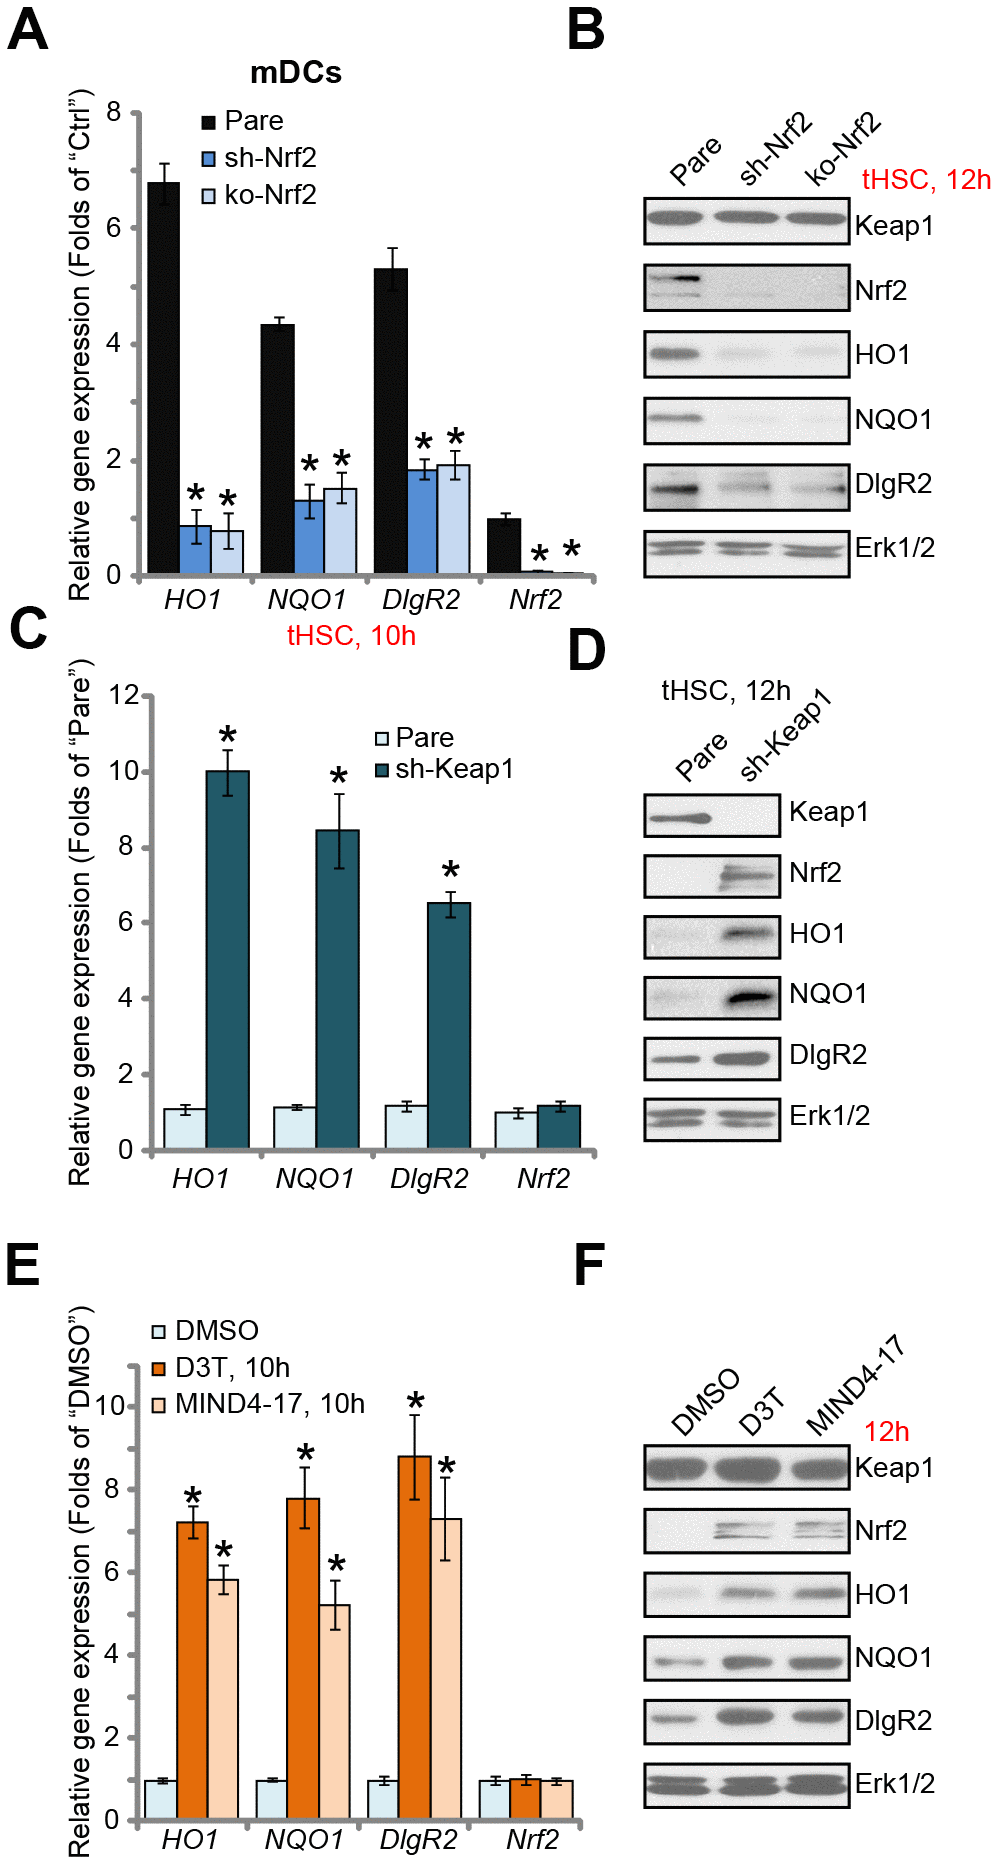
Figure 2. Nrf2 activation is required for tHSCs-induced DIgR2 expression in mDCs. The stable bone marrow-derived dendritic cells (mDCs), with Nrf2 shRNA (“sh-Nrf2”) or Nrf2 KO construct (“ko-Nrf2”), as well as the parental control mDCs (“Pare”), were co-cultured with tumor HSCs (tHSCs; mDCs to tHSCs ratio, 20: 1) for applied time, expression of listed genes was shown (A and B). Expression of listed genes in stable mDCs with Keap1 shRNA (“sh-Keap1”) or the parental control mDCs (“Pare”) was shown (C and D). Control mDCs were treated with 3H-1,2-dithiole-3-thione (D3T, 25 μM), MIND4-17 (10 μM) or vehicle control (0.25% DMSO) for applied time, listed genes were shown (E and F). Data are presented as the mean ± standard deviation (n=5). “Ctrl” stands for mDCs only. * P < 0.05 vs. “Pare” cells (A and C). * P < 0.05 vs. “DMSO”-treated cells (E). The experiments in this figure were repeated three times, and similar results were obtained.
We further hypothesized that forced activation of Nrf2 will induce DIgR2 expression in mDCs. Therefore, the Keap1 shRNA lentiviral particles were added to mDCs. Following puromycin selection, the stable cells were established. In Keap1 shRNA-expressing mDCs, expression of HO1, NQO1, and more importantly DIgR2, was significantly increased (Figure 2C and 2D). Accumulation of Nrf2 protein, but not Nrf2 mRNA, was detected (Figure 2C and 2D). Thus Keap1 silencing induced Nrf2 activation and DIgR2 expression in mDCs. To further support our results, we show that two established Nrf2 activators, 3H-1, 2-dithiole-3-thione (D3T) [28, 29] and MIND4-17 [30, 31], induced Nrf2 protein stabilization as well as HO1, NQO1 and DIgR2 expression in mDCs (Figure 2E and 2F). Collectively, these results show that Nrf2 activation is required for tHSCs-induced DIgR2 expression in mDCs.
tHSCs-induced Nrf2 activation and DIgR2 expression in mDCs is associated with reactive oxygen species (ROS) production
ROS production and oxidative stress will induce Keap1 acetylation and Keap1-Nrf2 disassociation, causing Nrf2 stabilization and activation [22, 32]. Thus, we tested whether tHSCs co-culture could induce ROS production in mDCs. Using the H2DCFDA fluorescent dye assay, our results found that ROS levels were significantly increased in tHSCs-stimulated mDCs (Figure 3A), where the H2DCFDA fluorescent intensity increased over five folds of control level (Figure 3A). Moreover, mitochondrial depolarization, evidenced by JC-1 green fluorescent intensity increase, was detected in mDCs with tHSCs co-culture (Figure 3B). Two well-known ROS scavengers, N-acetylcysteine (NAC) and Mn (III) tetrakis (4-benzoic acid) porphyrin (MnTBAP) [33, 34], blocked tHSCs-induced ROS production and mitochondrial depolarization (Figure 3A and 3B). Significantly, tHSCs-induced expression of HO1 (Figure 3C), NQO1 (Figure 3D), and DIgR2 (Figure 3E), was largely inhibited by NAC and MnTBAP in mDCs. These results indicate that ROS production is essential for tHSCs-induced Nrf2 activation and DIgR2 expression in mDCs.
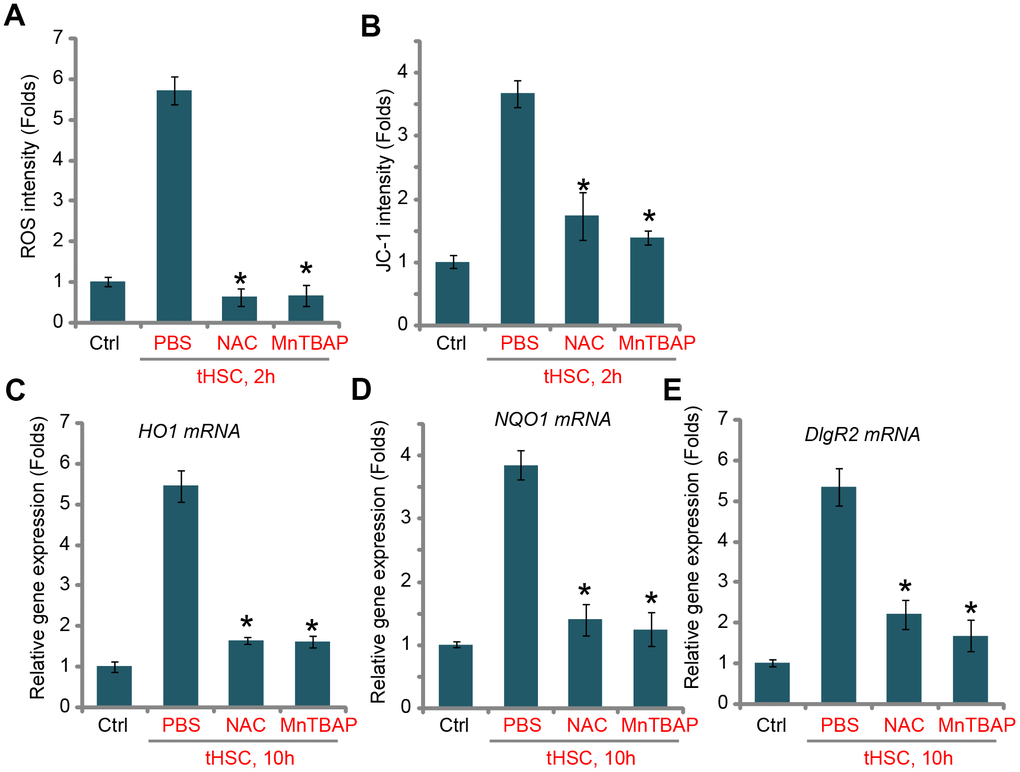
Figure 3. tHSCs-induced Nrf2 activation and DIgR2 expression in mDCs is associated with reactive oxygen species (ROS) production. The bone marrow-derived dendritic cells (mDCs) were pretreated for 1h with N-acetylcysteine (NAC, 500 μM) or MnTBAP (40 μM), followed by co-culture with tumor HSCs (tHSCs; mDCs to tHSCs ratio, 20: 1) for applied time, the ROS contents and mitochondrial depolarization were tested by H2DCFDA dye (A) and JC-1 dye (B) assays, respectively; Relative expression of listed genes were tested by qPCR assay (C–E). “Ctrl” stands for mDCs only. “PBS” stands for vehicle control PBS. Data are presented as the mean ± standard deviation (n=5). * P < 0.05 vs. “PBS” group. The experiments in this figure were repeated four times, and similar results were obtained.
tHSCs-induced Nrf2 activation in mDCs contributes to inhibition on cytokines
Our previous studies have shown that tHSCs co-culture significantly inhibited production of multiple cytokines in mDCs. Such actions were abolished with DIgR2 depletion. Since Nrf2 activation is required for DIgR2 expression, we proposed that Nrf2 depletion should abolish tHSCs-induced inhibition on cytokines in mDCs. In line with our previous findings, in mDCs expression of CD80 (one key surface co-stimulatory molecule, Figure 4A), CD86 (another surface co-stimulatory molecule, Figure 4B) and IL-12 (DC activation marker cytokine, Figure 4C) was decreased following tHSCs co-culture. Significantly, Nrf2 shRNA or KO alleviated tHSCs-mediated inhibition of the cytokines in mDCs (Figure 4A–4C). ELISA results further show that productions of CD80 (Figure 4D), CD86 (Figure 4E) and IL-12 (Figure 4F) were reduced in tHSCs-stimulated mDCs. Such actions were inhibited with Nrf2 silencing or KO (Figure 4D–4F). These results imply that tHSCs-induced Nrf2 activation in mDCs contributes to inhibition on cytokines.
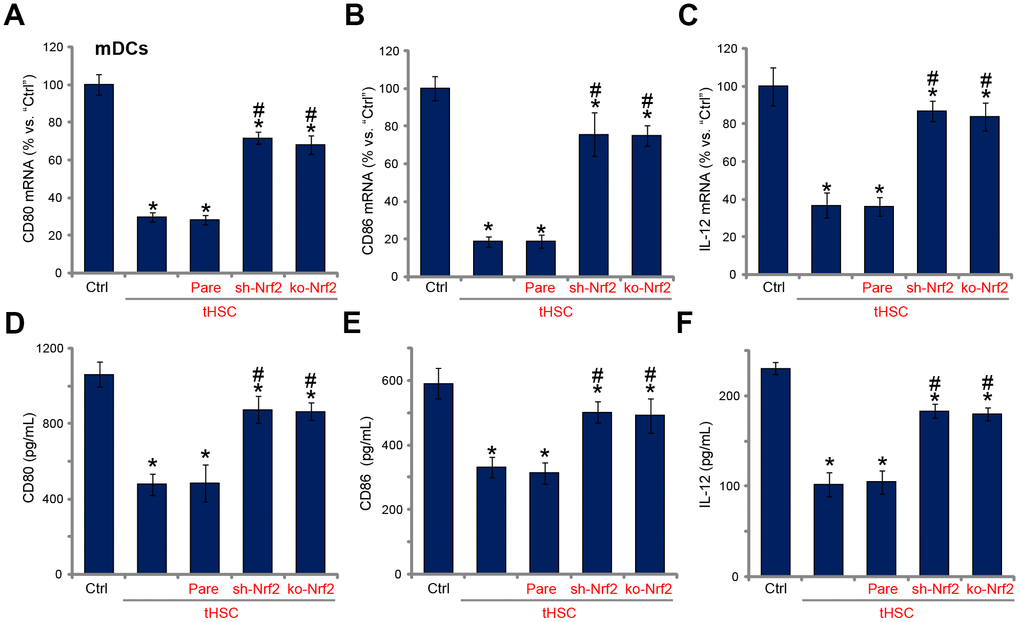
Figure 4. tHSCs-induced Nrf2 activation in mDCs contributes to inhibition on cytokines. The stable bone marrow-derived dendritic cells (mDCs), with Nrf2 shRNA (“sh-Nrf2”) or Nrf2 KO construct (“ko-Nrf2”), as well as the parental control mDCs (“Pare”), were co-cultured with tumor HSCs (tHSCs) for 72h, mRNA expression (qPCR assay, A–C) and protein contents (in conditional medium, ELISA, D–F) of listed cytokines were tested. Data are presented as the mean ± standard deviation (n=5). “Ctrl” stands for mDCs only. * P < 0.05 vs. “Ctrl”. # P < 0.05 vs. “Pare” group. The experiments in this figure were repeated four times, and similar results were obtained.
Nrf2 activation mediates splenic T cell inhibition by tHSCs-stimulated mDCs
Studies from our group [16, 17] and others have demonstrated that DC-derived DIgR2 binds to its receptor in T cells, suppressing T cell functions. Using the described protocol [16, 17], the splenic T cells were co-cultured with mDCs (T cells to mDCs ratio, 20:1). Ovalbumin II (OVA-II) peptide cytotoxic T lymphocyte (CTL) assay results demonstrated that tHSCs-stimulated mDCs can significantly inhibit the CTL activity of splenic T cells. Furthermore, lipopolysaccharides (LPS) -induced interferon-γ (IFN-γ) production in splenic T cells was largely inhibited after co-culture of tHSCs-stimulated mDCs (Figure 5B). Importantly, Nrf2 shRNA or KO in mDCs (see Figure 2) almost reversed splenic T cell inhibitions by tHSCs-stimulated mDCs (Figure 5A and 5B). These results suggest that Nrf2 activation is important for splenic T cell inhibitions by tHSCs-stimulated mDCs.
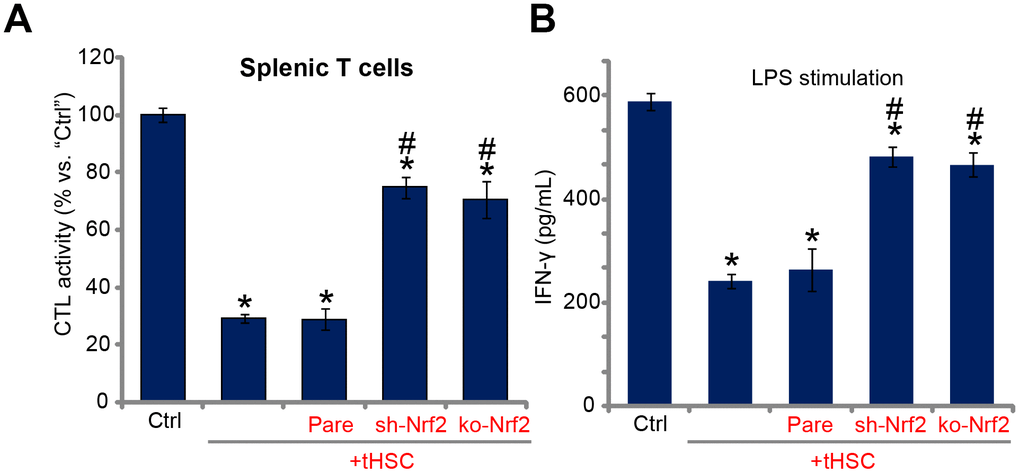
Figure 5. Nrf2 activation mediates splenic T cell inhibition by tHSCs-stimulated mDCs. The stable bone marrow-derived dendritic cells (mDCs), with Nrf2 shRNA (“sh-Nrf2”) or Nrf2 KO construct (“ko-Nrf2”) as well as the parental control mDCs (“Pare”) were co-cultured with tumor HSCs (tHSCs) for 24h; Stimulated mDCs were then co-cultured with splenic T cells; OVA-II peptide CTL assay activity (after 24h, A) and LPS (100 ng/mL)-induced IFN-γ production (after 24h, B) were tested. Data are presented as the mean ± standard deviation (n=5). “Ctrl” stands for mDCs only. * P < 0.05 vs. “Ctrl”. # P < 0.05 vs. “Pare” group. The experiments in this figure were repeated three times, and similar results were obtained.
Discussion
Immune evasion of HCC cells [7–9] is vital for cancer progression [9, 35]. tHSCs could be an important cause of T-cell hypo-responsiveness in HCC. Studies have shown that B7-H1 (a key member of the B7 family of co-stimulatory molecules) upregulation in tHSCs can lead to increased ligation of PD-1 receptor on T-cells. This will lead to T cell apoptosis and suppression of T-cell-mediated tumor cell apoptosis [36–38]. Our previous study has shown that tHSCs significantly induced DIgR2 expression in mDCs. The latter is a key negative regulator of DC-initiated T-cell response [12].
The present study shows that following tHSCs stimulationNrf2 signaling was activated in mDCs. Nrf2 cascade activation was evidenced by Nrf2-Keap1 disassociation, Nrf2 protein stabilization and accumulation, as well as Nrf2 nuclear translation and transcription of ARE-dependent genes (HO1 and NQO1). Importantly, Nrf2 activation is required for tHSCs-induced DIgR2 expression in mDCs. Nrf2 shRNA or CRISPR/Cas9-mediated Nrf2 KO blocked DIgR2 expression in tHSCs-treated mDCs. Conversely, forced activation of Nrf2, through Keap1 shRNA or Nrf2 activators (D3T and MIND4-17), induced DIgR2 expression in mDCs. Therefore, DIgR2 could be a novel Nrf2-dependent gene in mDCs.
ROS will induce Keap1 acetylation, causing Nrf2-Keap1 disassociation and Nrf2 signaling activation [22, 39]. One novel finding of the current study is that tHSCs co-culture induced significant ROS production and oxidative stress in mDCs. In tHSCs-treated mDCs ROS production and mitochondrial depolarization were detected. Importantly, ROS production should be the direct cause of Nrf2 activation and DIgR2 expression in mDCs. Two ROS scavengers, NAC and MnTBAP, not only blocked tHSCs-induced ROS production, but also inhibited Nrf2 activation and DIgR2 expression in mDCs. The underlying mechanisms of ROS-mediated Nrf2 activation in tHSCs-treated mDCs need further characterizations.
DIgR2 is an important member of IgSF inhibitory receptor [40–42]. DigR2 inhibits DC-initiated antigen-specific T-cell responses [12, 40–42]. It has two immuno-receptor tyrosine-based inhibitory motifs in the cytoplasmic region [12]. DigR2 associates with tyrosine phosphatase protein SHP1. DC-derived DIgR2 binds directly to T cells, causing T-cell inhibition and hypo-responses [12]. DIgR2 inhibition, contrarily, can boost DC-provoked T-cell responses [12]. We have previously shown that tHSCs-stimulated mDCs induced T-cell hypo-responsiveness, causing inhibited CTL activity and reduced IFN-γ production by LPS [16, 17]. In the present study, we show that Nrf2 shRNA or KO also reversed splenic T cell inhibition by tHSCs-stimulated mDCs. Therefore, Nrf2 activation is important for splenic T cell inhibition by tHSCs-stimulated mDCs, although the signaling mechanism may warrant further characterizations. In summary, our results show that Nrf2 activation mediates tHSCs-induced DIgR2 expression in mDCs.
Materials and Methods
Chemicals, reagents and antibodies
Antibodies were obtained from Abcam (Cambridge, MA). From Invitrogen-Life Technologies (Grand Island, NY) the cell culture reagents were obtained. Puromycin, lipopolysaccharide (LPS), 3H-1,2-dithiole-3-thione (D3T), N-acetylcysteine (NAC) and MnTBAP [Mn (III) tetrakis (4-benzoic acid) porphyrin Chloride] were purchased from Sigma-Aldrich (St. Louis, MO). MIND4-17 was provided by Dr. Wang [31]. All the verified primers for quantitative real-time PCR (qPCR) assay were purchased from OriGene Technologies (Rockville, MD).
Rat HCC tumor model
As previously described [43, 44], MRH HCC cells [43, 44] were initially injected to the flanks of the buffalo rats. Within four weeks the xenograft tumors were established. HCC tumors were cut into small pieces (2×1×1 mm3), transplanted to rat livers [43]. Using a ultrasound method in situ tumor growth was confirmed. The animal protocols were approved by Anhui Medical University’s IACUC and Ethics Board.
Primary culture of tHSCs
As previously described [16, 17, 43, 44], tHSCs were derived from the in situ HCC tissues from the buffalo rats. HCC tissues were first subjected to perfusion [43, 44]. Afterwards, truncated HCC tissues were further digested [43, 44]. Thereafter, single cell suspensions were established, subjecting to purification by centrifugation through a 8% Nycodenz (Axis-Shield PoC) gradient. The acquired tHSCs were cultured in FBS containing DMEM with necessary supplements [43, 44]. Via a trypan blue exclusion assay cell viability >95% was verified. A desmin immuno-staining assay was performed to verify the purity of tHSCs (>95%) [45].
Primary culture of mDCs and tHSCs-mDCs co-culture
As previously described [43, 46], the bone marrow was isolated. The red blood cells were abolished, and bone marrow cells were cultured in the described medium [43, 44] plus GM-CSF (Sigma) and IL-4 [16, 17]. The non-adherent cells were acquired from the proliferating cell clusters, harvested, washed, resuspended and cultured in medium described [46]. For the co-culture experiments, in each well 2.5×10⁵ mDCs were incubated with 1.25×10⁴ tHSCs (20: 1, mDCs to HSCs).
Primary culture of spleen T cells
As described previously [43, 44], the minced rat spleens were filtered. Splenocytes were isolated from erythrocytes via centrifugation of the cell suspension on a Ficoll gradient (Histopaque 1083, Sigma) [47]. The cells were layered onto the top of the gradient in a 10-ml Falcon tube, followed by centrifugation at 800×g for 20 min at room temperature. Lymphocytes (mainly T-cells) were collected, washed and cultured as described [43, 44].
Co-culture of spleen T cells with mDCs and in vitro T cell function detection
As reported [16], spleen T cells were co-cultured with mDCs (T cells/mDCs ratio = 20:1). An OVA (323-339) peptide assay kit was utilized to test cytotoxic T lymphocyte (CTL) activity [12]. T cells were also treated with LPS (100 ng/mL, Sigma), supernatants were collected after 24h for enzyme-linked immunosorbent assay (ELISA) detection of interferon-γ (IFN-γ).
RNA extraction and qPCR
Trizol reagents (Promega, Madison, WI) were utilized for RNA extraction. A SYBR Green PCR kit (Applied Biosystems, Foster City, CA) was utilized for reverse transcription. qPCR assays were performed using the previously described protocol [16, 17]. The product melting temperature was calculated via using a melt curve analysis. We utilized the 2−ΔΔCt method to quantify targeted gene expression, using glyceraldehyde-3-phosphatedehydrogenase (GAPDH) as the reference gene and internal control.
Western blotting
Lysates (30 μg proteins of each treatment in each lane) were separated by a 10% SDS-PAGE gel, transferred to a polyvinylidene difluoride (PVDF) blot (Millipore, Temecula, CA) [48]. After incubation in PBST with 10% non-fat milk, the blot was incubated with applied primary and secondary antibodies. To visualize the targeted band, we utilized an enhanced chemiluminescence (ECL, Roche, Shanghai, China) detection kit. An ImageJ software was applied to quantify the band intensity (total gray). The nuclear lysates were isolated by using a previously described protocol [49].
Co-immunoprecipitation (Co-IP) assay
As described [24], following co-culture with tHSC, 500 μg of total cell lysates of mDCs were first pre-cleared by using A/G Sepharose (“Beads”, Sigma-Aldrich). Thereafter, an anti-Keap1 antibody (Abcam) was included in the pre-cleared lysates overnight, followed by adding back the protein A/G Sepharose for 2h. Keap1-immunoprecipitated Nrf2 was then tested via Western blotting.
Reactive oxygen species (ROS) detection
H2DCFDA (dichlorofluorescin diacetate), a fluorogenic dye, measures hydroxyl, peroxyl and other ROS activity. In brief, following co-culture with tHSCs, mDCs were incubated with H2DCFDA (5 μM, Abcam) dye for 45 min under dark. H2DCFDA absorbance was detected by a fluorescence spectroscopy with excitation and emission at 495 nm and 529 nm, respectively.
Mitochondrial depolarization assay
Tetraethylbenzimidazolylcarbocyanine iodide (JC-1) is a cationic dye that accumulates in energized mitochondria. It forms green monomers after mitochondrial depolarization. In brief, following co-culture with tHSC, mDCs were incubated with JC-1 dye (10 μM, Abcam) dye for 30 min under dark at the room temperature. At the test wavelength of 530 nm JC-1 green fluorescence absorbance was tested.
Short hairpin RNA (shRNA)-mediated stable knockdown of Nrf2 or Keap1
The Nrf2 lentiviral particles or the Keap1 shRNA lentiviral particles were purchased from Shanghai Genechem (Shanghai, China), added to mDCs for 12h. Cells were then cultured in fresh complete medium (with 10% FBS), following by selection with puromycin (2.0 μg/mL) for another 48h. In the stable cells over 95% of knockdown of target protein (Nrf2 or Keap1) was detected.
Nrf2 knockout
The single-guide RNA (sgRNA) targeting Nrf2 was sub-cloned into a lenti-CRISPR-GFP-puro construct. The Nrf2 knockout (KO) construct was transfected to mDCs by Lipofectamine 2000. mDCs were further subjected to selection with puromycin (2.0 μg/mL) for 48h. In the stable cells Nrf2 KO was verified by Western blotting and qPCR.
Statistical analysis
All statistical analyses were performed by using SPSS 18.0 software. Values are expressed as the mean ± standard deviation (SD). P < 0.05 was considered to indicate a statistically significant result.
Conflicts of Interest
The authors declare that they have no conflicts of interests.
Funding
This work is supported by the National Science Foundation of China (No. 81472331).
References
- 1. Siegel RL, Miller KD, Jemal A. Cancer Statistics, 2017. CA Cancer J Clin. 2017; 67:7–30. https://doi.org/10.3322/caac.21387 [PubMed]
- 2. Siegel RL, Miller KD, Jemal A. Cancer statistics, 2016. CA Cancer J Clin. 2016; 66:7–30. https://doi.org/10.3322/caac.21332 [PubMed]
- 3. Siegel RL, Miller KD, Jemal A. Cancer statistics, 2015. CA Cancer J Clin. 2015; 65:5–29. https://doi.org/10.3322/caac.21254 [PubMed]
- 4. Yang JD, Roberts LR. Hepatocellular carcinoma: A global view. Nat Rev Gastroenterol Hepatol. 2010; 7:448–58. https://doi.org/10.1038/nrgastro.2010.100 [PubMed]
- 5. Llovet JM, Hernandez-Gea V. Hepatocellular carcinoma: reasons for phase III failure and novel perspectives on trial design. Clin Cancer Res. 2014; 20:2072–79. https://doi.org/10.1158/1078-0432.CCR-13-0547 [PubMed]
- 6. Farazi PA, DePinho RA. Hepatocellular carcinoma pathogenesis: from genes to environment. Nat Rev Cancer. 2006; 6:674–87. https://doi.org/10.1038/nrc1934 [PubMed]
- 7. Wu Z, Zeng Q, Cao K, Sun Y. Exosomes: small vesicles with big roles in hepatocellular carcinoma. Oncotarget. 2016; 7:60687–97. https://doi.org/10.18632/oncotarget.10807 [PubMed]
- 8. Harding JJ, El Dika I, Abou-Alfa GK. Immunotherapy in hepatocellular carcinoma: primed to make a difference? Cancer. 2016; 122:367–77. https://doi.org/10.1002/cncr.29769 [PubMed]
- 9. Prieto J, Melero I, Sangro B. Immunological landscape and immunotherapy of hepatocellular carcinoma. Nat Rev Gastroenterol Hepatol. 2015; 12:681–700. https://doi.org/10.1038/nrgastro.2015.173 [PubMed]
- 10. Swiecki M, Colonna M. The multifaceted biology of plasmacytoid dendritic cells. Nat Rev Immunol. 2015; 15:471–85. https://doi.org/10.1038/nri3865 [PubMed]
- 11. Palucka K, Banchereau J. Cancer immunotherapy via dendritic cells. Nat Rev Cancer. 2012; 12:265–77. https://doi.org/10.1038/nrc3258 [PubMed]
- 12. Shi L, Luo K, Xia D, Chen T, Chen G, Jiang Y, Li N, Cao X. DIgR2, dendritic cell-derived immunoglobulin receptor 2, is one representative of a family of IgSF inhibitory receptors and mediates negative regulation of dendritic cell-initiated antigen-specific T-cell responses. Blood. 2006; 108:2678–86. https://doi.org/10.1182/blood-2006-04-015404 [PubMed]
- 13. Huang Y, Deng X, Liang J. Modulation of hepatic stellate cells and reversibility of hepatic fibrosis. Exp Cell Res. 2017; 352:420–26. https://doi.org/10.1016/j.yexcr.2017.02.038 [PubMed]
- 14. Thompson AI, Conroy KP, Henderson NC. Hepatic stellate cells: central modulators of hepatic carcinogenesis. BMC Gastroenterol. 2015; 15:63. https://doi.org/10.1186/s12876-015-0291-5 [PubMed]
- 15. Carloni V, Luong TV, Rombouts K. Hepatic stellate cells and extracellular matrix in hepatocellular carcinoma: more complicated than ever. Liver Int. 2014; 34:834–43. https://doi.org/10.1111/liv.12465 [PubMed]
- 16. Xia YH, Lu Z, Zhao M, Dai WT, Ding L, Hu LX, Jiang GL. Tumor-specific hepatic stellate cells (tHSCs) induces DIgR2 expression in dendritic cells to inhibit T cells. Oncotarget. 2017; 8:55084–93. https://doi.org/10.18632/oncotarget.19027 [PubMed]
- 17. Lu Z, Xia YH, Zhao M, Zhang B, Dai WT, Ding L, Hu LX, Bi JL, Jiang GL. DlgR2 knockdown boosts dendritic cell activity and inhibits hepatocellular carcinoma tumor in-situ growth. Oncotarget. 2017; 8:54993–5002. https://doi.org/10.18632/oncotarget.18990 [PubMed]
- 18. Ma Q, He X. Molecular basis of electrophilic and oxidative defense: promises and perils of Nrf2. Pharmacol Rev. 2012; 64:1055–81. https://doi.org/10.1124/pr.110.004333 [PubMed]
- 19. Itoh K, Mimura J, Yamamoto M. Discovery of the negative regulator of Nrf2, Keap1: a historical overview. Antioxid Redox Signal. 2010; 13:1665–78. https://doi.org/10.1089/ars.2010.3222 [PubMed]
- 20. Nguyen T, Nioi P, Pickett CB. The Nrf2-antioxidant response element signaling pathway and its activation by oxidative stress. J Biol Chem. 2009; 284:13291–95. https://doi.org/10.1074/jbc.R900010200 [PubMed]
- 21. Li W, Kong AN. Molecular mechanisms of Nrf2-mediated antioxidant response. Mol Carcinog. 2009; 48:91–104. https://doi.org/10.1002/mc.20465 [PubMed]
- 22. Suzuki T, Yamamoto M. Molecular basis of the Keap1-Nrf2 system. Free Radic Biol Med. 2015; 88:93–100. https://doi.org/10.1016/j.freeradbiomed.2015.06.006 [PubMed]
- 23. Giudice A, Arra C, Turco MC. Review of molecular mechanisms involved in the activation of the Nrf2-ARE signaling pathway by chemopreventive agents. Methods Mol Biol. 2010; 647:37–74. https://doi.org/10.1007/978-1-60761-738-9_3 [PubMed]
- 24. Tang C, Wang X, Xie Y, Cai X, Yu N, Hu Y, Zheng Z. 4-Octyl Itaconate Activates Nrf2 Signaling to Inhibit Pro-Inflammatory Cytokine Production in Peripheral Blood Mononuclear Cells of Systemic Lupus Erythematosus Patients. Cell Physiol Biochem. 2018; 51:979–90. https://doi.org/10.1159/000495400 [PubMed]
- 25. Shi X, Liu HY, Li SP, Xu HB. Keratinocyte growth factor protects endometrial cells from oxygen glucose deprivation/re-oxygenation via activating Nrf2 signaling. Biochem Biophys Res Commun. 2018; 501:178–85. https://doi.org/10.1016/j.bbrc.2018.04.208 [PubMed]
- 26. Liu H, Feng Y, Xu M, Yang J, Wang Z, Di G. Four-octyl itaconate activates Keap1-Nrf2 signaling to protect neuronal cells from hydrogen peroxide. Cell Commun Signal. 2018; 16:81. https://doi.org/10.1186/s12964-018-0294-2 [PubMed]
- 27. Hu H, Hao L, Tang C, Zhu Y, Jiang Q, Yao J. Activation of KGFR-Akt-mTOR-Nrf2 signaling protects human retinal pigment epithelium cells from Ultra-violet. Biochem Biophys Res Commun. 2018; 495:2171–77. https://doi.org/10.1016/j.bbrc.2017.12.078 [PubMed]
- 28. Li KR, Yang SQ, Gong YQ, Yang H, Li XM, Zhao YX, Yao J, Jiang Q, Cao C. 3H-1,2-dithiole-3-thione protects retinal pigment epithelium cells against Ultra-violet radiation via activation of Akt-mTORC1-dependent Nrf2-HO-1 signaling. Sci Rep. 2016; 6:25525. https://doi.org/10.1038/srep25525 [PubMed]
- 29. Dong J, Yan D, Chen SY. Stabilization of Nrf2 protein by D3T provides protection against ethanol-induced apoptosis in PC12 cells. PLoS One. 2011; 6:e16845. https://doi.org/10.1371/journal.pone.0016845 [PubMed]
- 30. Li C, Yan K, Wang W, Bai Q, Dai C, Li X, Huang D. MIND4-17 protects retinal pigment epithelium cells and retinal ganglion cells from UV. Oncotarget. 2017; 8:89793–801. https://doi.org/10.18632/oncotarget.21131 [PubMed]
- 31. Guo S, Fei HD, Ji F, Chen FL, Xie Y, Wang SG. Activation of Nrf2 by MIND4-17 protects osteoblasts from hydrogen peroxide-induced oxidative stress. Oncotarget. 2017; 8:105662–72. https://doi.org/10.18632/oncotarget.22360 [PubMed]
- 32. Abed DA, Goldstein M, Albanyan H, Jin H, Hu L. Discovery of direct inhibitors of Keap1-Nrf2 protein-protein interaction as potential therapeutic and preventive agents. Acta Pharm Sin B. 2015; 5:285–99. https://doi.org/10.1016/j.apsb.2015.05.008 [PubMed]
- 33. Zhao Z, Feng L, Wang J, Cheng D, Liu M, Ling M, Xu W, Sun K. NPC-26 kills human colorectal cancer cells via activating AMPK signaling. Oncotarget. 2017; 8:18312–21. https://doi.org/10.18632/oncotarget.15436 [PubMed]
- 34. Guo F, Liu SQ, Gao XH, Zhang LY. AICAR induces AMPK-independent programmed necrosis in prostate cancer cells. Biochem Biophys Res Commun. 2016; 474:277–83. https://doi.org/10.1016/j.bbrc.2016.04.077 [PubMed]
- 35. Fesnak AD, June CH, Levine BL. Engineered T cells: the promise and challenges of cancer immunotherapy. Nat Rev Cancer. 2016; 16:566–81. https://doi.org/10.1038/nrc.2016.97 [PubMed]
- 36. Yu MC, Chen CH, Liang X, Wang L, Gandhi CR, Fung JJ, Lu L, Qian S. Inhibition of T-cell responses by hepatic stellate cells via B7-H1-mediated T-cell apoptosis in mice. Hepatology. 2004; 40:1312–21. https://doi.org/10.1002/hep.20488 [PubMed]
- 37. Muhanna N, Horani A, Doron S, Safadi R. Lymphocyte-hepatic stellate cell proximity suggests a direct interaction. Clin Exp Immunol. 2007; 148:338–47. https://doi.org/10.1111/j.1365-2249.2007.03353.x [PubMed]
- 38. Chen CH, Kuo LM, Chang Y, Wu W, Goldbach C, Ross MA, Stolz DB, Chen L, Fung JJ, Lu L, Qian S. In vivo immune modulatory activity of hepatic stellate cells in mice. Hepatology. 2006; 44:1171–81. https://doi.org/10.1002/hep.21379 [PubMed]
- 39. Itoh K, Tong KI, Yamamoto M. Molecular mechanism activating Nrf2-Keap1 pathway in regulation of adaptive response to electrophiles. Free Radic Biol Med. 2004; 36:1208–13. https://doi.org/10.1016/j.freeradbiomed.2004.02.075 [PubMed]
- 40. Shibuya A, Nakahashi-Oda C, Tahara-Hanaoka S. Regulation of Immune Responses by the Activating and Inhibitory Myeloid-Associate Immunoglobuline-Like Receptors (MAIR) (CD300). Immune Netw. 2009; 9:41–45. https://doi.org/10.4110/in.2009.9.2.41 [PubMed]
- 41. Can I, Tahara-Hanaoka S, Shibuya A. Expression of a splicing isoform of MAIR-V (CD300LF), an inhibitory immunoglobulin-like receptor on myeloid cells. Hybridoma (Larchmt). 2008; 27:59–61. https://doi.org/10.1089/hyb.2007.0534 [PubMed]
- 42. Can I, Tahara-Hanaoka S, Hitomi K, Nakano T, Nakahashi-Oda C, Kurita N, Honda S, Shibuya K, Shibuya A. Caspase-independent cell death by CD300LF (MAIR-V), an inhibitory immunoglobulin-like receptor on myeloid cells. J Immunol. 2008; 180:207–13. https://doi.org/10.4049/jimmunol.180.1.207 [PubMed]
- 43. Xia YH, Wang ZM, Chen RX, Ye SL, Sun RX, Xue Q, Huang Y. T-cell apoptosis induced by intratumoral activated hepatic stellate cells is associated with lung metastasis in hepatocellular carcinoma. Oncol Rep. 2013; 30:1175–84. https://doi.org/10.3892/or.2013.2571 [PubMed]
- 44. Xia Y, Chen R, Ye SL, Sun R, Chen J, Zhao Y. Inhibition of T-cell responses by intratumoral hepatic stellate cells contribute to migration and invasion of hepatocellular carcinoma. Clin Exp Metastasis. 2011; 28:661–74. https://doi.org/10.1007/s10585-011-9399-3 [PubMed]
- 45. Ikeda K, Wakahara T, Wang YQ, Kadoya H, Kawada N, Kaneda K. In vitro migratory potential of rat quiescent hepatic stellate cells and its augmentation by cell activation. Hepatology. 1999; 29:1760–67. https://doi.org/10.1002/hep.510290640 [PubMed]
- 46. Lu L, McCaslin D, Starzl TE, Thomson AW. Bone marrow-derived dendritic cell progenitors (NLDC 145+, MHC class II+, B7-1dim, B7-2-) induce alloantigen-specific hyporesponsiveness in murine T lymphocytes. Transplantation. 1995; 60:1539–45. https://doi.org/10.1097/00007890-199560120-00028 [PubMed]
- 47. Su H, Kong C, Zhu L, Huang Q, Luo L, Wang H, Xu Y. PPE26 induces TLR2-dependent activation of macrophages and drives Th1-type T-cell immunity by triggering the cross-talk of multiple pathways involved in the host response. Oncotarget. 2015; 6:38517–37. https://doi.org/10.18632/oncotarget.5956 [PubMed]
- 48. Wu X, Liu D, Gao X, Xie F, Tao D, Xiao X, Wang L, Jiang G, Zeng F. Inhibition of BRD4 Suppresses Cell Proliferation and Induces Apoptosis in Renal Cell Carcinoma. Cell Physiol Biochem. 2017; 41:1947–56. https://doi.org/10.1159/000472407 [PubMed]
- 49. Zhang H, Liu YY, Jiang Q, Li KR, Zhao YX, Cao C, Yao J. Salvianolic acid A protects RPE cells against oxidative stress through activation of Nrf2/HO-1 signaling. Free Radic Biol Med. 2014; 69:219–28. https://doi.org/10.1016/j.freeradbiomed.2014.01.025 [PubMed]