


Introduction
Glioma accounts for 46-70% of all patients with central nervous system (CNS)-related cancers [1]. The other CNS-related cancers include oligodendrogliomas, astrocytomas, glioblastomas, and ependymomas [2]. Although chemo-radiotherapy and surgical resection techniques have greatly improved in recent decades, the prognosis of glioma patients remains highly unfavorable [3, 4]. Therefore, identifying molecular mechanisms that regulate gliomagenesis is pivotal to improvements in glioma therapy.
Mutations in isocitrate dehydrogenase (IDH) profoundly affect growth and progression of gliomas as well as therapeutic outcomes [5]. Several IDH mutations are associated with increased survival of patients with glioma [6, 7].
Long noncoding RNAs (lncRNAs) are a class of RNAs that are >200 nucleotides in length and do not contain any open reading frames (ORFs) that can be translated into proteins [8, 9]. They account for more than 80% of ncRNAs and are less conserved than the microRNAs [10]. Moreover, lncRNAs regulate cellular growth, survival, and differentiation, genomic imprinting, epigenetic and post-transcriptional regulation of gene expression, alternate splicing, chromatin modifications, subcellular transport, and inflammatory mechanisms [11–14]. Dysregulation of lncRNAs is associated with the growth and metastasis of several tumors including gliomas [15–17]. The role of lncRNA FAM181A-AS1 in gliomas is not known. Therefore, in this study, we investigated the function and clinical significance of FAM181A-AS1 in gliomas.
Results
FAM181A-AS1 expression is significantly higher in human glioma tissues
We analyzed RNA-seq data in the GTEx and TCGA databases and found that lncRNA FAM181A-AS1 expression was significantly higher in human glioma samples (n=163) compared to the corresponding controls (n=207, Figure 1A). Moreover, analysis of the CGGA database showed that FAM181A-AS1 expression was significantly higher in patients with WHO stage IV glioma compared to those with WHO stage II/III glioma (Figure 1B).
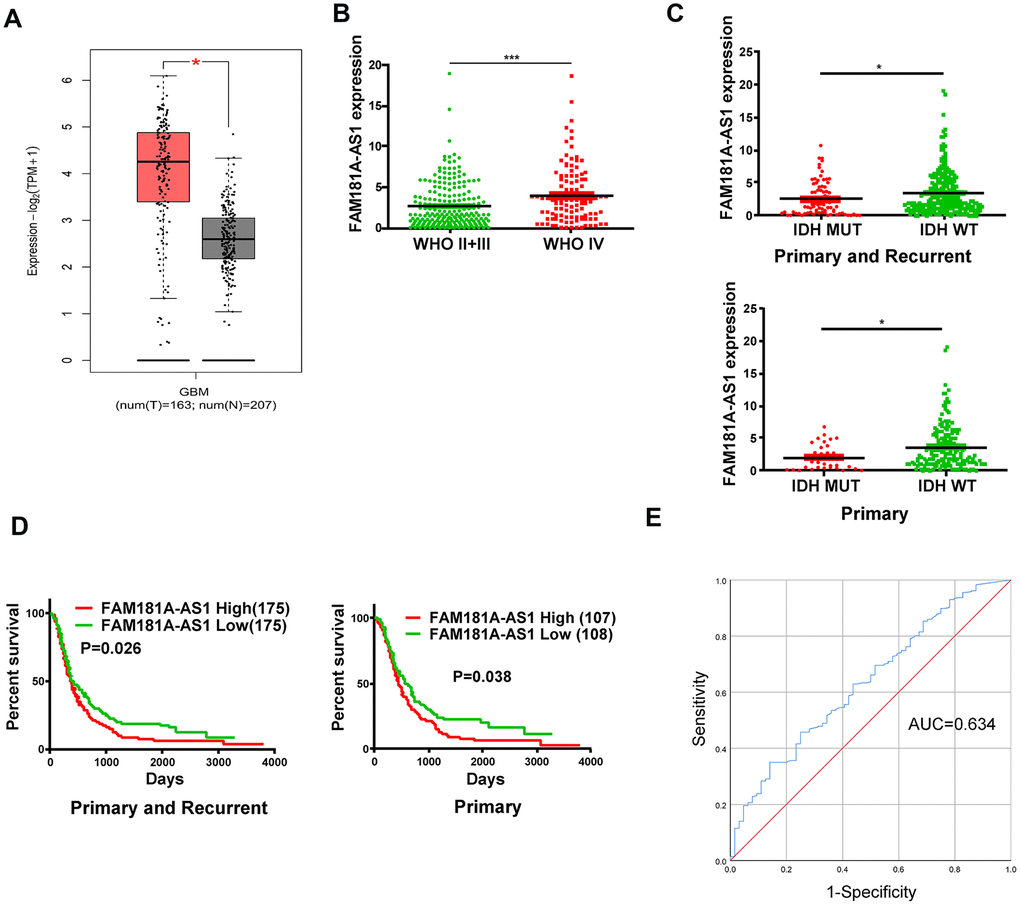
Figure 1. High lncRNA FAM181A-AS1 expression correlates with poor prognosis of glioma patients. (A) TCGA and GTEx database analyses show FAM181A-AS1 expression in glioma (n=163) and non-cancerous brain tissue samples (n=207). (B) CGGA database analysis shows FAM181A-AS1 expression in WHO stage II/III (n=105) and WHO stage IV (n=109) glioma patients. (C) CGGA database analysis shows FAM181A-AS1 expression in glioma patients with wild-type (n=175) or mutant IDH genotypes (n=33). (D) Kaplan-Meier survival curve analysis shows overall survival of glioma patients with high or low FAM181A-AS1 expression. (E) ROC curves analysis shows the sensitivity and specificity of FAM181A-AS1 expression in glioma samples. Note: *P<0.05, ***P<0.001; data are represented as means ± SD.
High FAM181A-AS1 expression correlates with unfavorable prognosis in glioma patients
Next, we analyzed the clinical significance of FAM181A-AS1 expression in glioma patients. Previous studies show that glioma patients with IDH mutations are associated with increased survival rates [18, 19]. The CGGA database analysis showed that FAM181A-AS1 expression was significantly reduced in glioma patients harboring IDH mutations compared to those without IDH mutations (Figure 1C). Furthermore, Kaplan-Meier survival curve analysis demonstrated that survival rates of glioma patients with high FAM181A-AS1 expression was significantly lower than those with low FAM181A-AS1 expression (Figure 1D). Subsequently, receiver AS1 expression in glioma patients was 0.634 (Figure 1E). These data demonstrate that FAM181A-AS1 is a potential prognostic biomarker for glioma patients.
FAM181A-AS1 downregulation inhibits cell proliferation and promotes cell apoptosis
Next, we analyzed the role of FAM181A-AS1 in the growth and proliferation of glioma cell lines. QRT-PCR analysis showed that FAM181A-AS1 expression was significantly higher in four glioma cell lines, U87, U251, LN229 and A172, compared to the normal human astrocyte (NHA) cell line (Figure 2A). Comparatively, FAM181A-AS1 expression was significantly lower in U87 and U251 cell lines compared to LN229 and A172 cell lines. Hence, we performed FAM181A-AS1 knockdown in LN229 and A172 cell lines by transfecting them with siRNA against FAM181A-AS1. FAM181A-AS1 levels were significantly reduced in si-FAM181A-AS1-transfected LN229 and A172 cells compared to si-NC-transfected LN229 and A172 cells (Figure 2B). CCK-8, EdU and showed significantly reduced proliferation and colony formation capacity (Figure 2C–2E) compared to si-NC-transfected LN229 and A172 cells. Western blot results showed that the levels of proliferation-related protein, PCNA, were significantly reduced in the si-FAM181A-AS1-transfected LN229 and A172 cells compared to the si-NC-transfected LN229 and A172 cells (Figure 2F). Furthermore, we analyzed the effects of FAM181A-AS1 knockdown on the status of cell cycle progression and apoptosis of LN229 and A172 cells by flow cytometry. The results showed that FAM181A-AS1 knockdown significantly reduced the percentage of S-phase cells, suggesting G0/G1 phase cell cycle arrest (Supplementary Figure 1A). Moreover, FAM181A-AS1 knockdown LN229 and A172 cells showed increased apoptosis compared to controls (Supplementary Figure 1B). Furthermore, western blot analysis showed that the levels of cyclin D1 (cell cycle regulating protein) and Bcl-2 (anti-apoptotic or pro-survival protein) were significantly reduced in the si-FAM181A-AS1-transfected LN229 and A172 cells compared to the si-NC-transfected LN229 and A172 cells (Supplementary Figure 1C).
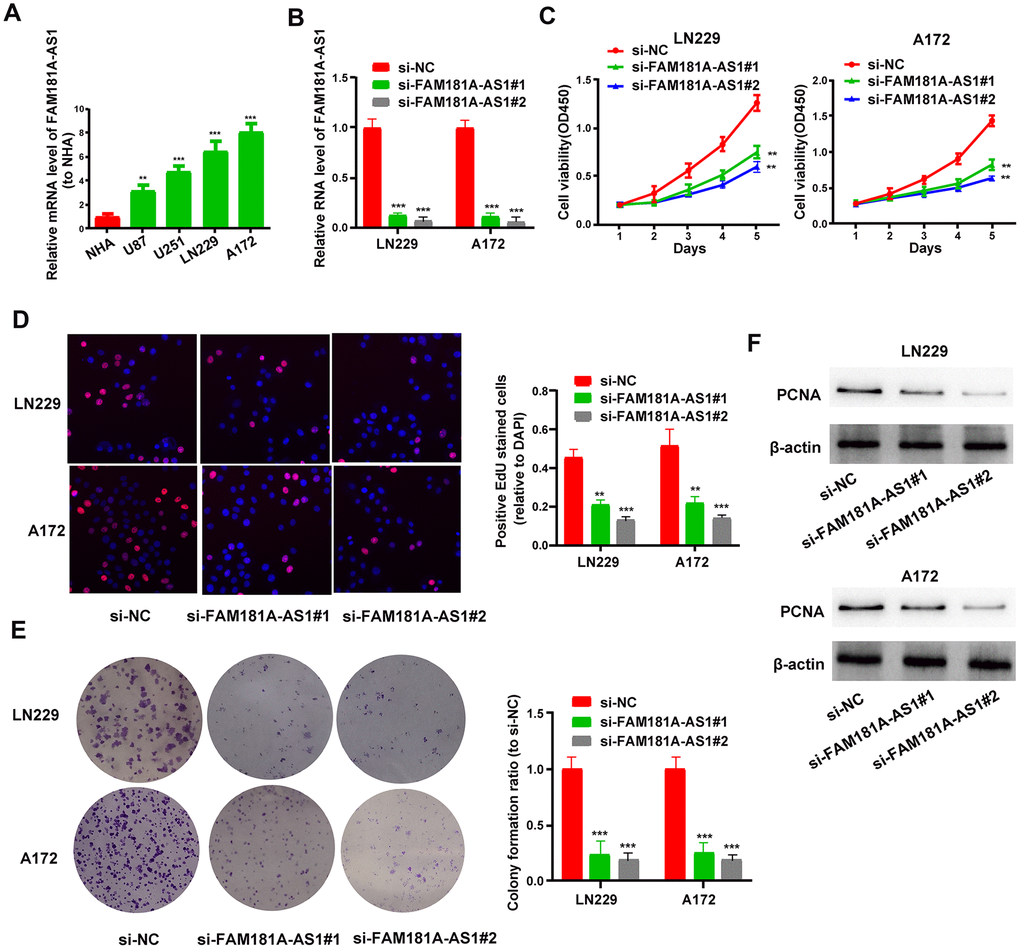
Figure 2. FAM181A-AS1 knockdown inhibits glioma cell proliferation and colony formation. (A) QRT-PCR analysis shows FAM181A-AS1 levels in the four glioma cell lines, namely, LN229, A172, U87 and U251, and the control normal human astrocyte (NHA) cell line. (B) QRT-PCR analysis shows FAM181A-AS1 levels in si-NC- and si-FAM181A-AS1-transfected LN229 and A172 cell lines. (C, D) CCK-8 and EdU assay results show proliferation of si-NC- and si-FAM181A-AS1-transfected LN229 and A172 cell lines. (E) Colony formation assay results show the numbers of colonies formed by si-NC- and si-FAM181A-AS1-transfected LN229 and A172 cells. (F) Western blot analysis shows the levels of PCNA protein in si-NC- and si-FAM181A-AS1-transfected LN229 and A172 cell lines. Note: **P<0.01, ***P<0.001; data are represented as means ± SD.
FAM181A-AS1 overexpression promotes cell proliferation and colony formation in glioma cell lines
Next, we analyzed the effects of FAM181A-AS1 overexpression on the growth and proliferation of U87 and U251 cell lines. QRT-PCR analysis showed that FAM181A-AS1 levels were significantly higher in FAM181A-AS1-overexpressing U87 and U251 cells compared to the controls (Figure 3A). Furthermore, CCK-8, EdU and colony formation assays showed significantly higher proliferation (Figure 3B, 3C) and colony formation capacity (Figure 3D) in the FAM181A-AS1-overexpressing U87 and U251 cells compared to the controls. Moreover, western blot analysis showed that PCNA protein levels were significantly higher in the FAM181A-AS1-overexpressing U87 and U251 cells compared to the controls (Figure 3E).
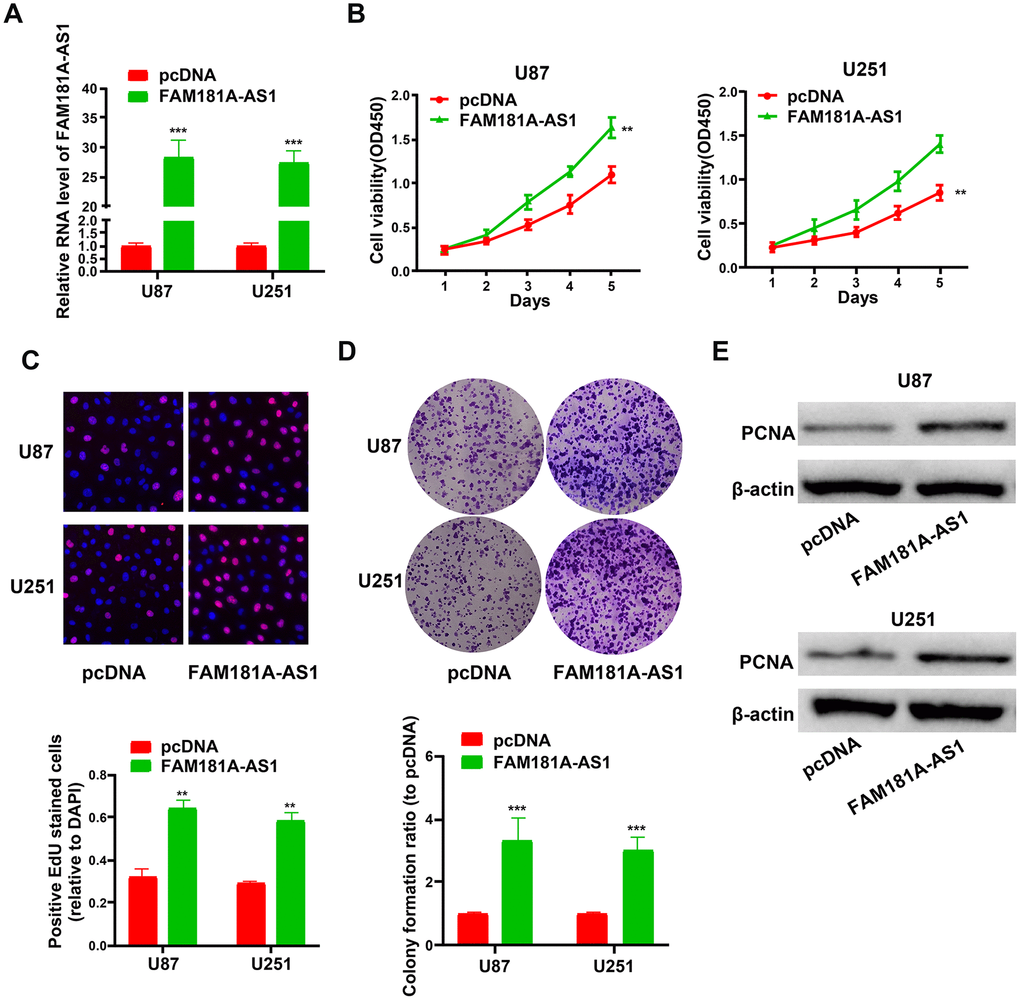
Figure 3. FAM181A-AS1 overexpression promotes cell proliferation and colony formation. (A) QRT-PCR analysis shows FAM181A-AS1 levels in pcDNA3.1- and pcDNA3.1-FAM181A-AS1-transfected U87 and U251 cell lines. (B, C) CCK-8 and EdU assay results show proliferation of control and FAM181A-AS1-overexpressing U87 and U251 cell lines. (D) Colony formation assay shows the total numbers of colonies formed by control and FAM181A-AS1-overexpressing U87 and U251 cell lines. (E) Western blot analysis shows the levels of PCNA protein in control and FAM181A-AS1-overexpressing U87 and U251 cell lines. Note: **P<0.01, ***P<0.001; data are represented as means ± SD.
Low miR-129-5p expression correlates with advanced tumor stage and unfavorable survival of glioma patients
Next, we analyzed the microRNA.org database [20] to determine FAM181A-AS1-binding microRNAs and identified miR-129-5p as a potential target. The CGGA database analysis showed that miR-129-5p expression negatively correlated with FAM181A-AS1 expression in glioma patients (Figure 4A). Moreover, miR-129-5p expression was significantly lower in the glioma cell lines compared to the NHA cell line (Figure 4B). Besides, miR-129-5p expression was significantly lower in the patients with WHO stage IV glioma compared to those with WHO stage II/III glioma (Figure 4C). ROC curve analysis showed that the area under curve (AUC) value for miR-129-5p was 0.686 (Figure 4D). Kaplan-Meier survival curve analysis showed that the survival of glioma patients with low miR-129-5p expression was significantly shorter compared to those with high miR-129-5p expression (Figure 4E).
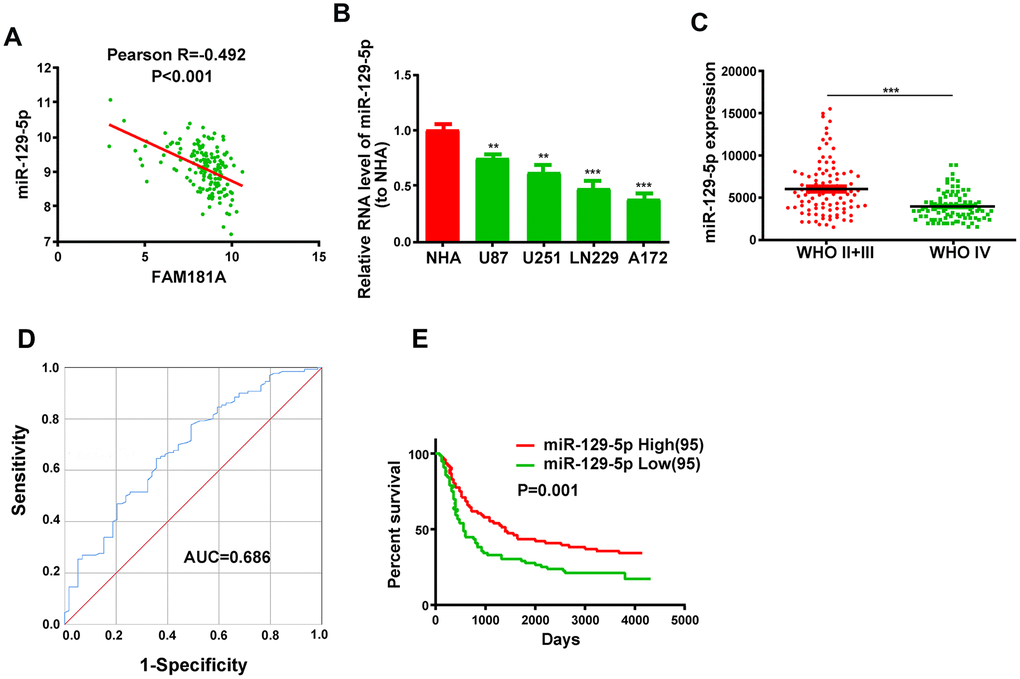
Figure 4. Low miR-129-5p expression correlates with advanced tumor stage and poor survival of glioma patients. (A) Pearson correlation analysis shows the relationship between FAM181A-AS1 and miR-129-5p expression in glioma patients from the CGGA database. (B) QRT-PCR analysis shows miR-129-5p expression in the four glioma cell lines and the control NHA cell line. (C) QRT-PCR analysis shows miR-129-5p expression in patients with WHO stage II/III or WHO stage IV glioma from the CGGA database. (D) ROC curve analysis shows the sensitivity and specificity and AUC value of miR-129-5p expression in glioma samples. (E) Kaplan-Meier survival curve analysis shows the overall survival of glioma patients with high or low miR-129-5p expression. Note: **P<0.01, ***P<0.001; data are represented as means ± SD.
FAM181A-AS1 directly binds to miR-129-5p in the glioma cells
Since lncRNAs function as competitive endogenous RNAs (ceRNAs) and function by sponging miRNAs, we explored the effects of FAM181A-AS1 overexpression or knockdown on the levels of miR-129-5p. Figure 5A shows the miR-129-5p binding sites in the wild-type and mutated FAM181A-AS1. Dual luciferase reporter assay results showed that luciferase activity of U87 and U251 cells transfected with miR-129-5p mimic plus vector containing wild-type FAM181A-AS1 was significantly lower than those transfected with miR-129-5p mimic plus mutant FAM181A-AS1 (Figure 5B). Moreover, FAM181A-AS1 overexpression in the U87 and U251 cells suppressed the luciferase activity of wild-type miR-129-5p, but did not affect the luciferase activity of mutant miR-129-5p MUT (Supplementary Figure 2A, 2B). QRT-PCR analysis showed that miR-129-5p levels were significantly higher in glioma cell lines transfected with the miR-129-5p mimic compared to the corresponding controls (Figure 5C). Furthermore, miR-129-5p expression was significantly reduced in pcDNA3.1-FAM181A-AS1-transfected glioma cell lines compared to those transfected with the control pcDNA3.1 vector alone (Figure 5D). RIP assay analysis using the anti-Ago2 antibody showed that both FAM181A-AS1 and miR-129-5p were pulled down together compared to the negative control (Figure 5E). Moreover, qRT-PCR analysis also showed that miR-129-5p was enriched in the RNA-RNA complexes pulled down by the FAM181A-AS1 biotinylated probe (Figure 5F). These data confirm that FAM181A-AS1 interacts directly with miR-129-5p.
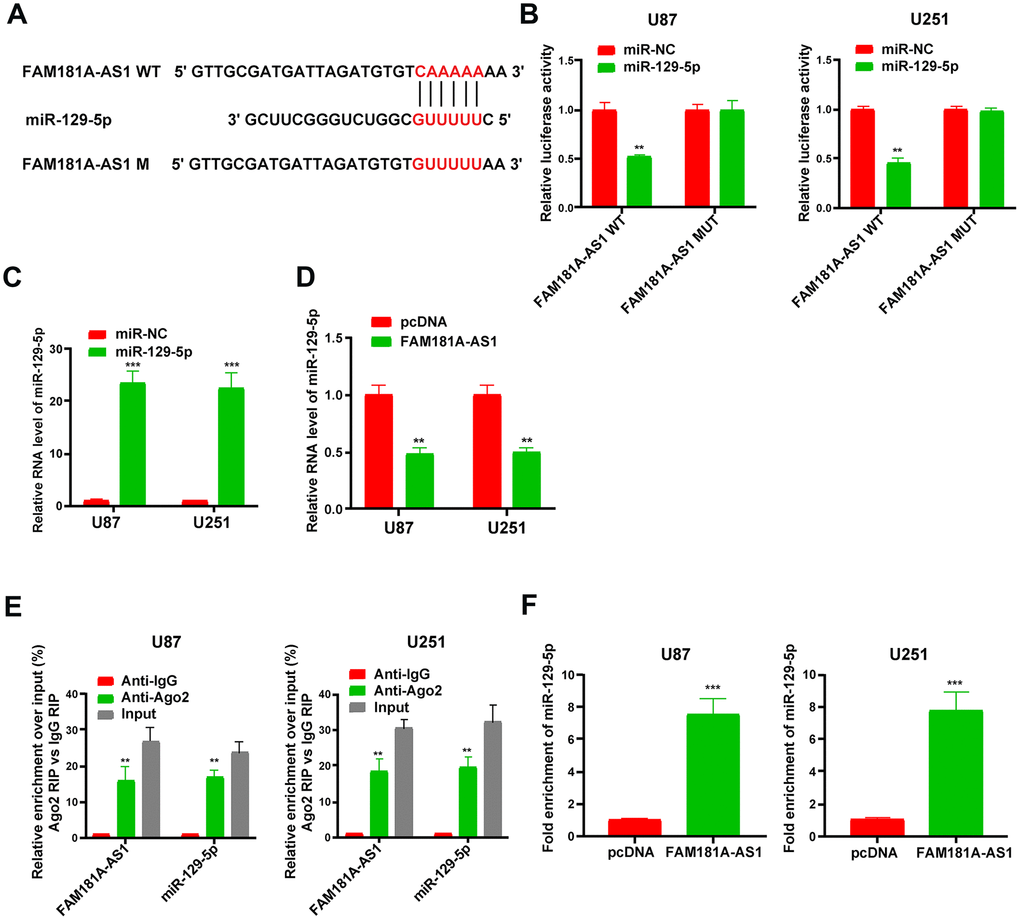
Figure 5. LncRNA FAM181A-AS1 sponges miR-129-5p in glioma cells. (A) The diagrammatic representation shows miR-129-5p-binding sites in the wild-type and mutant FAM181A-AS1sequences. (B) Dual luciferase reporter assay results show relative firefly luciferase activity in U87 and U251 cell lines transfected with miR-129-5p mimic and vectors containing FAM181A-AS1 with wild-type (WT) or mutant (MUT) miR-129-5p-binding sites. (C) QRT-PCR analysis shows miR-129-5p levels in control and miR-129-5p mimic-transfected U87 and U251 cell lines. (D) QRT-PCR analysis shows miR-129-5p levels in control and FAM181A-AS1 overexpressing U87 and U251 cell lines. (E) Ago2 RIP assay results show enrichment of FAM181A-AS1 and miR-129-5p using qRT-PCR in Ago2 protein pulldown samples from U87 and U251 cell lines using anti-Ago2 antibody. (F) QRT-PCR assay shows the levels of miR-129-5p in the RNA-RNA complexes pulled down using the FAM181A-AS1 biotinylated probe in comparison with the negative control. Note: **P<0.01, ***P<0.001; data are represented as means ± SD.
MiR-129-5p overexpression inhibits proliferation of FAM181A-AS1-overexpressing glioma cells
Next, we assessed the functional relationship between FAM181A-AS1 and miR-129-5p expression in glioma cell lines by co-transfecting U87 and U251 cells using miR-129-5p mimic and the FAM181A-AS1 overexpression vector. CCK-8, EdU, and colony formation assays showed that miR-129-5p mimic reduced FAM181A-AS1-dependent proliferation and colony formation capacity in glioma cells (Figure 6A–6C).
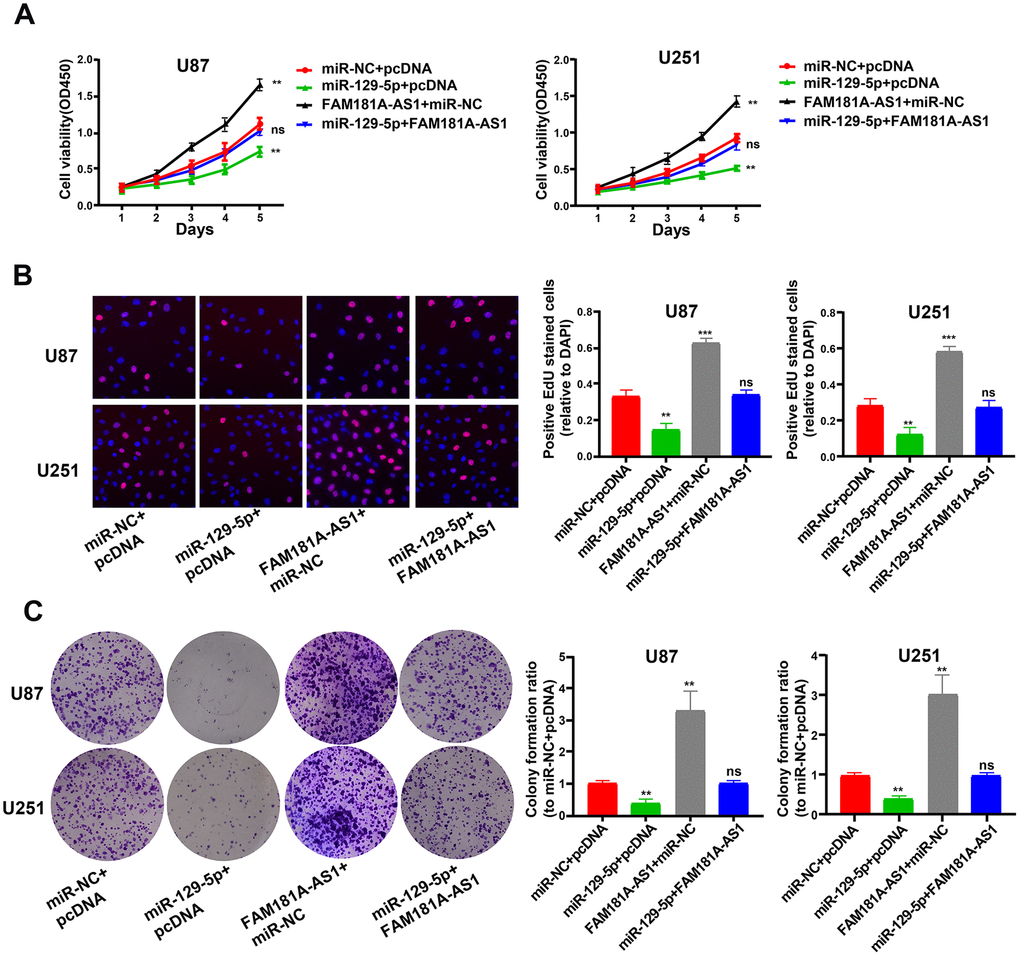
Figure 6. MiR-129-5p mimic treatment reduces cell proliferation and colony formation FAM181A-AS1-overexpressing glioma cell lines. (A, B) CCK-8 and EdU assay results show proliferation of FAM181A-AS1-overexpressing U87 and U251 cell lines transfected with miR-NC (negative control) or miR-129-5p mimic. (C) Colony formation assay results show the total numbers of colonies formed by FAM181A-AS1-overexpressing U87 and U251 cell lines transfected with miR-NC (negative control) or miR-129-5p mimic. Note: **P<0.01, ***P<0.001; ns, not statistically significant; data are represented as means ± SD.
MiR-129-5p specifically binds to the 3’UTR of ZRANB2 in glioma cells
Previous studies show that miR-129-5p impacts cellular pathways by modulating target gene expression including IGF-1R, HMGB1, PBX3 and so on [21–23]. We analyzed the RNA22, miRanda and PicTar databases and found 8 potential miR-129-5p target genes, namely, ZNF646, RBPJ, CAMTA1, FBXW7, ZRANB2, L1CAM, PDS5A, and ZFHX3 (Figure 7A). We chose ZRANB2 for further analysis because it is previously shown to be associated with glioma [24]. Figure 7B shows the miR-129-5p binding sites in the wild-type or mutant 3’UTR of ZRANB2. Dual luciferase reporter assay results showed that luciferase activity was significantly lower in U87 and U251 cells transfected with miR-129-5p mimic plus plasmid vector containing WT-3’UTR of ZRANB2 compared to those transfected with miR-129-5p mimic plus plasmid vector containing MUT-3’UTR of ZRANB2 (Figure 7C). Furthermore, ZRANB2 mRNA levels were significantly higher in the four glioma cell lines compared with the NHA cell line (Figure 7D). QRT-PCR and western blot analysis showed that ZRANB2 mRNA and protein levels were significantly decreased when U87 and U251 cells were transfected with the miR-129-5p mimic, but these effects were reversed in U87 and U251 cells overexpressing FAM181A-AS1 (Figure 7E–7F).
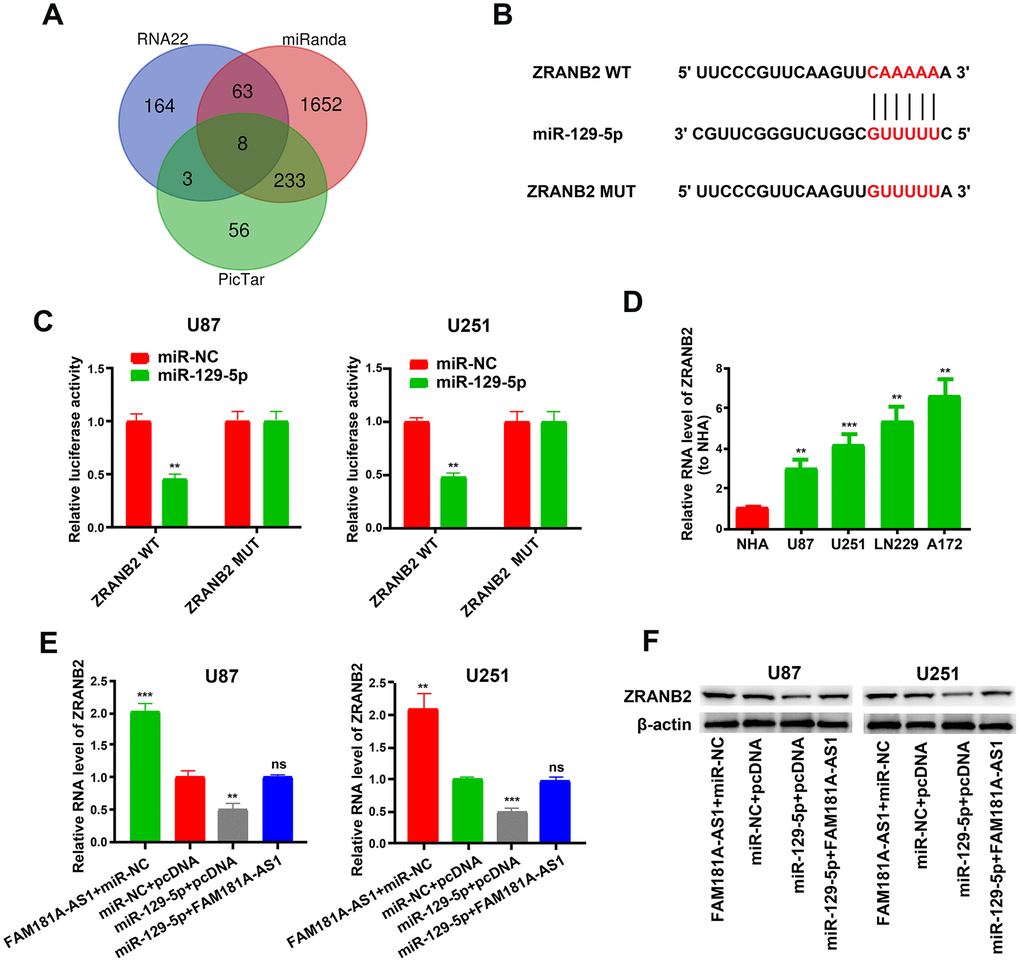
Figure 7. ZRANB2 is a downstream target gene of miR-129-5p. (A) RNA22, miRanda and PicTar analyses results show identification of 8 potential miR-129-5p target genes, namely, ZNF646, RBPJ, CAMTA1, FBXW7, ZRANB2, L1CAM, PDS5A and ZFHX3. (B) Diagrammatic representation shows miR-129-5p binding sites in the WT and MUT 3'UTR of ZRANB2. (C) Dual luciferase reporter assay results show relative luciferase activity in U87 and U251 cell lines transfected with miR-129-5p mimic and plasmid vectors carrying WT or MUT 3′UTR of ZRANB2. (D) QRT-PCR results show ZRANB2 mRNA levels in glioma cell lines and the control NHA cell line. (E, F) QRT-PCR and Western blot analyses show ZRANB2 mRNA and protein levels, respectively, in FAM181A-AS1-overexpressing U87 and U251 cell lines transfected with miR-NC or miR-129-5p mimic. Note: **P<0.01, ***P<0.001; ns, not statistically significant; data are represented as means ± SD.
ZRANB2 overexpression promotes proliferation of FAM181A-AS1 downregulating glioma cells
Next, we analyzed the role of ZRANB2 in gliomagenesis by performing plasmid overexpression in glioma cell lines and assaying their cell growth and viability. QRT-PCR analysis showed that ZRANB2 mRNA levels were significantly upregulated in ZRANB2-expression plasmid-transfected LN229 and A172 cells compared to the corresponding controls (Figure 8A). ZRANB2 overexpression in FAM181A-AS1-downregulating LN229 and A172 cells showed significantly increased proliferation and colony formation compared to FAM181A-AS1 downregulating LN229 and A172 cells (Figure 8B–8D).
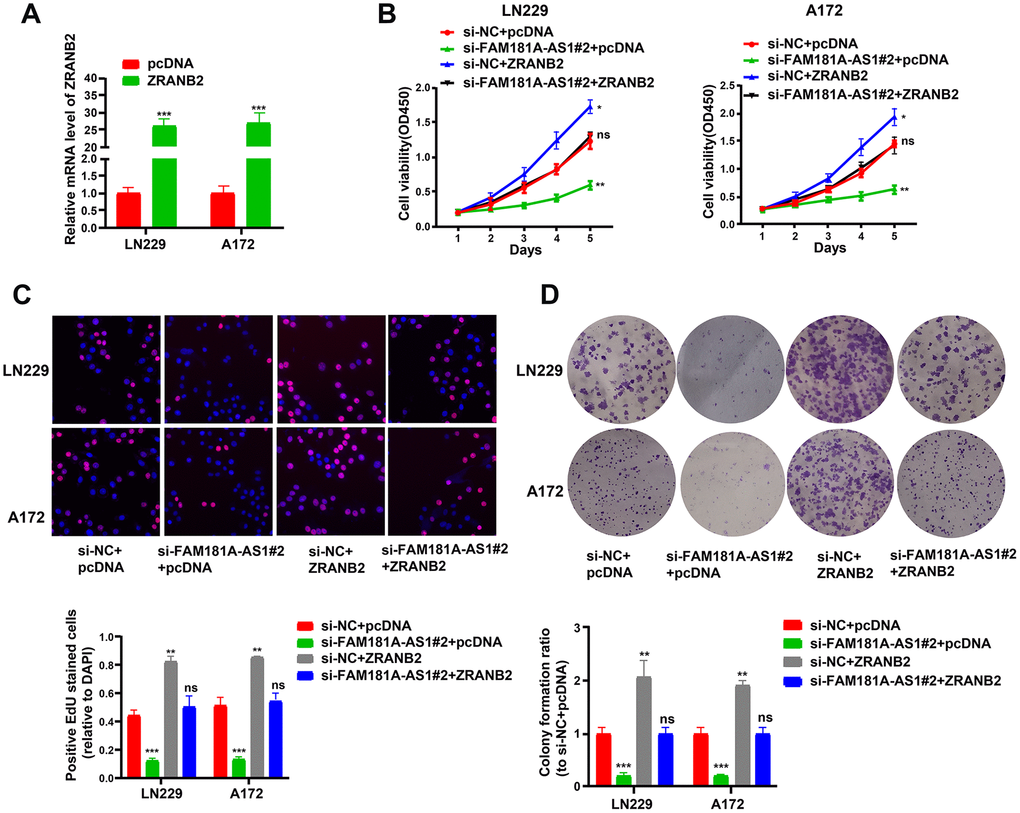
Figure 8. ZRANB2 overexpression promotes proliferation of FAM181A-AS1 downregulating glioma cells. (A) Transfection efficiency of ZRANB2-expression plasmid in LN229 and A172 cell lines is examined through qRT-PCR. (B, C) CCK-8 and EdU analyses of the cell viability after transfection with FAM181A-AS1 siRNA and (or) ZRANB2-expression plasmid in LN229 and A172 cell lines. (D) Colony formation analysis of the cell colony abilities after transfection with FAM181A-AS1 siRNA plasmid and (or) ZRANB2-expression plasmid in LN229 and A172 cell lines. **P<0.01, ***P<0.001, ns: no statistical significance, data represent the mean ± SD.
Discussion
Recent advances in transcriptomics have highlighted the significant functions of several lncRNAs in tumorigenesis and cancer therapy. LINC00174 knockdown improves the response of human glioma cells to temozolomide by modulating the miR-138-5p/SOX9 axis [25]. LncRNA CCAT1 enhances the growth of gliomas by sponging miR-181b [26]. Besides, lncRNA UCA1 regulates glioma growth and metastasis via miR- 182-dependent regulation of iASPP protein [27]. These reports highlight the pivotal role of lncRNAs in regulating gliomagenesis. In this study, we analyzed the role of lncRNA FAM181A-AS1 in gliomagenesis. The analysis of RNA-seq data in the TCGA and GTEx databases showed that FAM181A-AS1 expression is significantly increased in glioma tissues compared to normal brain tissues. Moreover, CGGA database analysis showed that high FAM181A-AS1 expression correlates with worse survival rates of glioma patients. Furthermore, FAM181A-AS1 overexpression significantly increased proliferation and colony formation of glioma cell lines, whereas, these effects were reversed in FAM181A-AS1 knockdown glioma cell lines.
LncRNAs modulate cellular growth and survival by acting as ceRNAs that sponge miRNAs [28, 29]. We demonstrate an inverse relationship between FAM181A-AS1 and miR-129-5p expression in glioma samples. Previous studies show that miR-129-5p inhibits growth and progression of gastric cancer [30], breast cancer [31], colon cancer [32] and chondrosarcoma [33]. In our study, we demonstrate that miR-129-5p overexpression decreases proliferation of FAM181A-AS1-overexpressing glioma cells. Besides, miR-129-5p expression correlates with the clinical stage and overall survival of glioma patients. Overall, our data suggests that miR-129-5p plays an inhibitory role in gliomas, whereas, FAM181A-AS1 promotes growth of glioma cells by sponging miR-129-5p.
Our study also confirms that ZRANB2 expression is regulated by miR-129-5p in glioma cells. ZRANB2 is an RNA-binding protein that was initially discovered in the rat juxtaglomerular cells [34]. ZRANB2 binds to Smad and suppresses the bone morphogenetic protein (BMP) signaling pathway in HEK293T cells [35]. Besides, ZRANB2 is highly expressed in the serous papillary carcinomas of the ovaries [34]. Li et al. showed that glioma cells and tissues overexpress ZRANB2 and its downregulation reduces proliferation, migration, invasion and vasculogenic mimicry of glioma cells [24]. Therefore, our results demonstrate that lncRNA FAM181A-AS1 promotes growth of gliomas by increasing ZRANB2 expression via sponging of miR-129-5p.
This study has several limitations. Firstly, we lack glioma tissue samples. Hence, in the future, a larger patient sample size is required to confirm the clinical value of FAM181A-AS1 in glioma patients. Secondly, we did not analyze other FAM181A-AS1-related target genes and miRNAs.
In conclusion, our study demonstrates that lncRNA FAM181A-AS1 promotes growth and survival of glioma cells by enhancing ZRANB2 expression via sponging of miR-129-5p. Our study suggests that lncRNA FAM181A-AS1 is a potential prognostic biomarker and therapeutic target for glioma patients.
Materials and Methods
Identification FAM181A-AS1-specific miRNAs and miR-129-5p target genes
We screened the microRNA.org database (http://www.microrna.org) to identify for FAM181A-AS1-binding microRNAs and miR-129-5p target genes.
Cell culture
We purchased normal human astrocyte (NHA) cell line and four glioma cell lines (LN229, A172, U87 and U251) from the Institute of Biochemistry and Cell Biology of the Chinese Academy of Sciences (Shanghai, China). They were cultured in DMEM (GIBCO-BRL) medium with 10% FBS, 100 mg/mL streptomycin and 100 U/mL penicillin in a humidified incubator at 37° C and 5% CO2.
Quantitative real-time PCR (qRT-PCR)
Total RNA was extracted using TRIzol (Beyotime, Nantong, China) according to manufacturer’s instructions. Equal amounts of total RNA were reverse transcribed using M-MLV, and the cDNA was amplified and quantified using PrimeScript™ Reverse Transcription reagent kit (Takara, Dalian, China) according to the manufacturer’s instructions. We used U6 and GAPDH as internal controls to quantify expression of miR-129-5p and FAM181A-AS1, respectively, using the 2-ΔΔCt method. All experiments were repeated thrice. The primers used in this study are:
FAM181A-AS1 forward: 5'-GAGACCCAGTAAAGCCCACT-3';
FAM181A-AS1 reverse: 5'-TTCAGGGCCTGCATAGAACA-3';
MiR-129-5p forward: 5′-ACCCAGTGCGATTTGTCA-3';
MiR-129-5p reverse: 5'-ACTGTACTGGAAGATGGACC-3';
GADPH forward: 5'-AGTAGAGGCAGGGATGATG-3';
GAPDH reverse: 5'-TGGTATCGTGGAAGGACTC-3';
U6 forward: 5'-GGTCGGGCAGGAAAGAGGGC-3';
U6 reverse: 5'-CTAATCTTCTCTGTATCGTTCC-3';
Western blotting
Total protein lysates were prepared by incubating cells with RIPA buffer (Beyotime Institute of Biotechnology, China) for 3 min followed by centrifugation at 17,000 g for 45 mins at 4° C. Then, the protein concentrations were determined using a BCA protein assay kit (Beyotime, Nantong, China). Equal amounts of total protein lysates were separated on a 10% SDS-PAGE and then transferred onto PVDF membranes. Then, the PVDF membranes were incubated with 5% skim milk in Tris-buffered saline with Tween (TBST) for 2 h at room temperature. The membranes were incubated with primary antibodies against zinc-finger RAN-binding domain containing protein 2 (ZRANB2, 1:500; Proteintech, Rosemont, IL, USA), Cyclin D1 (ab16663, 1:100; Abcam, Shanghai, China), Bcl-2 (ab182858, 1:1000; Abcam, Shanghai, China) and PCNA (ab29, 1:500; Abcam, Shanghai, China) overnight at 4° C. Subsequently, after rinsing the membranes thrice with TBST, the membranes were incubated with HRP-conjugated secondary antibodies (1:1,000; Beyotime, Nantong, China) for 2 h at room temperature. Then, the blots were developed using enhanced chemiluminescence (ECL) Kit from Beyotime Institute of Biotechnology (China) and visualized using the ChemImager 5500 V2.03 software from Alpha Innotech (San Leandro, CA). The integrated density values (IDVs) of the protein bands were quantified using GAPDH as the internal control.
Dual luciferase reporter assay
We seeded U87 and U251 cells in 24-well plates for 24 h. Thereafter, we co-transfected the cells with 6 ng of pmirGLO vectors carrying wild-type (WT) or mutant (MUT) FAM181A-AS1 or WT or MUT 3’UTR of ZRANB2 and 100 nmol/L of miR-129-5p or miR-NC. Similarly, we co-transfected the cells with 6 ng of pmirGLO vectors carrying wild-type (WT) or mutant (MUT) miR-129-5p and pcDNA3.1-FAM181A-AS1 plasmids or pcDNA3.1 negative control. After 48 h, we used the Dual luciferase Reporter System (Promega, Madison, WI, USA) to analyze the firefly and Renilla luciferase activities according to manufacturer’s instructions.
Cell transfections
We purchased pcDNA3.1, pcDNA3.1-FAM181A-AS1 plasmids and pcDNA3.1-ZRANB2 plasmids, si-NC and si-FAM181A-AS1, as well as miR-NC and miR-129-5p mimic from Genepharma (Shanghai, China). For transfections, we seeded LN229, A172, U87 and U251 cell lines in six-well plates for 24 h, and performed transfections with plasmids, siRNAs, or miRNA mimics at 50-70% confluence using Lipofectamine 2000 (Invitrogen, Shanghai, China) according to manufacturer’s instructions.
Cell proliferation assays
For the CCK-8 assay, we seeded 1-2×10³cells/well in 96-well plates overnight at 37° C and 5% CO2. Then, we used the CCK-8 kit (Dojindo Laboratories, Shanghai, China) to determine cell proliferation at different time points. Briefly, the primary medium in the wells was replaced with 100 μL of complete medium with 10 μL of CCK-8 reagent, and the cells were incubated for 2 h. Then, the absorbance was determined at 450 nm using a plate reader.
Cells seeded in 96-well plates were labeled with 50 μM medium containing 5-ethynyl-2’-deoxyuridine (EdU; Ribobio Co., Ltd., Guangzhou, China) for 2 h, fixed with 4% paraformaldehyde and 0.5% Triton X-100 and incubated with anti-EdU working solution according to the manufacturer’s instructions. Cell nuclei were dyed with DAPI (Beyotime, Nantong, China). A total of five randomly selected fields of view in each well were captured using fluorescence microscopy (x200 magnification) to calculate EdU-positive cells. The experiments were performed in triplicate.
Colony formation assays
For the colony formation assays, 2×10³ cells were seeded in 12-well plates and incubated for 1 week at 37° C and 5% CO2. Then, the colonies were stained using a solution containing 0.1% crystal violet and 20% methanol. The colonies in each well were counted under a light microscope.
Measurement of apoptosis
Apoptotic cells were detected by using Annexin V-FITC/PI Apoptosis Detection Kit (Beyotime, China). After transfection, the cells were washed with PBS for three times and stained with 5 μL Annexin V-FITC for 5 min in the dark at room temperature, followed by being added with 10 μL Propidium Iodide (PI) for 15 min. Next, the samples were detected with BeamCyte (China) and analyzed with CytoSYS 1.0 software.
Cell cycle analysis
Cell Cycle and Apoptosis Kit (Beyotime, China) was utilized to detect cell cycle. Briefly, cells were washed with pre-cooled PBS and fixed with 70% ethanol for 24 h overnight. After that, 0.2% Triton X-100 was added into the cell solution, followed by re-suspended with 100 μg/mL RAase A for 30 min. Next, 10 μL PI solution was added for staining at 37° C in the dark. BeamCyte (China) was used to analyze the results.
RNA pull-down assay
Human glioma cells were lysed with cell lysis buffer (RNA pull-down kit, gzscbio, Guangzhou, China). The biotinylated FAM181A-AS1 or negative control (GenePharma, Shanghai, China) was incubated with Dynabeads M-280 Streptavidin (Invitrogen, Shanghai, China) to generate probe-coated beads. The lysates were incubated with the probe-coated beads at 4° C overnight. Then, the RNA complexes bound to these beads were eluted with Wash Buffer (RNA pull-down kit, gzscbio, Guangzhou, China). Finally, the miR-129-5p levels in the pulled down RNA were quantified using qRT-PCR.
RNA immunoprecipitation (RIP)
We performed the RIP assay using the Magna RIP RNA-binding protein immunoprecipitation kit (Millipore Corp., Billerica, MA, USA). We used rabbit polyclonal anti-Ago2 antibody (ab5072, Abcam) to pull down the RNA. Anti-IgG antibodies were used as negative control. Then, FAM181A-AS1 and miR-129-5p levels in the pulled down RNA was quantified using qRT-PCR.
Statistical analysis
Statistical analyses were performed using SPSS 20.0 (IBM; Chicago, IL, USA) and GraphPad Prism (GraphPad software, San Diego, CA, USA) software. The differences between groups with normally distributed data with equal variance were evaluated using 2-tailed Student t test (2-group comparisons) or ANOVA followed by the post-hoc Bonferroni test (multigroup comparisons) as appropriate. The differences between groups with non-normally distributed data or unequal variance were evaluated using nonparametric Mann-Whitney U test (2-group comparisons) or the Kruskal-Wallis test followed by the post-hoc Bonferroni test (multigroup comparisons). Pearson's correlation coefficient analysis was used to determine the association between FAM181A-AS1 and other miRNAs. Kaplan-Meier survival curve analysis and log-rank test was used to analyze prognostic significance. Receiver operating characteristic (ROC) curves analysis was performed to investigate the association between glioma and FAM181A-AS1/miR-129-5p expression levels. The data are presented as means ± SD. P<0.05 was considered statistically significant.
Supplementary Materials
Author Contributions
Chen Dong contributed to the concept and design of the study and supervised this research. Jiang Xin and performed the animal experiments. Chen Dong performed the subsequent morphological and molecular biology experiments, interpreted the results. Jiang Xin and Chen Dong drafted and wrote the manuscript, and finally approved the submission of this research. Chen Dong is responsible for the overall contents. All authors read and approved the final manuscript.
Acknowledgments
We thank English Edit OT (http://oncotarget.com/english-edit-ot) for English language editing.
Conflicts of Interest
The authors declare that there are no conflicts of interest.
References
- 1. Qaddoumi I, Sultan I, Gajjar A. Outcome and prognostic features in pediatric gliomas: a review of 6212 cases from the surveillance, epidemiology, and end results database. Cancer. 2009; 115:5761–70. https://doi.org/10.1002/cncr.24663 [PubMed]
- 2. Rynkeviciene R, Simiene J, Strainiene E, Stankevicius V, Usinskiene J, Miseikyte Kaubriene E, Meskinyte I, Cicenas J, Suziedelis K. Non-coding RNAs in glioma. Cancers (Basel). 2018; 11:17. https://doi.org/10.3390/cancers11010017 [PubMed]
- 3. Zheng Y, Lu S, Xu Y, Zheng J. Long non-coding RNA AGAP2-AS1 promotes the proliferation of glioma cells by sponging miR-15a/b-5p to upregulate the expression of HDGF and activating Wnt/β-catenin signaling pathway. Int J Biol Macromol. 2019; 128:521–30. https://doi.org/10.1016/j.ijbiomac.2019.01.121 [PubMed]
- 4. Alfonso JC, Talkenberger K, Seifert M, Klink B, Hawkins-Daarud A, Swanson KR, Hatzikirou H, Deutsch A. The biology and mathematical modelling of glioma invasion: a review. J R Soc Interface. 2017; 14:20170490. https://doi.org/10.1098/rsif.2017.0490 [PubMed]
- 5. Turkalp Z, Karamchandani J, Das S. IDH mutation in glioma: new insights and promises for the future. JAMA Neurol. 2014; 71:1319–25. https://doi.org/10.1001/jamaneurol.2014.1205 [PubMed]
- 6. Leu S, von Felten S, Frank S, Vassella E, Vajtai I, Taylor E, Schulz M, Hutter G, Hench J, Schucht P, Boulay JL, Mariani L. IDH/MGMT-driven molecular classification of low-grade glioma is a strong predictor for long-term survival. Neuro Oncol. 2013; 15:469–79. https://doi.org/10.1093/neuonc/nos317 [PubMed]
- 7. Metellus P, Coulibaly B, Colin C, de Paula AM, Vasiljevic A, Taieb D, Barlier A, Boisselier B, Mokhtari K, Wang XW, Loundou A, Chapon F, Pineau S, et al. Absence of IDH mutation identifies a novel radiologic and molecular subtype of WHO grade II gliomas with dismal prognosis. Acta Neuropathol. 2010; 120:719–29. https://doi.org/10.1007/s00401-010-0777-8 [PubMed]
- 8. Jarroux J, Morillon A, Pinskaya M. History, discovery, and classification of lncRNAs. Adv Exp Med Biol. 2017; 1008:1–46. https://doi.org/10.1007/978-981-10-5203-3_1 [PubMed]
- 9. Zhao W, Qin P, Zhang D, Cui X, Gao J, Yu Z, Chai Y, Wang J, Li J. Long non-coding RNA PVT1 encapsulated in bone marrow mesenchymal stem cell-derived exosomes promotes osteosarcoma growth and metastasis by stabilizing ERG and sponging miR-183-5p. Aging (Albany NY). 2019; 11:9581–96. https://doi.org/10.18632/aging.102406 [PubMed]
- 10. Bolha L, Ravnik-Glavač M, Glavač D. Long noncoding RNAs as biomarkers in cancer. Dis Markers. 2017; 2017:7243968. https://doi.org/10.1155/2017/7243968 [PubMed]
- 11. Wang X, Li L, Zhao K, Lin Q, Li H, Xue X, Ge W, He H, Liu D, Xie H, Wu Q, Hu Y. A novel LncRNA HITT forms a regulatory loop with HIF-1α to modulate angiogenesis and tumor growth. Cell Death Differ. 2020; 27:1431–46. https://doi.org/10.1038/s41418-019-0449-8 [PubMed]
- 12. Zhang K, Zhang M, Yao Q, Han X, Zhao Y, Zheng L, Li G, Liu Q, Chang Y, Zhang P, Cui H, Shi Z, Chen T, et al. The hepatocyte-specifically expressed lnc-HSER alleviates hepatic fibrosis by inhibiting hepatocyte apoptosis and epithelial-mesenchymal transition. Theranostics. 2019; 9:7566–82. https://doi.org/10.7150/thno.36942 [PubMed]
- 13. Li Y, Li L, Wang Z, Pan T, Sahni N, Jin X, Wang G, Li J, Zheng X, Zhang Y, Xu J, Yi S, Li X. LncMAP: pan-cancer atlas of long noncoding RNA-mediated transcriptional network perturbations. Nucleic Acids Res. 2018; 46:1113–23. https://doi.org/10.1093/nar/gkx1311 [PubMed]
- 14. Zhou HJ, Wang LQ, Wang DB, Yu JB, Zhu Y, Xu QS, Zheng XJ, Zhan RY. Long noncoding RNA MALAT1 contributes to inflammatory response of microglia following spinal cord injury via the modulation of a miR-199b/IKKβ/NF-κB signaling pathway. Am J Physiol Cell Physiol. 2018; 315:C52–61. https://doi.org/10.1152/ajpcell.00278.2017 [PubMed]
- 15. Wang W, Wu F, Zhao Z, Wang KY, Huang RY, Wang HY, Lan Q, Wang JF, Zhao JZ. Long noncoding RNA LINC00152 is a potential prognostic biomarker in patients with high-grade glioma. CNS Neurosci Ther. 2018; 24:957–66. https://doi.org/10.1111/cns.12850 [PubMed]
- 16. Liu Q, Yu W, Zhu S, Cheng K, Xu H, Lv Y, Long X, Ma L, Huang J, Sun S, Wang K. Long noncoding RNA GAS5 regulates the proliferation, migration, and invasion of glioma cells by negatively regulating miR-18a-5p. J Cell Physiol. 2018; 234:757–68. https://doi.org/10.1002/jcp.26889 [PubMed]
- 17. Lv QL, Hu L, Chen SH, Sun B, Fu ML, Qin CZ, Qu Q, Wang GH, He CJ, Zhou HH. A long noncoding RNA ZEB1-AS1 promotes tumorigenesis and predicts poor prognosis in glioma. Int J Mol Sci. 2016; 17:1431. https://doi.org/10.3390/ijms17091431 [PubMed]
- 18. Metellus P, Figarella-Branger D. Magnetic resonance metabolic imaging of glioma. Sci Transl Med. 2012; 4:116ps1. https://doi.org/10.1126/scitranslmed.3003591 [PubMed]
- 19. Yan H, Bigner DD, Velculescu V, Parsons DW. Mutant metabolic enzymes are at the origin of gliomas. Cancer Res. 2009; 69:9157–59. https://doi.org/10.1158/0008-5472.CAN-09-2650 [PubMed]
- 20. Betel D, Wilson M, Gabow A, Marks DS, Sander C. The microRNA.org resource: targets and expression. Nucleic Acids Res. 2008; 36:D149–53. https://doi.org/10.1093/nar/gkm995 [PubMed]
- 21. Zhang Y, Yan N, Wang X, Chang Y, Wang Y. MiR-129-5p regulates cell proliferation and apoptosis via IGF-1R/src/ERK/Egr-1 pathway in RA-fibroblast-like synoviocytes. Biosci Rep. 2019; 39:BSR20192009. https://doi.org/10.1042/BSR20192009 [PubMed]
- 22. Xiao N, Zhang J, Chen C, Wan Y, Wang N, Yang J. miR-129-5p improves cardiac function in rats with chronic heart failure through targeting HMGB1. Mamm Genome. 2019; 30:276–88. https://doi.org/10.1007/s00335-019-09817-0 [PubMed]
- 23. Qiu Z, Wang X, Shi Y, Da M. miR-129-5p suppresses proliferation, migration, and induces apoptosis in pancreatic cancer cells by targeting PBX3. Acta Biochim Biophys Sin (Shanghai). 2019; 51:997–1007. https://doi.org/10.1093/abbs/gmz096 [PubMed]
- 24. Li X, Xue Y, Liu X, Zheng J, Shen S, Yang C, Chen J, Li Z, Liu L, Ma J, Ma T, Liu Y. ZRANB2/SNHG20/FOXK1 axis regulates vasculogenic mimicry formation in glioma. J Exp Clin Cancer Res. 2019; 38:68. https://doi.org/10.1186/s13046-019-1073-7 [PubMed]
- 25. Li B, Zhao H, Song J, Wang F, Chen M. LINC00174 down-regulation decreases chemoresistance to temozolomide in human glioma cells by regulating miR-138-5p/SOX9 axis. Hum Cell. 2020; 33:159–74. https://doi.org/10.1007/s13577-019-00281-1 [PubMed]
- 26. Cui B, Li B, Liu Q, Cui Y. lncRNA CCAT1 promotes glioma tumorigenesis by sponging miR-181b. J Cell Biochem. 2017; 118:4548–57. https://doi.org/10.1002/jcb.26116 [PubMed]
- 27. He Z, Wang Y, Huang G, Wang Q, Zhao D, Chen L. The lncRNA UCA1 interacts with miR-182 to modulate glioma proliferation and migration by targeting iASPP. Arch Biochem Biophys. 2017; 623:1–8. https://doi.org/10.1016/j.abb.2017.01.013 [PubMed]
- 28. Zhang Y, Xu Y, Feng L, Li F, Sun Z, Wu T, Shi X, Li J, Li X. Comprehensive characterization of lncRNA-mRNA related ceRNA network across 12 major cancers. Oncotarget. 2016; 7:64148–67. https://doi.org/10.18632/oncotarget.11637 [PubMed]
- 29. Fan CN, Ma L, Liu N. Systematic analysis of lncRNA-miRNA-mRNA competing endogenous RNA network identifies four-lncRNA signature as a prognostic biomarker for breast cancer. J Transl Med. 2018; 16:264. https://doi.org/10.1186/s12967-018-1640-2 [PubMed]
- 30. Wang Q, Yu J. MiR-129-5p suppresses gastric cancer cell invasion and proliferation by inhibiting COL1A1. Biochem Cell Biol. 2018; 96:19–25. https://doi.org/10.1139/bcb-2016-0254 [PubMed]
- 31. Meng R, Fang J, Yu Y, Hou LK, Chi JR, Chen AX, Zhao Y, Cao XC. miR-129-5p suppresses breast cancer proliferation by targeting CBX4. Neoplasma. 2018; 65:572–78. https://doi.org/10.4149/neo_2018_170814N530 [PubMed]
- 32. Wu Q, Meng WY, Jie Y, Zhao H. LncRNA MALAT1 induces colon cancer development by regulating miR-129-5p/HMGB1 axis. J Cell Physiol. 2018; 233:6750–57. https://doi.org/10.1002/jcp.26383 [PubMed]
- 33. Zhang P, Li J, Song Y, Wang X. MiR-129-5p inhibits proliferation and invasion of chondrosarcoma cells by regulating SOX4/wnt/β-catenin signaling pathway. Cell Physiol Biochem. 2017; 42:242–53. https://doi.org/10.1159/000477323 [PubMed]
- 34. Yang YH, Markus MA, Mangs AH, Raitskin O, Sperling R, Morris BJ. ZRANB2 localizes to supraspliceosomes and influences the alternative splicing of multiple genes in the transcriptome. Mol Biol Rep. 2013; 40:5381–95. https://doi.org/10.1007/s11033-013-2637-9 [PubMed]
- 35. Ohte S, Kokabu S, Iemura S, Sasanuma H, Yoneyama K, Shin M, Suzuki S, Fukuda T, Nakamura Y, Jimi E, Natsume T, Katagiri T. Identification and functional analysis of Zranb2 as a novel smad-binding protein that suppresses BMP signaling. J Cell Biochem. 2012; 113:808–14. https://doi.org/10.1002/jcb.23408 [PubMed]