


Introduction
Hepatocellular carcinoma (HCC) is the third most common digestive cancer in global incidence and mortality, ranks the fourth highest among all tumors. Rates of both incidence and mortality in men are 2 to 3 times higher than women, and the mortality of HCC ranks second only to that of lung cancer among men [1]. Although the pace of increase in women has slowed from previous years, incidence in men has continued to grow at a rate of 2% to 3% annually for the past decade [2]. Main risk factors for HCC are chronic infection with hepatitis B virus (HBV) or hepatitis C virus (HCV), alcohol consumption, aflatoxin-contaminated foodstuffs, smoking, obesity and type 2 diabetes [3]. Many HCC patients were diagnosed with advanced stage because of mild symptoms in the early stages. Treatment of HCC mainly includes surgical resection, radiofrequency ablation, liver transplantation, radiotherapy, transcatheter arterial chemoembolization (TACE) and targeted therapy [4]. In the past few years, immune checkpoint inhibitors (ICIs) was considered to be one of the most promising treatments in cancer immunotherapy. Several clinical trials of programmed death-1/programmed death-ligand 1 (PD-1/PD-L1) inhibitors in HCC have been conducted to show patient benefit [5, 6]. Tumor mutation burden (TMB) is one of the popular biomarkers for predicting the efficacy of PD-1 inhibitors. Previously studies demonstrated a correlation between high TMB and clinical benefits of PD-1 inhibitors in lung cancer [7]. HCC has a higher tumor mutation load than the average for other solid tumors [8]. In immunotherapy for most tumors, overall survival (OS) was significantly longer in patients with high TMB than in those with low TMB, showing a median overall survival difference of approximately 40% [9]. In the 2019 guidelines for non-small cell lung cancer (NSCLC), a new item of TMB was added to identify lung cancer patients who were eligible for dual immunotherapy with " Nivolumab plus Ipilimumab" and "Nivolumab" single-drug immunotherapy [10, 11]. However, the role of TMB in immunotherapy of HCC remained unclear.
Immunotherapy is aimed to arouse and strengthen the body's immune system to kill the tumor cells through various methods [12]. In this case, the higher TMB, the more personality of the tumor is different from normal tissue, and the easier it is to be the target of immune cells, so the more likely it is theoretically to response to immunotherapy [13]. Surrounding tissues, immune cells, blood vessels and extracellular matrix together constitute the tumor microenvironment, which is the "fertile soil" to help the tumor expand and invade faster [14]. Immune cells involved in tumor development are diverse and highly heterogeneous. Complex and subtle relationship between different types of immune infiltrating cells and cell receptors often related to vascular invasion and tumor escape [15]. Previous studies have shown CD8+ T cells that express different levels of PD-1 are enriched in HCC tissues [16]. A study of 5,000 T-cell sequencing data has described the landscape of infiltrating T cells in HCC, showing that large numbers of dysfunctional, killing T cells and inhibiting T cells clustered in tumor tissues [17]. In addition, depleted T cells may further potentially evolve into inhibitory T cells.
Vascular invasion (VI) has been widely demonstrated to be closely associated with poor prognosis in patients with HCC after surgery resection [18, 19]. Even in tumors of same stages receiving the same treatment, the prognosis is still different [20], attributing it to the biological behavior of the tumor. Microvascular invasion (MVI) prior VI and VI has attracted more attention, which proved to be high risk factor for early recurrence of HCC after operation [21]. Previous studies have indicated that HCC with microvascular invasion are needed to be comprehensively evaluated for a wider ablation margin and should be considered as a candidate for liver transplantation more cautiously [20, 22]. However, even accepting radical resection, almost half of the patients relapsed within 3 years [23]. At present, few studies have been conducted on the relationship between VI and infiltrating immune cells, nor on the relationship between recurrence and TMB in HCC.
By analogy with other tumor clinical findings, TMB does play a potential role in HCC-related immunity. But there is still lack of evidences on the relationship between HCC and TMB currently. The aim of our study is to explore the differences of immune infiltrating cells at different TMB levels, identify related genes and construct prognostic panels. Additionally, we hope to further explore the potential role of TMB in vascular invasion and HCC recurrence.
Results
Characteristics of included patients and landscape of mutation profiles in HCC
Detailed characteristics of patients in the low TMB and high TMB group were presented in Table 1. There was a significant difference in TMB level between the two independent sets (P < 0.01). After matching with propensity score, composition of pathology grade was basically similar (P = 0.63). As for gender and age, there was no paramount difference between the two groups (P=0.23, P=0.61). It can be seen that age > 60 and male had sufficient advantages in the proportion of population, especially in the high TMB group (67.57%, 72.97%). Notably, a considerable proportion of people in high TMB group were infected with the virus (40.54% vs 10.81%, including HBV and HCV infection), suggesting that influence of potential virus DNA integration. No significant differences could be found in alcohol consumption and family history of cancer in our study cohort (P = 0.80, P = 0.76). 72.97% of patients in the high TMB group were in stage III-IV of TNM staging, and accounted for the majority of patients in ACJJ-T staging (72.97%), compared to patients in low TMB group (67.57%).
Table 1. Clinical baseline of HCC patients screened in the TCGA cohort study.
| Characteristics | Low TMB, n=37(%) | High TMB, n=37(%) | P value | ||||||||||||||||||||||||||||||||||||||||||||||||||||||||||||||||||||||||||||||||||||||||||||||||
| Age | |||||||||||||||||||||||||||||||||||||||||||||||||||||||||||||||||||||||||||||||||||||||||||||||||||
| >60 | 20(54.05%) | 25(67.57%) | 0.23 | ||||||||||||||||||||||||||||||||||||||||||||||||||||||||||||||||||||||||||||||||||||||||||||||||
| <60 | 17(45.95%) | 12(32.43%) | |||||||||||||||||||||||||||||||||||||||||||||||||||||||||||||||||||||||||||||||||||||||||||||||||
| Gender | |||||||||||||||||||||||||||||||||||||||||||||||||||||||||||||||||||||||||||||||||||||||||||||||||||
| Male | 25(67.57%) | 27(72.97%) | 0.61 | ||||||||||||||||||||||||||||||||||||||||||||||||||||||||||||||||||||||||||||||||||||||||||||||||
| Female | 12(32.43%) | 10(27.03%) | |||||||||||||||||||||||||||||||||||||||||||||||||||||||||||||||||||||||||||||||||||||||||||||||||
| Viral infection | |||||||||||||||||||||||||||||||||||||||||||||||||||||||||||||||||||||||||||||||||||||||||||||||||||
| Positive | 4(10.81%) | 15(40.54%) | 0.00 | ||||||||||||||||||||||||||||||||||||||||||||||||||||||||||||||||||||||||||||||||||||||||||||||||
| Negative | 33(89.19%) | 22(59.46%) | |||||||||||||||||||||||||||||||||||||||||||||||||||||||||||||||||||||||||||||||||||||||||||||||||
| Alcohol consumption | |||||||||||||||||||||||||||||||||||||||||||||||||||||||||||||||||||||||||||||||||||||||||||||||||||
| Yes | 12(32.43%) | 11(29.73%) | 0.80 | ||||||||||||||||||||||||||||||||||||||||||||||||||||||||||||||||||||||||||||||||||||||||||||||||
| No | 25(67.57%) | 26(70.27%) | |||||||||||||||||||||||||||||||||||||||||||||||||||||||||||||||||||||||||||||||||||||||||||||||||
| Family history | |||||||||||||||||||||||||||||||||||||||||||||||||||||||||||||||||||||||||||||||||||||||||||||||||||
| Yes | 7(18.92%) | 6(16.22%) | 0.76 | ||||||||||||||||||||||||||||||||||||||||||||||||||||||||||||||||||||||||||||||||||||||||||||||||
| No | 30(81.08%) | 31(83.78%) | |||||||||||||||||||||||||||||||||||||||||||||||||||||||||||||||||||||||||||||||||||||||||||||||||
| Pathology grade | |||||||||||||||||||||||||||||||||||||||||||||||||||||||||||||||||||||||||||||||||||||||||||||||||||
| G1/G2 | 25(67.57%) | 23(62.16%) | 0.63 | ||||||||||||||||||||||||||||||||||||||||||||||||||||||||||||||||||||||||||||||||||||||||||||||||
| G3/G4 | 12(32.43%) | 14(37.84%) | |||||||||||||||||||||||||||||||||||||||||||||||||||||||||||||||||||||||||||||||||||||||||||||||||
| TNM Stage | |||||||||||||||||||||||||||||||||||||||||||||||||||||||||||||||||||||||||||||||||||||||||||||||||||
| Stage I and II | 12(32.43%) | 10(27.03%) | 0.61 | ||||||||||||||||||||||||||||||||||||||||||||||||||||||||||||||||||||||||||||||||||||||||||||||||
| Stage III and IV | 25(67.57%) | 27(72.97%) | |||||||||||||||||||||||||||||||||||||||||||||||||||||||||||||||||||||||||||||||||||||||||||||||||
| AJCC-T | |||||||||||||||||||||||||||||||||||||||||||||||||||||||||||||||||||||||||||||||||||||||||||||||||||
| T1-T2 | 13(35.14%) | 10(27.03%) | 0.45 | ||||||||||||||||||||||||||||||||||||||||||||||||||||||||||||||||||||||||||||||||||||||||||||||||
| T3-T4 | 24(64.86%) | 27(72.97%) | |||||||||||||||||||||||||||||||||||||||||||||||||||||||||||||||||||||||||||||||||||||||||||||||||
| TMB level | 3.12(1.24) | 6.88(1.82) | 0.00 | ||||||||||||||||||||||||||||||||||||||||||||||||||||||||||||||||||||||||||||||||||||||||||||||||
| Abbreviation: TMB, tumor mutation burden; AJCC, American Joint Committee on Cancer. | |||||||||||||||||||||||||||||||||||||||||||||||||||||||||||||||||||||||||||||||||||||||||||||||||||
Somatic mutation profiles with VCF format were visualized after propensity score matching (PSM) and X-tile analysis (Figure 1A, Supplementary Figure 1). Genetic information for the Top 20 cumulative mutations were TP53, TTN, MUC16, CTNNB1, PCLO, HMCN1, OBSCN, ALB, LRP1, MUC4, RYR2, SPTA1, SYNE1, AHNAK2, ARID1A, CSMD3, DNAH2, DNAH5, PTPRQ and WDR87. C>T was the most common single nucleotide mutation (SNV) in HCC (Figure 1B). Base changes in each sample and top 10 mutated genes in HCC were summarized in Figure 1E, and the frequency of single nucleotide polymorphism (SNP) was higher than insertion (INS) or deletion (DEL). Consistent and exclusive association among the mutant genes were shown in Figure 1D, where green represented the co-occurrence relationship and brown represented the exclusion relationship. Figure 1C showed the ranking TMB of HCC among all tumors included in TCGA, which was above average.
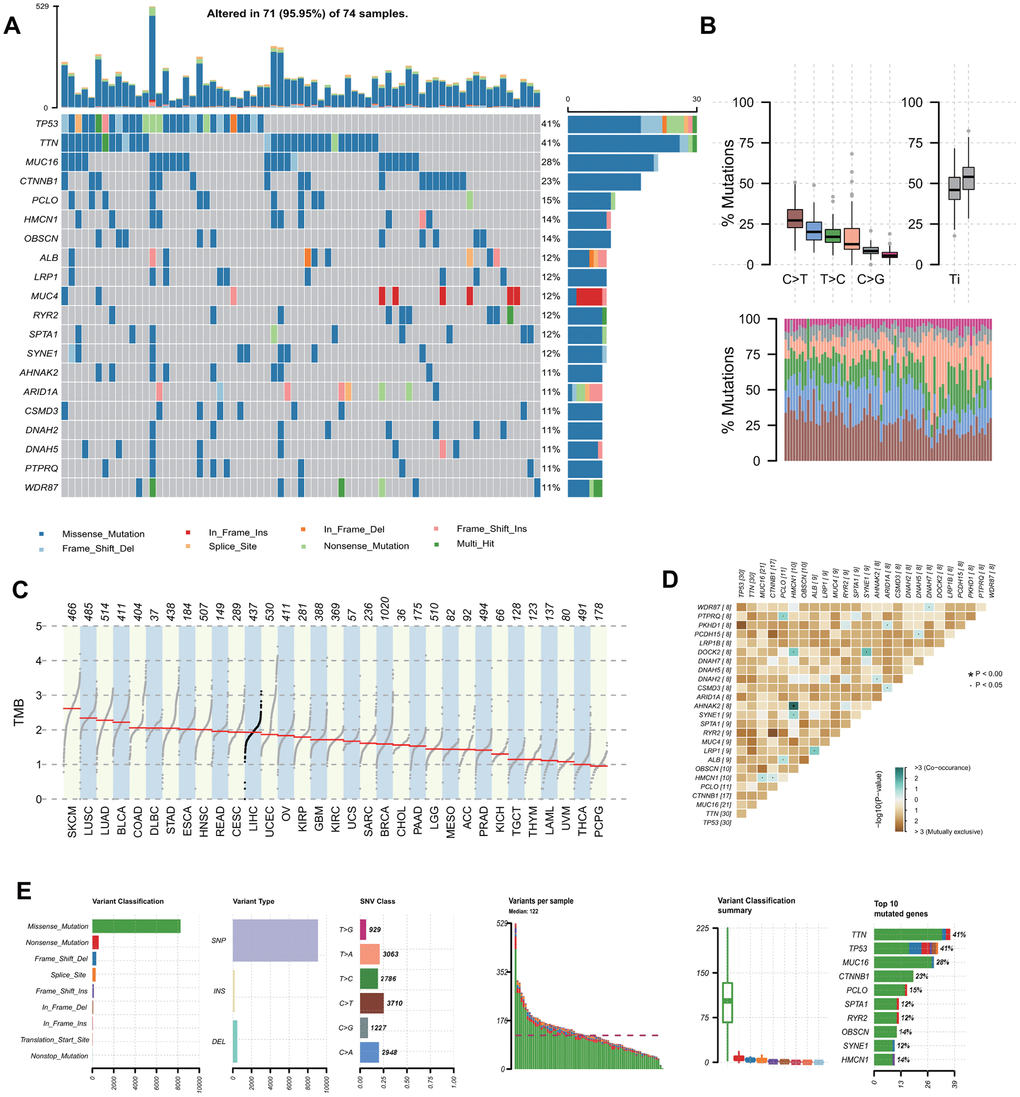
Figure 1. Landscape of mutation profiles in involved hepatocellular carcinoma tissue samples. (A) Mutation information of top 20 genes in each sample. Different colors and notes at the bottom represented types of mutations. (B) Overall distribution of the six different base substitution mutation frequency (above) and conversion ratio in each sample (below). (C) Tumor mutational burden ranking of HCC among all tumors in the Cancer Genome Atlas. (D) Co-occurrence associations across top 25 mutated genes. (E) Summary of the mutation information in all HCC tissue. TMB, tumor mutational burden; SNP, single nucleotide polymorphism; SNV, single nucleotide variants. HCC, hepatocellular carcinoma.
All 8 patients followed up were male patients with chronic hepatitis B (CHB), and Barcelona Clinic Liver Cancer (BCLC) grades were in A~B. Child-Pugh score ranged from 5 to 7, which indicated these patients who received radiofrequency ablations were in good condition. P7 and P11 suffered from recurrence during follow-up, and the lesions were more numerous than before. Clinicopathologic characteristics of the patients were summarized in Supplementary Table 1. Whole-exome sequencing (WES) was applied to the HCC tissues and adjacent normal tissues. Genetic information for the Top 100 cumulative mutations in each sample were showed in Figure 2A. The frequency of SNP was higher than insertion or deletion, and C>A was the more common in these patients (Figure 2B). Time points of P7 and P11 recurrence were shown in Figure 2C, and they were accompanied with higher TMB and more mutations in TMB infiltration (TMB-IF) model (Figure 2D).
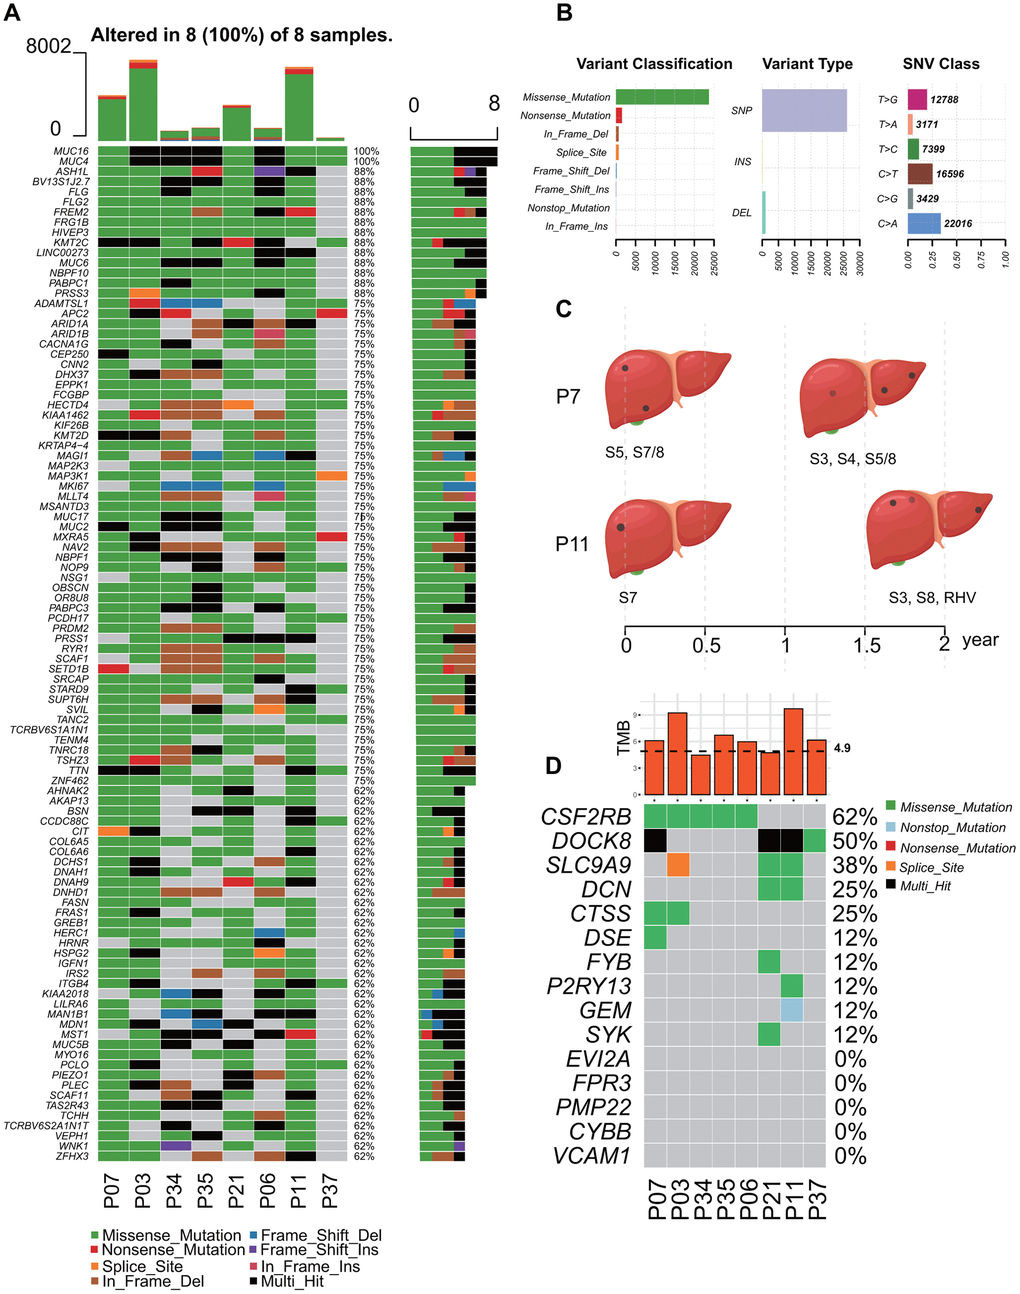
Figure 2. Landscape of mutation profiles of 8 followed-up HCC patients with recurrence risk. (A) Mutation information of Top 100 genes in each sample. Different colors and notes at the bottom represented types of mutations. (B) Summary of variant classification, variant type and SNV class information. (C) Time points of the recurrence of P7 and P11, and the location of the lesions. (D) TMB distribution of each patients and somatic mutation in immune-related genes among these HCC patients. TMB, tumor mutational burden; IF, Infiltration.
Differential abundance of infiltrating immune cells in low- and high- TMB group
ImmuneCellAI was adopted to estimate the immune infiltration between low- and high- TMB group. Percentage normalized stack graph showed that immune infiltration scores of the two groups were similar (Figure 3A). Top 10 immune infiltration scores in low TMB group were Macrophage (58.72%), DC (38.57%), Th17 (38.09%), MAIT (36.80%), Tc (34.45%), Th2 (33.77%), iTreg (30.64%), CD8_T cell (29.25%) and NK (25.87%), respectively. Meanwhile, in the high TMB group, the top 10 immune cells were Macrophage (54.40%), MAIT (32.83%), Th17 (51.48%), Tc (37.17%), Th2 (27.98%), iTreg (31.17%), DC (30.24%), NK (29.48%), Neutrophil (32.51%), and CD8_T cell (32.49%), respectively. Percentage table of all immune scores could be found in Supplementary Table 2.
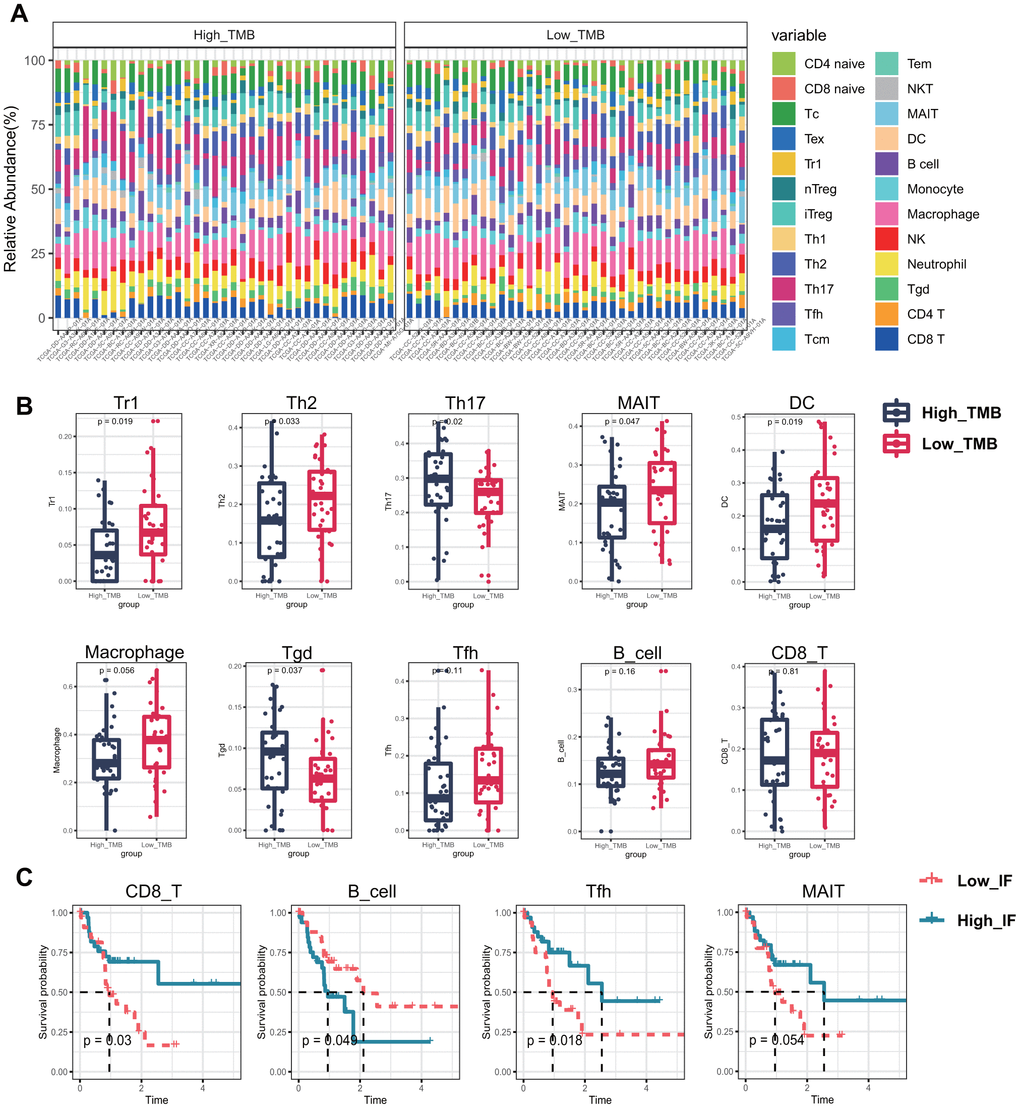
Figure 3. Infiltrating immune cells between different TMB groups and the effect on overall survival. (A) 24 types of infiltrating cells estimated by ImmuneCellAI. Different colors represent different types of immune cells, and the column length has been normalized by percentage. (B) 6 kinds of immune cells with significant infiltration in different TMB groups, and 3 others may affect the survival and prognosis of patients. (C) Kaplan–Meier survival analysis identified 4 types of immune cells that may affect the survival status. MAIT, Mucosal associated invariant T cells; Tc, cytotoxic T cells; Tex, exhausted T cells; Tr1, type 1 regulatory cells; nTreg, Natural regulatory T cells; iTreg, Induced regulatory T cells; Th1, Type 1 T helper cells; Th2, Type 2 T helper cells; Th17, Type 17 T helper cells; Tfh, Follicular helper T cells; Tcm, Central memory T cells; Tem, Effector memory T cells; NKT, Natural killer T cells; MAIT, Mucosal-associated invariant T cells; DC, Dendritic cells; Tgd, Gamma-delta T cells; TMB, tumor mutational burden; Low_ IF, low Infiltrating; High_ IF, high Infiltrating.
Figure 3B showed the immune cells with different infiltration in the two groups, including Tr1 (P = 0.02), Th2 (P = 0.03), Th17 (P = 0.02), MAIT (P = 0.05), DC (P = 0.02) and Tgd (P = 0.04). Th2, Th17 and Tgd showed higher immune infiltration scores in the high TMB group, while Tr1, MAIT and DC were higher in the low TMB group. The differences of the remaining 14 types of immune cells were all displayed in Supplementary Figure 2A, but they were not significant. To further screen out immune cells with potential impact on the survival of patients, Kaplan-Meier survival curves of all immune cells were plotted based on the median infiltration fraction. And the final potential immune cells were: CD8_T cell (P=0.03), B cell (P= 0.05) and Tfh (P= 0.02) (Figure 3C). Kaplan-Meier survival curves of the remaining 20 meaningless immune cells were shown in Supplementary Figure 2B.
Comparison of gene expression profiles and functional pathways analysis between low- and high- TMB groups
All the differentially expressed genes (DEGs) were listed in Supplementary Table 3, from which it can be seen that the expression of most genes was down-regulated with the increase of TMB. Subsequently, we conducted GO enrichment analysis for all of them (Figure 4C). In the part of Biological Process (BP), there were obvious enrichment in the terms of T cell activation and regulation of lymphocyte activation. Other items with potential critical roles included regulation of cell-cell differentiation, positive regulation of cell differentiation, and regulation of response to cytokine stimulus. In the cellular component (CC) part, DEGs were mostly enriched in terms related to cell membrane, such as membrane raft, plasma membrane raft, membrane microdomain, and cell substrata adhesives junction. In Molecular Function (MF), the most enriched terms were the cell adhesion molecule binding, followed by the extracellular matrix structural constituent, cytokine receptor binding and the glycosaminoglycan binding.
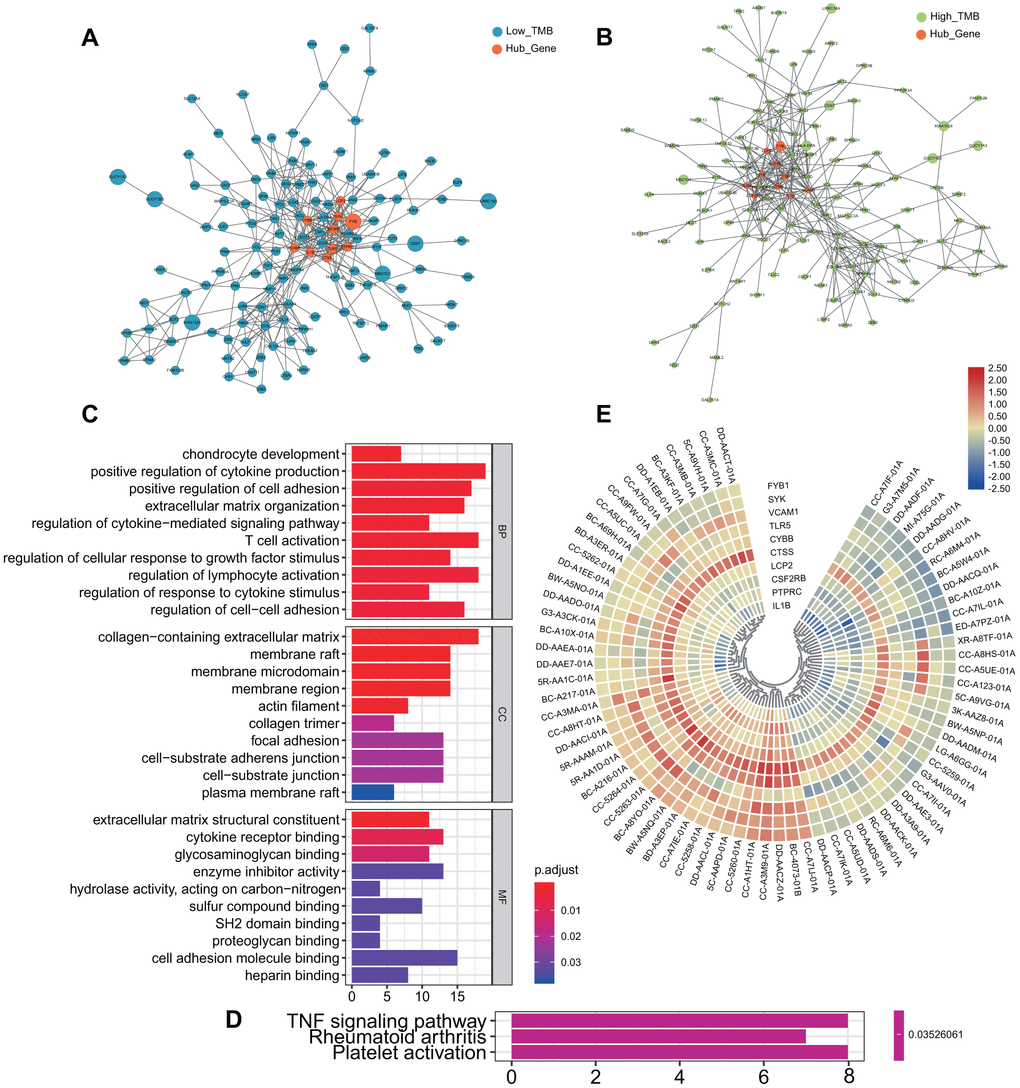
Figure 4. Differentially expressed genes and functional enrichment analysis between the two groups. (A, B) Protein-protein interaction network of all Differentially expressed genes. Orange represents the screened hub genes, and the size of circle represents the level of gene expression. (C) Go enrichment analysis of all differentially expressed genes. (D) KEGG analysis of all differentially expressed genes: TNF signaling pathway, Rheumatoid arthritis and Platelet activation. (E) Heatmap of selected hub genes in each patient. From left to right in order of low TMB and high TMB group. MF, Molecular Function; BP, Biological Process; CC, Cellular Component; GO, Gene Ontology; KEGG, Kyoto Encyclopedia of Genes and Genomes.
KEGG pathway analysis showed that DEGs play an important role in the TNF signaling pathway, which was often required for activated monocytes or macrophage cells to kill or inhibit tumor cells (Figure 4D). Meanwhile, PPI network of DEGs was constructed, and the 10 hub genes were screened out: PTPRC, CYBB, CTSS, LCP2, FYB, VCAM1, SYK, CSF2RB, TLR5 and IL1B (Figure 4A, 4B). Expression levels of hub genes in each patient were shown by heatmap (Figure 4E). The red part of the figure represents high expression, composed of patients with low TMB.
Identification of immune-related genes modules and associations of overall survival
All the immunocytes with different infiltration and those with potential influence on survival were included in weighted gene co-expression network analysis (WGCNA) analysis as immune traits. Then, the correlation matrix of 10 modules of different colors and 10 immune traits with potential influence on prognosis was established (Figure 5A). Macrophage, DC, MAIT and Infiltration Score were well correlated with the genes in the blue module (r=0.62, 0.62, 0.59, 0.68; P < 0.05). Genes screened from the blue module were shown in Figure 5B, and the remaining modules such as red, green, pink and magenta were all exhibited in Supplementary Figure 3. Names of the gene symbol screened from all the modules and their correlation P values were listed in Supplementary Table 4. The best soft Power selected in this study was 13, and relevant pictures was showed in Supplementary Figure 4.
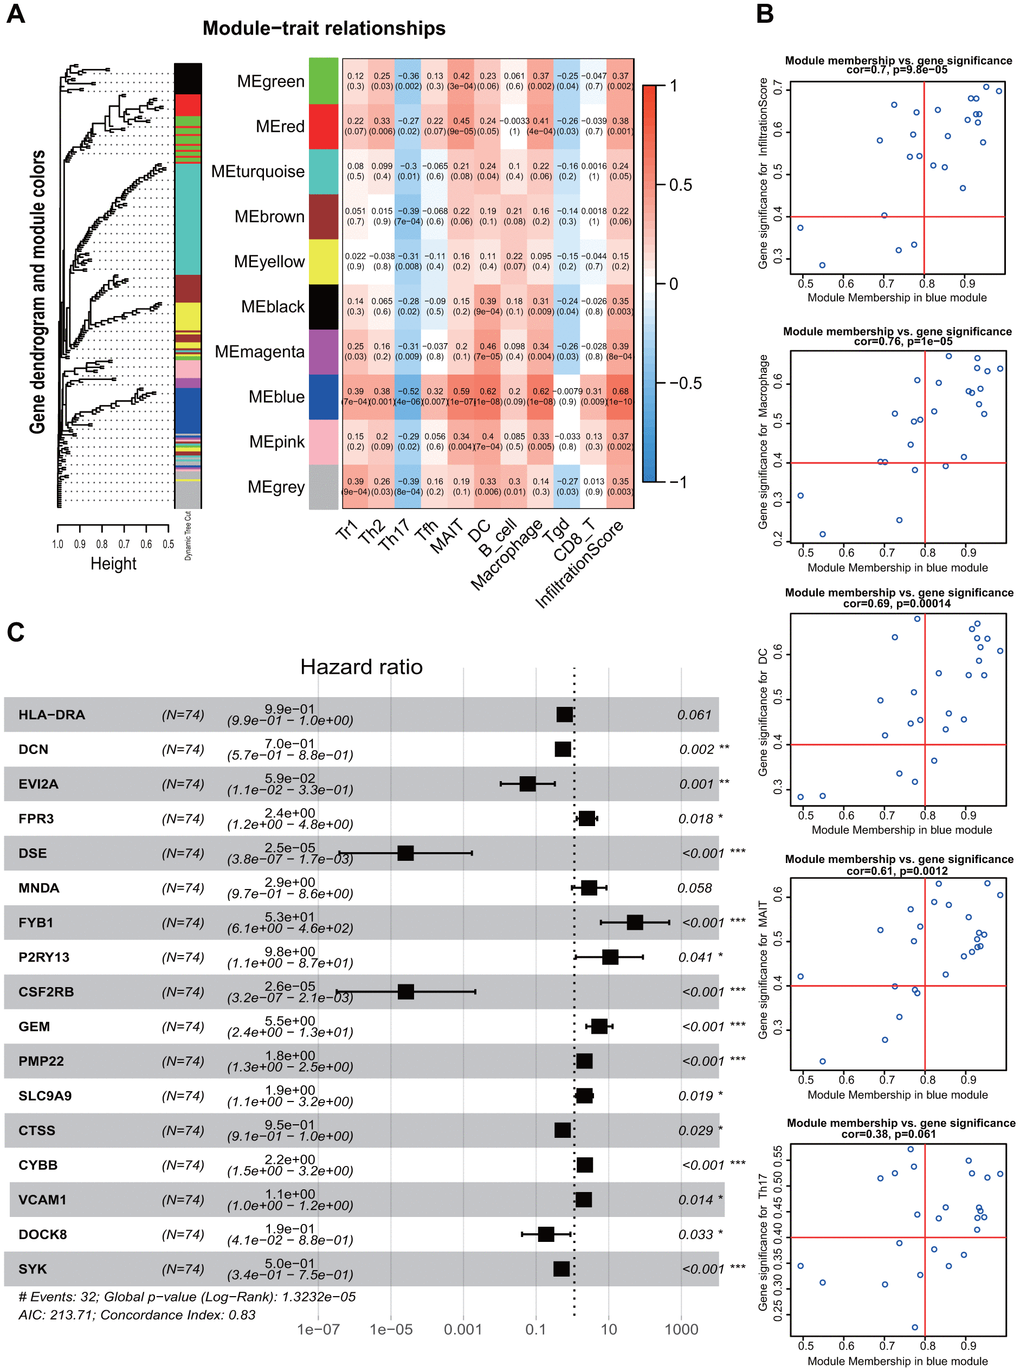
Figure 5. Weighted Gene Co-expression Network Analysis and screening of immune infiltration and prognostic genes. (A) WGCNA modules related to immune infiltrating cells. Different color represented different modules and correlation was displayed by heatmap. (B) Screening of genes associated with immunity and prognosis in the blue module. (C) Forest plot shows multivariate regression results and genes that potentially incorporated into the TMB-IF panel. WGCNA, weighted gene co-expression network analysis; TMB-IF, TMB infiltration. Tr1, type 1 regulatory cells; Th2, Type 2 T helper cells; Th17, Type 17 T helper cells; Tfh, Follicular helper T cells; MAIT, Mucosal-associated invariant T cells; DC, Dendritic cells; Tgd, Gamma-delta T cells.
After selection of the genes with good correlation in WCGNA, multivariate Cox regression were performed to screen variables using both the forward and backward likelihood ratio method. 15 genes with statistical significance were screened out: DCN, EVI2A, FPR3, DSE, FYB1, P2RY13, CSF2RB, GEM, PMP22, SLC9A9, CTSS, CYBB, VCAM1, DOCK8 and SYK (all P < 0.05) (Figure 5C), which constituted the final TMB-IF panel model.
Construction and assessment of TMB-IF for HCC
Patients were segmented to the high- and low- risk groups according to the increased risk score (Figure 6A). Kaplan-Meier survival analysis was re-conducted with the novel panel, and the results showed a good differentiation for patients (P<0.01) (Figure 6B). The formula for calculation was as follows: h(t)= ho(t) exp (-6.7677CSF2RB - 0.0342CTSS + 0.6675CYBB - 0.2761DCN - 0.7192DOCK8 - 7.4889DSE - 2.2454 EVI2A + 0.8198FPR3 + 1.6468FYB1 + 1.2762GEM + 2.2861P2RY13+0.4223PMP22 + 0.2963SLC9A9 - 0.5453SYK + 0.0848VCAM1). To determine the predictive accuracy of the TMB-IF, receiver operating characteristic (ROC) curves was drawn (Figure 6C), which demonstrated that the area under the curve (AUC) was 0.85 for 0.5-year survival, 0.89 for 1-year survival, 0.90 for 1.5-year survival, 0.91 for 3-year survival. In addition, we compared the superiority of the novel TMB-IF with the traditional TNM staging with the threshold of 1.5 years. The results showed that the AUC value of TNM was 0.68, which was much lower than that of TMB-IF (0.90 vs 0.68, Figure 6D).
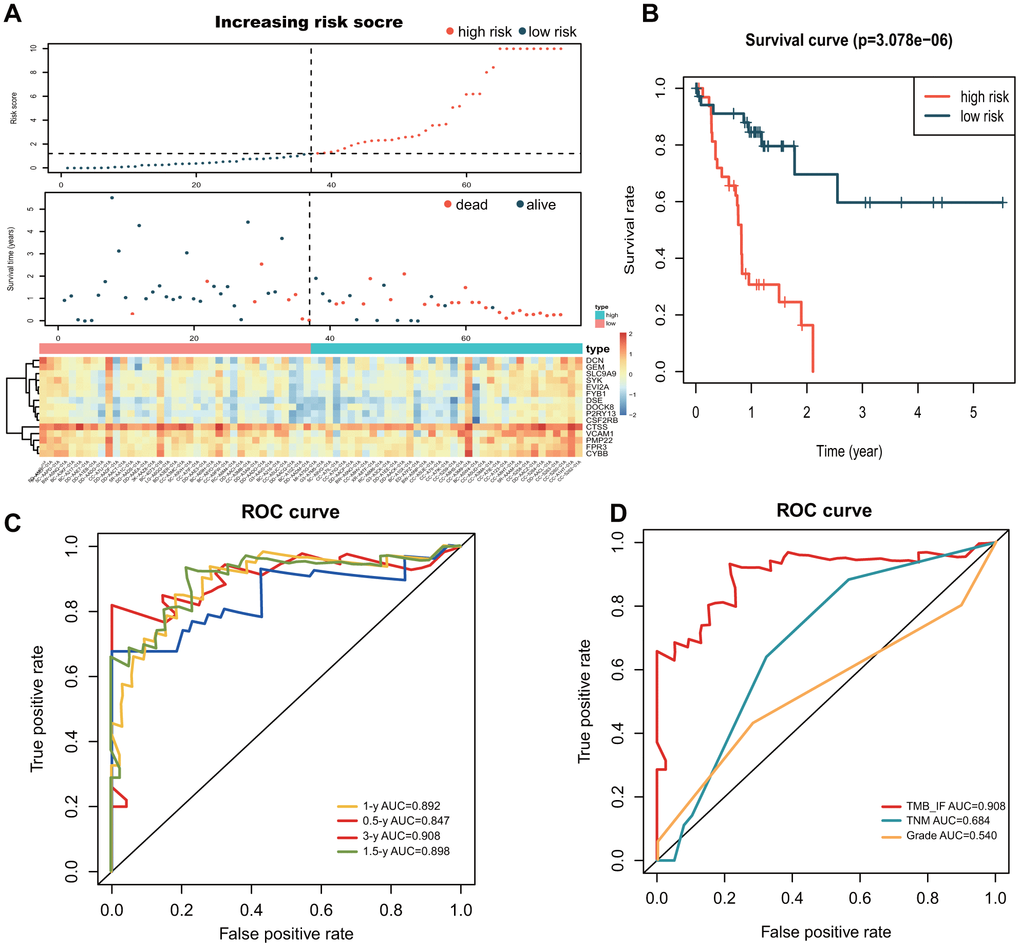
Figure 6. Construction and evaluation of the TMB-IF prognostic panel. (A) Overall distribution of patients identified with the threshold of high and low risk. Screened prognostic genes in the two groups was demonstrated by heatmap. (B) Kaplan–Meier survival analysis and survival curves of high and low risk patients. (C) ROC curve of the prognostic model at 0.5-, 1-, 1.5- and 3-year overall survival. (D) Comparison of TMB-IF with TNM staging and Pathology Grade. ROC, Receiver operating characteristic; TMB, tumor mutational burden; IF, infiltration.
Prognostic nomogram was shown in Figure 7A. Calibration curve for the probability of survival at 1- and 1.5-year showed optimal consistency between the prediction by TMB-IF and actual observations (Figure 7B), with a C-index of 0.785 (95% CI, 0.700–0.870). The calibration curve of 231 patients from ICGC database was shown in Figure 7C, with a C-index of 0.650 (0.553-0.747). To further explore the extensibility of these screened immune genes, we also tried to apply it to the GSE20017 dataset to investigate the vascular invasion in HCC. The ROC curve of GSE20017 showed the AUC value was 0.847 (95%CI, 0.778-0.916) (Figure 7D). The calibration curve was shown in Figure 7E.
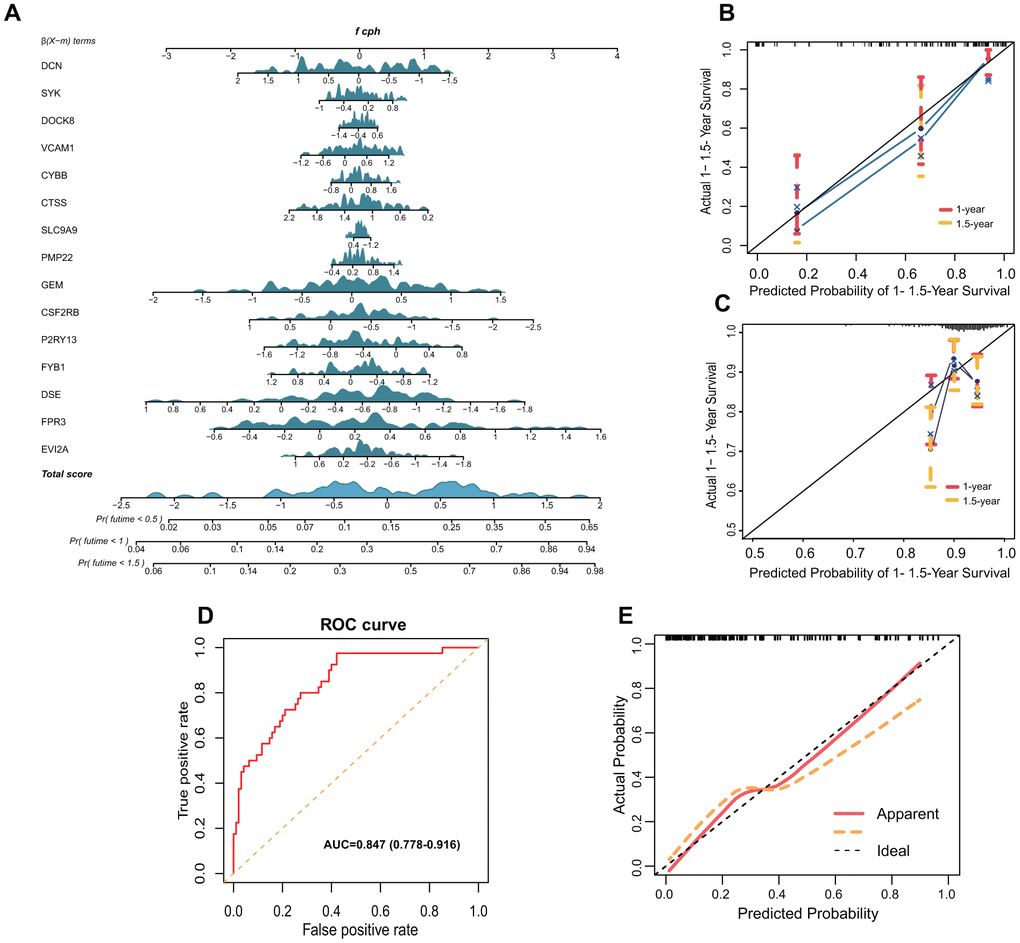
Figure 7. Nomogram and validation of TMB-IF prognostic panel. (A) Nomogram of all genes that presented significance for prognosis. (B) Internal calibration curve of the TMB-IF panel. Red points correspond to the fitting degree of 1-year survival probability, and the orange points correspond to the fitting degree of 1.5-year survival probability. (C) Calibration curve of 203 patients in ICGC database. (D) ROC curve was utilized to evaluate the potential flexibility of TMB-IF in GSE20017. ROC, Receiver operating characteristic. (E) Calibration curve of TMB-IF in predicting tumor vascular invasion.
Discussion
Currently, single-agent PD-1 inhibitors were mainly approved for the second-line treatment of advanced HCC patients with poor response to Sorafenib, which based on two previously reliable clinical studies [5, 24]. Because of the different treatment responses, researchers have been looking for the best biomarkers that can well predict the efficacy of immunotherapy. PD-1/PD-L1 expression level [25], tumor mutation burden (TMB) [13, 26], high microsatellite instability (MSI-H) [27], tumor infiltrating T cell content [28], and neutrophil-lymphocyte ratio (NLR) [29] are currently more widely accepted indicators of response efficacy. Although the predictive value was questioned as well as PD-1/PD-L1 expression level [30], TMB has been proven indeed valuable in predicting the efficacy of immunotherapy by subsequent studies and clinical trials [31].
Although there are few clinical data explaining the role of TMB in HCC, its value can be inferred from other cancer studies. In the clinical study code named CheckMate227, Nivolumab plus low-dose Ipilimumab significantly prolonged the 1-year progression free survival period in advanced non-small cell lung cancer (NSCLC) patients who had TMB≥ 10 mut/MB, regardless of the PD-1 expression level [32]. Meanwhile, CheckMate-568, which was carried out in parallel, verified the conclusion [33]. However, the TMB ≥ 10/MB threshold may not be suitable for HCC. NSCLC ranked second in TMB among all tumors in TCGA database, while HCC ranked 12th. According to the X-tile analysis in this study, the optimal cutoff value of TMB for the two groups of patients was 4.9, which was about half of the threshold of NSCLC. In fact, researchers are trying to circumvent TMB to find ways to enhance the production and expression of neoantigens in tumors, so that patients with lower TMB also can benefit from the immunotherapy [34]. Suggestions proposed now are using the existing chemotherapeutic/targeted agents, radiotherapy, oncological viruses and disrupting endogenous pathways in tumor cells. There is no doubt that these approaches still need further verification.
According to the results of GO enrichment and KEGG analysis of the DEGs in our study, it was noteworthy that the matrix and cell adhesion were involved, including the term of T cell activation that we are concerned with. Recently, osteopontin has been found to regulate the sensitivity of immune cells to PD-1 inhibitors, which was a protein widely distributed in the matrix and cells with function of cell adhesion, signal transduction and tumor metastasis [35]. The colony stimulating factor-1 signaling pathway induced by osteopontin can destroy the transport of tumor-related macrophages and make HCC sensitive to anti-PD-L1 blockade. This suggests that when we pay more attention to the immune cells, perhaps matrix components in the background environment are subtly influencing the immunocyte migration. As for top 10 selected hub genes finally fit into TMB-IF, key genes were identified as FYB, CSF2RB, CTSS, CYBB, VCAM1 and SYK. Cathepsin S silencing (CTSS) has been proved to have a potential role of inducing apoptosis of HCC cells [36]. VCAM1, a gene associated with vascular cellular cytokines molecule, has been suggested that it may endue the growth and infiltration capacity of HCC cells [37]. And spleen tyrosine kinase (SYK), which plays an important role in immune cell signaling pathway, has been reported as a biomarker for HCC and a potential target role for liver fibrosis [38]. However, there is no research on FYB, CSF2RB and CYBB genes in HCC at present. Other component genes of the TMB-IF panel included DCN, DSE, EVI2A, FPR3, P2RY13, GEM, PMP22, SLC9A9 and DOCK8. DCN has been reported to be associated with DNA methylation and hydroxy-methylation in HBV-related HCC [39], and DSE dysregulation may contributed to the malignant behavior of HCC cells through suppression of CCL5 signaling [40]. However, the remaining genes are rarely reported in HCC and still require further basic research.
One of the characteristics of HCC is the rich blood supply and early blood-borne metastasis [41]. To further improve the response of PD-1 inhibitors, it is necessary to understand the mechanism of abnormal PD-1/PD-L1 signaling and immune escape microenvironment. Tumor infiltrating lymphocytes (TILs) are representative components of host anti-tumor immune response [42]. CD3, CD4, CD8 and Foxp3 positive T lymphocytes are the most common subsets of TILs. Among them, tumor infiltration of CD8 positive T cells plays the most important role in host immune defense against tumor progression. In fact, patients in the high TMB group of our study did not showed the up-regulation in cytotoxic T lymphocytes as we expected. Our study demonstrated the infiltration abundance of Th2, Th17 and Tgd increased in the high TMB group, while Tr1, MAIT and DC increased in the low TMB group. Survival analysis showed that patients in the Low-TMB group had better survival outcomes, which was speculated might be related to increased infiltration of DC and MAIT cells through previous studies. More DC cells mean a greater chance of exposure of killer T cells to neoantigens. Another immune cell enriched in the low TMB group were Tr1 cells, which induce and maintain immune tolerance and immune regulatory cells. However, studies have shown that plasmacytoid dendritic cells (pDCs) promote the role of Tr1 cells in tumor immunosuppression in HCC [43], which may interfere with the efficacy of immunotherapy. MAIT cells are naturally equipped with anti-tumor function, but if the function of HCC infiltrated MAIT cells are impaired or recoded, the direction of anti-tumor immunity will be shifted to tumor promotion [44]. In the high TMB group, increased Th2 broke the balance of Th1/Th2, which is one of the poor prognostic factors in HCC patients [45]. And Th17 is a subset of inflammatory T helper cells that has been showed to potentially stimulate the development of HCC [46]. Gamma-delta T cells (Tgd) possess unique characteristics and antigen recognition ability, as well as unique tissue affinity and cytotoxicity, which enable these cells to induce long-lasting immunity in response to different pathological conditions [47]. Therefore, Tgd cells are more likely to play an important role when the immunosuppressive state of HCC broken by PD-1 inhibitors.
A recent study by Shinji Itoh et al. confirmed the presence of vessels that encapsulated the tumor cluster (VETC) was associated with a high positive rate of PD-1 in HCC tissues, successfully established a link of PD-1, tumor vascular and immunotherapy [48]. Therefore, combination of PD-1 inhibitors and anti-angiogenic drugs are expected to significantly improve the response rate of immunotherapy in HCC patients [49]. It is for this reason that we have tried to apply TMB-IF to predict vascular tumor invasion, and the good discrimination was showed. Then, encouraged by the above performance, we further explore the potential application of TMB-IF in the recurrence of early stage of HCC. Although limited by the small sample size, it also can be seen that relapsed patients have higher levels of TMB than those without recurrence, and indeed have more mutations in immune-related genes. Previous studies have confirmed a high rate of recurrence after radiofrequency ablation, with nearly half of people relapsed within 3 years [50]. And recent researches suggested that it was related to a late dynamic of immature NK cells (CD56+) and altered myeloid DC (PD-L1+) [51]. Therefore, it is possible that PD-1/PD-L1 inhibitors will also play a role in preventing early recurrence of HCC. In the coming era of "immunotherapy plus", PD-1 inhibitors may have a broader indication than current clinical studies of advanced HCC, and more researches are needed in the future.
There are some limitations exist in this study: (I) basic experiments are needed to verify the correlation between gene signature and immune cell infiltration; (II) more clinical samples are needed to verify the prognostic effect of TMB-IF and its potential relationship with immune infiltration, vascular invasion and tumor recurrence.
In conclusion, higher TMB was associated with worse survival outcomes. The TMB-IF panel based on tumor mutation burden and immune cell infiltration has demonstrated the stability and scalability of discrimination. Additionally, PD-1 inhibitors may have a wider application in HCC in the future, hoping to reduce the high recurrence rate after radical treatment. The intricate relationship between immune cells, tumor cells and immunotherapy still need to be further investigated.
Materials and Methods
Somatic mutation, transcriptome, microarray data acquisition and pre-processing
Somatic mutation data of 374 LIHC patients were downloaded from the publicly available TCGA database through the GDC data portal (https://portal.gdc.cancer.gov/), corresponding data format was based on the VarScan software platform “Masked Somatic Mutation”. MiRNA expression profiling, clinical data including age, gender, tumor grade, pathological stage, AJCC-TNM stages and survival outcomes were all download for uniqueness matching. Meanwhile, miRNA expression files and related clinical outcome data of 203 HCC patients from Japan were also downloaded from ICGC official website (https://dcc.icgc.org/). In addition, gene expression chip profiles of GSE20017 (n=135) were also derived from the Gene Expression Omnibus (GEO; http://www.ncbi.nlm.nih.gov/geo/). Along with the microarray data, corresponding platforms files "GPL8432" were also downloaded.
Mutation Annotation Format (MAF) of somatic variants downloaded from TCGA were visualized using "maftools" R package. Uniqueness matching with transcriptome data, collating ICGC gene expression profiling and GEO microarray data were all done using the Perl script (Perl version 5.28). TMB was defined as the total number of somatic gene coding errors detected per million bases, including base substitution, insertion, or deletion. Mutation frequency with number of variants/the length of exons (38 million) of 374 HCC patients were all calculated. Patients with well-matched clinical outcomes were subjected to Kaplan-Meier analysis followed by X-tile analysis [52] to determine the best TMB cutoff. Then, according to age, gender and pathology grade, the two groups of high and low TMB were matched by the propensity score matching (PSM) in SPSS software. Finally, the training data set of the panel was selected.
Patients followed-up and samples involved
Eight patients diagnosed with HCC who underwent radiofrequency ablation during November 2017 and August 2018 in the third Affiliated Hospital of Sun Yat-sen University were enrolled. The operation was performed by two attending physicians with more than five years' experience. A total of 8 paired samples of liquid nitrogen quick-frozen HCC tissue that had been histologically and clinically diagnosed were harvested in this current study. Normal liver tissue from 2cm past the tumor edge were collected for controls. Each sample was immediately immersed in liquid nitrogen after isolation and then transferred to -80° C within 30 minutes for later whole-exome sequencing (WES). Prior patients’ consent and approval of the Institutional Research Ethics Committee of the Third Affiliated Hospital were obtained for the regular follow-up. Postoperative tumor status and recurrence will be recorded.
Differentially expressed genes and functional enrichment analysis
According to the results of X-tile analysis and PSM, transcriptome data of 374 HCC patients were divided into high TMB group and low TMB group via R software. "limma" R package was utilized to identify differentially expressed genes (DEGs) between the two groups. To avoid missing potentially important immune-related differential genes, we set the screening criteria at |Fold Change (FC)| >1 and False Discovery Rate (FDR) <0.05, which was also conducive to further weighted gene co-expression network analysis (WGCNA). After screening out DEGs, we used "org.HS.Eg.db", "clusterProfiler", "enrichplot", "ggplot2" packages to implement the Gene Ontology (GO) enrichment analysis of DEGs. Similarly, Kyoto Encyclopedia of Genes and Genomes (KEGG) pathway analysis of the DEGs was also achieved by the above 4 R packages. Preliminary Protein-Protein interaction (PPI) networks between the differential genes were explored by STRING online database (http://string-db.org). Subsequently, the file containing nodes information was imported into Cytoscape software (version 3.6.1) for PPI network plotting. Top 10 nodes ranked by degree were filtered out using CytoHubba plug-in.
ImmuneCellAI and prognostic analysis of immune cells
After comprehensive consideration of TIMER database [53] and CIBERSORT algorithm [54], we further conducted immune cell infiltration analysis in ImmuneCellAI [55], which demonstrated powerful and unique function in tumor immune infiltration estimation and immunotherapy response prediction (http://bioinfo.life.hust.edu.cn/ImmuCellAI/). Transcriptome data from both groups were submitted to ImmuneCellAI, and all original matrices containing infiltrating immune cells information were downloaded. All boxplots were drawn with "ggpubr" R package, and bilateral Wilcoxon rank-sum test and P value were used to compare the differences between the two groups. Then, scores of all immune cells were normalized by percentage, a stack graph was drawn using the "ggplot2" R package. Kaplan-Meier analysis for each type of immune cells showed differences in survival outcomes at different levels of infiltration. R package utilized was "survival", and the log-rank test of P< 0.05 was considered statistically significant.
TMB-IF gene panel generation and verification
Both "LR forward" and "LR backward" were used for variable filtering, and all independent prognostic factors determined by multivariate Cox regression analysis were included to establish the TMB-Infiltration (TMB-IF) panel to investigate the probability of 0.5-, 1- and 1.5- year overall survival (OS). Concordance index (C-index) was calculated to assess the consistency between the actual observations and probability predicted, with bootstrap method of 1000 resamples. Receiver operating characteristic (ROC) curves were performed to compared the identification of TMB-IF predictions of 0.5, 0.5-, 1-, 1.5- and 3- year OS, using the “survivalROC” R package. Then, the 1.5-year OS predictions of TMB-IF and TNM stages were compared, ROC curves were drawn, and AUC values were calculated. The remaining two validation cohorts (ICGC-JP, GSE20017) were used similar approach to validate the model. Nomogram and calibration diagrams involved were drawn using the “rms” R package.
Statistical analysis
Statistical significance of differences among variables with normal distribution was estimated by Student's t-test, while non-normal distribution variables were analyzed by Mann-Whitney U test. Qualitative variables were analyzed by Pearson χ2 test or Fisher’s exact test. Correlation was calculated using Pearson’s and distance correlation analysis. Survival probability was calculated by Kaplan–Meier method, and Log-rank test was used to test the significance of differences in survival curves. Multivariate analysis adopted Cox proportional hazards regression model, and methods of variable filtering were likelihood ratio test of maximum partial likelihood estimation (both forward: LR and backward: LR). Accuracy of survival prediction was evaluated by receiver operating characteristic curve (ROC) analysis and Harrell's concordance index (C-index) analysis. All statistical analyses were performed using R software (version 3.6.2) and SPSS software (version 26.0). Tow-tailed P < 0.05 was considered statistically significant.
Data accessibility
Sample collection, DNA extraction and Whole exome sequencing (WES) of follow-up patients were available in Supplementary Materials and Methods.
All data generated and analyzed during this study are available from public database (see Materials and Methods). The raw Illumina read data for all samples were deposited in the National Center for Biotechnology Information Sequence Read Archive database under the accession number PRJNA632989.
Ethics approval and consent to participate
This study complies with the Declaration of Helsinki. Prior patients’ consent and approval of the Institutional Research Ethics Committee of the Third Affiliated Hospital has been obtained for the use of the clinical materials.
Supplementary Materials
Author Contributions
C.X., L.P. and H.W. participated in the design, conception, and coordination of studies and interpretation of the data. H.W., X.Z. and T.P. prepared the manuscript and participated in the acquisition and interpretation of data. H.W. and X.Z contributed to the revision of the article. X.Y., G.Z., Y.L. and J.L. assisted in the acquisition and interpretation of data and performed the statistical analysis. All authors read and approved the final manuscript.
Acknowledgments
We would like to thank Vecteezy.com for the free license of liver vectorgraph.
Conflicts of Interest
The authors declare that there are no competing interests regarding the publication of this paper.
Funding
This study was supported by grants from the National major science and technology project for the prevention and treatment of AIDS and viral hepatitis [2018ZX10302205-002, 2018ZX10302204], Natural Science Foundation of China [No. 81472259, 81570539 and 81873572]. Youth Program of National Natural Science Foundation of China [81700527]. Natural Science Foundation of Guangdong Province [2014A030313042]. Guangzhou Science and Technology Plan Projects [201904010442], Science and Technology Project of Guangdong Province [2015A020212007], Sun Yat-sen University Clinical Research 5010 Program [2018009], Research project on degree and postgraduate education reform in Guangdong province [2018JGXM04], Young teacher training program of Sun Yat-sen University [16ykpy40], Open project of Key Lab of Tropical Disease Control (Sun Yat-sen University), Ministry of Education [2019kfkt07].
References
- 1. Bray F, Ferlay J, Soerjomataram I, Siegel RL, Torre LA, Jemal A. Global cancer statistics 2018: GLOBOCAN estimates of incidence and mortality worldwide for 36 cancers in 185 countries. CA Cancer J Clin. 2018; 68:394–424. https://doi.org/10.3322/caac.21492 [PubMed]
- 2. Siegel RL, Miller KD, Jemal A. Cancer statistics, 2020. CA Cancer J Clin. 2020; 70:7–30. https://doi.org/10.3322/caac.21590 [PubMed]
- 3. Fujiwara N, Friedman SL, Goossens N, Hoshida Y. Risk factors and prevention of hepatocellular carcinoma in the era of precision medicine. J Hepatol. 2018; 68:526–49. https://doi.org/10.1016/j.jhep.2017.09.016 [PubMed]
- 4. European Association for the Study of the Liver. Electronic address: [email protected], and European Association for the Study of the Liver. EASL clinical practice guidelines: management of hepatocellular carcinoma. J Hepatol. 2018; 69:182–236. https://doi.org/10.1016/j.jhep.2018.03.019 [PubMed]
- 5. El-Khoueiry AB, Sangro B, Yau T, Crocenzi TS, Kudo M, Hsu C, Kim TY, Choo SP, Trojan J, Welling TH
3rd , Meyer T, Kang YK, Yeo W, et al. Nivolumab in patients with advanced hepatocellular carcinoma (CheckMate 040): an open-label, non-comparative, phase 1/2 dose escalation and expansion trial. Lancet. 2017; 389:2492–502. https://doi.org/10.1016/S0140-6736(17)31046-2 [PubMed] - 6. Bandese N. Factors influencing late presentation for health care among men with cancer esophagus attending Hospice Africa Uganda (HAU). Annals of Oncology. 2018; 29:v1. https://doi.org/10.1093/annonc/mdy151
- 7. Hellmann MD, Callahan MK, Awad MM, Calvo E, Ascierto PA, Atmaca A, Rizvi NA, Hirsch FR, Selvaggi G, Szustakowski JD, Sasson A, Golhar R, Vitazka P, et al. Tumor Mutational Burden and Efficacy of Nivolumab Monotherapy and in Combination with Ipilimumab in Small-Cell Lung Cancer. Cancer Cell. 2018; 33:853–861.e4. https://doi.org/10.1016/j.ccell.2018.04.001 [PubMed]
- 8. Alexandrov LB, Nik-Zainal S, Wedge DC, Aparicio SA, Behjati S, Biankin AV, Bignell GR, Bolli N, Borg A, Børresen-Dale AL, Boyault S, Burkhardt B, Butler AP, et al, and Australian Pancreatic Cancer Genome Initiative, and ICGC Breast Cancer Consortium, and ICGC MMML-Seq Consortium, and ICGC PedBrain. Signatures of mutational processes in human cancer. Nature. 2013; 500:415–21. https://doi.org/10.1038/nature12477 [PubMed]
- 9. Samstein RM, Lee CH, Shoushtari AN, Hellmann MD, Shen R, Janjigian YY, Barron DA, Zehir A, Jordan EJ, Omuro A, Kaley TJ, Kendall SM, Motzer RJ, et al. Tumor mutational load predicts survival after immunotherapy across multiple cancer types. Nat Genet. 2019; 51:202–06. https://doi.org/10.1038/s41588-018-0312-8 [PubMed]
- 10. Hellmann MD, Paz-Ares L, Bernabe Caro R, Zurawski B, Kim SW, Carcereny Costa E, Park K, Alexandru A, Lupinacci L, de la Mora Jimenez E, Sakai H, Albert I, Vergnenegre A, et al. Nivolumab plus ipilimumab in advanced non-small-cell lung cancer. N Engl J Med. 2019; 381:2020–31. https://doi.org/10.1056/NEJMoa1910231 [PubMed]
- 11. Carbone DP, Reck M, Paz-Ares L, Creelan B, Horn L, Steins M, Felip E, van den Heuvel MM, Ciuleanu TE, Badin F, Ready N, Hiltermann TJ, Nair S, et al, and CheckMate 026 Investigators. First-line nivolumab in stage IV or recurrent non-small-cell lung cancer. N Engl J Med. 2017; 376:2415–26. https://doi.org/10.1056/NEJMoa1613493 [PubMed]
- 12. Wei SC, Duffy CR, Allison JP. Fundamental mechanisms of immune checkpoint blockade therapy. Cancer Discov. 2018; 8:1069–86. https://doi.org/10.1158/2159-8290.CD-18-0367 [PubMed]
- 13. Yarchoan M, Hopkins A, Jaffee EM. Tumor mutational burden and response rate to PD-1 inhibition. N Engl J Med. 2017; 377:2500–01. https://doi.org/10.1056/NEJMc1713444 [PubMed]
- 14. Wu T, Dai Y. Tumor microenvironment and therapeutic response. Cancer Lett. 2017; 387:61–68. https://doi.org/10.1016/j.canlet.2016.01.043 [PubMed]
- 15. Jiang X, Wang J, Deng X, Xiong F, Ge J, Xiang B, Wu X, Ma J, Zhou M, Li X, Li Y, Li G, Xiong W, et al. Role of the tumor microenvironment in PD-L1/PD-1-mediated tumor immune escape. Mol Cancer. 2019; 18:10. https://doi.org/10.1186/s12943-018-0928-4 [PubMed]
- 16. Kim HD, Song GW, Park S, Jung MK, Kim MH, Kang HJ, Yoo C, Yi K, Kim KH, Eo S, Moon DB, Hong SM, Ju YS, et al. Association Between Expression Level of PD1 by Tumor-Infiltrating CD8+ T Cells and Features of Hepatocellular Carcinoma. Gastroenterology. 2018; 155:1936–1950.e17. https://doi.org/10.1053/j.gastro.2018.08.030 [PubMed]
- 17. Zheng C, Zheng L, Yoo JK, Guo H, Zhang Y, Guo X, Kang B, Hu R, Huang JY, Zhang Q, Liu Z, Dong M, Hu X, et al. Landscape of infiltrating T cells in liver cancer revealed by single-cell sequencing. Cell. 2017; 169:1342–56.e16. https://doi.org/10.1016/j.cell.2017.05.035 [PubMed]
- 18. Xu XF, Xing H, Han J, Li ZL, Lau WY, Zhou YH, Gu WM, Wang H, Chen TH, Zeng YY, Li C, Wu MC, Shen F, Yang T. Risk factors, patterns, and outcomes of late recurrence after liver resection for hepatocellular carcinoma: a multicenter study from China. JAMA Surg. 2019; 154:209–17. https://doi.org/10.1001/jamasurg.2018.4334 [PubMed]
- 19. Pommergaard HC, Rostved AA, Adam R, Thygesen LC, Salizzoni M, Gómez Bravo MA, Cherqui D, Filipponi F, Boudjema K, Mazzaferro V, Soubrane O, García-Valdecasas JC, Prous JF, et al, and European Liver and Intestine Transplant Association (ELITA). Vascular invasion and survival after liver transplantation for hepatocellular carcinoma: a study from the European Liver Transplant Registry. HPB (Oxford). 2018; 20:768–75. https://doi.org/10.1016/j.hpb.2018.03.002 [PubMed]
- 20. Lee S, Kang TW, Song KD, Lee MW, Rhim H, Lim HK, Kim SY, Sinn DH, Kim JM, Kim K, Ha SY. Effect of Microvascular Invasion Risk on Early Recurrence of Hepatocellular Carcinoma After Surgery and Radiofrequency Ablation. Ann Surg. 2019. [Epub ahead of print]. https://doi.org/10.1097/SLA.0000000000003268 [PubMed]
- 21. Erstad DJ, Tanabe KK. Prognostic and therapeutic implications of microvascular invasion in hepatocellular carcinoma. Ann Surg Oncol. 2019; 26:1474–93. https://doi.org/10.1245/s10434-019-07227-9 [PubMed]
- 22. Vitale A, Peck-Radosavljevic M, Giannini EG, Vibert E, Sieghart W, Van Poucke S, Pawlik TM. Personalized treatment of patients with very early hepatocellular carcinoma. J Hepatol. 2017; 66:412–23. https://doi.org/10.1016/j.jhep.2016.09.012 [PubMed]
- 23. Tabrizian P, Jibara G, Shrager B, Schwartz M, Roayaie S. Recurrence of hepatocellular cancer after resection: patterns, treatments, and prognosis. Ann Surg. 2015; 261:947–55. https://doi.org/10.1097/SLA.0000000000000710 [PubMed]
- 24. Finn RS, Ryoo BY, Merle P, Kudo M, Bouattour M, Lim HY, Breder V, Edeline J, Chao Y, Ogasawara S, Yau T, Garrido M, Chan SL, et al, and KEYNOTE-240 investigators. Pembrolizumab as second-line therapy in patients with advanced hepatocellular carcinoma in KEYNOTE-240: a randomized, double-blind, phase III trial. J Clin Oncol. 2020; 38:193–202. https://doi.org/10.1200/JCO.19.01307 [PubMed]
- 25. Balar AV, Castellano D, O’Donnell PH, Grivas P, Vuky J, Powles T, Plimack ER, Hahn NM, de Wit R, Pang L, Savage MJ, Perini RF, Keefe SM, et al. First-line pembrolizumab in cisplatin-ineligible patients with locally advanced and unresectable or metastatic urothelial cancer (KEYNOTE-052): a multicentre, single-arm, phase 2 study. Lancet Oncol. 2017; 18:1483–92. https://doi.org/10.1016/S1470-2045(17)30616-2 [PubMed]
- 26. Chalmers ZR, Connelly CF, Fabrizio D, Gay L, Ali SM, Ennis R, Schrock A, Campbell B, Shlien A, Chmielecki J, Huang F, He Y, Sun J, et al. Analysis of 100,000 human cancer genomes reveals the landscape of tumor mutational burden. Genome Med. 2017; 9:34. https://doi.org/10.1186/s13073-017-0424-2 [PubMed]
- 27. Luchini C, Bibeau F, Ligtenberg MJ, Singh N, Nottegar A, Bosse T, Miller R, Riaz N, Douillard JY, Andre F, Scarpa A. ESMO recommendations on microsatellite instability testing for immunotherapy in cancer, and its relationship with PD-1/PD-L1 expression and tumour mutational burden: a systematic review-based approach. Ann Oncol. 2019; 30:1232–43. https://doi.org/10.1093/annonc/mdz116 [PubMed]
- 28. Sun R, Limkin EJ, Vakalopoulou M, Dercle L, Champiat S, Han SR, Verlingue L, Brandao D, Lancia A, Ammari S, Hollebecque A, Scoazec JY, Marabelle A, et al. A radiomics approach to assess tumour-infiltrating CD8 cells and response to anti-PD-1 or anti-PD-L1 immunotherapy: an imaging biomarker, retrospective multicohort study. Lancet Oncol. 2018; 19:1180–91. https://doi.org/10.1016/S1470-2045(18)30413-3 [PubMed]
- 29. Capone M, Giannarelli D, Mallardo D, Madonna G, Festino L, Grimaldi AM, Vanella V, Simeone E, Paone M, Palmieri G, Cavalcanti E, Caracò C, Ascierto PA. Baseline neutrophil-to-lymphocyte ratio (NLR) and derived NLR could predict overall survival in patients with advanced melanoma treated with nivolumab. J Immunother Cancer. 2018; 6:74. https://doi.org/10.1186/s40425-018-0383-1 [PubMed]
- 30. Mauriello A, Zeuli R, Cavalluzzo B, Petrizzo A, Tornesello ML, Buonaguro FM, Ceccarelli M, Tagliamonte M, Buonaguro L. High somatic mutation and neoantigen burden do not correlate with decreased progression-free survival in HCC patients not undergoing immunotherapy. Cancers (Basel). 2019; 11:1824. https://doi.org/10.3390/cancers11121824 [PubMed]
- 31. Chan TA, Yarchoan M, Jaffee E, Swanton C, Quezada SA, Stenzinger A, Peters S. Development of tumor mutation burden as an immunotherapy biomarker: utility for the oncology clinic. Ann Oncol. 2019; 30:44–56. https://doi.org/10.1093/annonc/mdy495 [PubMed]
- 32. Hellmann MD, Ciuleanu TE, Pluzanski A, Lee JS, Otterson GA, Audigier-Valette C, Minenza E, Linardou H, Burgers S, Salman P, Borghaei H, Ramalingam SS, Brahmer J, et al. Nivolumab plus ipilimumab in lung cancer with a high tumor mutational burden. N Engl J Med. 2018; 378:2093–104. https://doi.org/10.1056/NEJMoa1801946 [PubMed]
- 33. Ready N, Hellmann MD, Awad MM, Otterson GA, Gutierrez M, Gainor JF, Borghaei H, Jolivet J, Horn L, Mates M, Brahmer J, Rabinowitz I, Reddy PS, et al. First-line nivolumab plus ipilimumab in advanced non-small-cell lung cancer (CheckMate 568): outcomes by programmed death ligand 1 and tumor mutational burden as biomarkers. J Clin Oncol. 2019; 37:992–1000. https://doi.org/10.1200/JCO.18.01042 [PubMed]
- 34. Lu L, Jiang J, Zhan M, Zhang H, Wang QT, Sun SN, Guo XK, Yin H, Wei Y, Liu JO, Li SY, Li Y, He YW. Targeting neoantigens in hepatocellular carcinoma for immunotherapy: a futile strategy? Hepatology. 2020. [Epub ahead of print]. https://doi.org/10.1002/hep.31279 [PubMed]
- 35. Zhu Y, Yang J, Xu D, Gao XM, Zhang Z, Hsu JL, Li CW, Lim SO, Sheng YY, Zhang Y, Li JH, Luo Q, Zheng Y, et al. Disruption of tumour-associated macrophage trafficking by the osteopontin-induced colony-stimulating factor-1 signalling sensitises hepatocellular carcinoma to anti-PD-L1 blockade. Gut. 2019; 68:1653–1666. https://doi.org/10.1136/gutjnl-2019-318419 [PubMed]
- 36. Wang X, Xiong L, Yu G, Li D, Peng T, Luo D, Xu J. Cathepsin S silencing induces apoptosis of human hepatocellular carcinoma cells. Am J Transl Res. 2015; 7:100–10. [PubMed]
- 37. Huang J, Deng Q, Wang Q, Li KY, Dai JH, Li N, Zhu ZD, Zhou B, Liu XY, Liu RF, Fei QL, Chen H, Cai B, et al. Exome sequencing of hepatitis B virus-associated hepatocellular carcinoma. Nat Genet. 2012; 44:1117–21. https://doi.org/10.1038/ng.2391 [PubMed]
- 38. Qu C, Zheng D, Li S, Liu Y, Lidofsky A, Holmes JA, Chen J, He L, Wei L, Liao Y, Yuan H, Jin Q, Lin Z, et al. Tyrosine kinase SYK is a potential therapeutic target for liver fibrosis. Hepatology. 2018; 68:1125–39. https://doi.org/10.1002/hep.29881 [PubMed]
- 39. Ye C, Tao R, Cao Q, Zhu D, Wang Y, Wang J, Lu J, Chen E, Li L. Whole-genome DNA methylation and hydroxymethylation profiling for HBV-related hepatocellular carcinoma. Int J Oncol. 2016; 49:589–602. https://doi.org/10.3892/ijo.2016.3535 [PubMed]
- 40. Liao WC, Yen HR, Liao CK, Tseng TJ, Lan CT, Liu CH. DSE regulates the malignant characters of hepatocellular carcinoma cells by modulating CCL5/CCR1 axis. Am J Cancer Res. 2019; 9:347–62. [PubMed]
- 41. Llovet JM, Zucman-Rossi J, Pikarsky E, Sangro B, Schwartz M, Sherman M, Gores G. Hepatocellular carcinoma. Nat Rev Dis Primers. 2016; 2:16018. https://doi.org/10.1038/nrdp.2016.18 [PubMed]
- 42. Lu C, Rong D, Zhang B, Zheng W, Wang X, Chen Z, Tang W. Current perspectives on the immunosuppressive tumor microenvironment in hepatocellular carcinoma: challenges and opportunities. Mol Cancer. 2019; 18:130. https://doi.org/10.1186/s12943-019-1047-6 [PubMed]
- 43. Pedroza-Gonzalez A, Zhou G, Vargas-Mendez E, Boor PP, Mancham S, Verhoef C, Polak WG, Grünhagen D, Pan Q, Janssen H, Garcia-Romo GS, Biermann K, Tjwa ET, et al. Tumor-infiltrating plasmacytoid dendritic cells promote immunosuppression by Tr1 cells in human liver tumors. Oncoimmunology. 2015; 4:e1008355. https://doi.org/10.1080/2162402X.2015.1008355 [PubMed]
- 44. Duan M, Goswami S, Shi JY, Wu LJ, Wang XY, Ma JQ, Zhang Z, Shi Y, Ma LJ, Zhang S, Xi RB, Cao Y, Zhou J, et al. Activated and exhausted MAIT cells foster disease progression and indicate poor outcome in hepatocellular carcinoma. Clin Cancer Res. 2019; 25:3304–16. https://doi.org/10.1158/1078-0432.CCR-18-3040 [PubMed]
- 45. Lee HL, Jang JW, Lee SW, Yoo SH, Kwon JH, Nam SW, Bae SH, Choi JY, Han NI, Yoon SK. Inflammatory cytokines and change of Th1/Th2 balance as prognostic indicators for hepatocellular carcinoma in patients treated with transarterial chemoembolization. Sci Rep. 2019; 9:3260. https://doi.org/10.1038/s41598-019-40078-8 [PubMed]
- 46. Yang YM, Kim SY, Seki E. Inflammation and liver cancer: molecular mechanisms and therapeutic targets. Semin Liver Dis. 2019; 39:26–42. https://doi.org/10.1055/s-0038-1676806 [PubMed]
- 47. Lawand M, Déchanet-Merville J, Dieu-Nosjean MC. Key features of gamma-delta T-cell subsets in human diseases and their immunotherapeutic implications. Front Immunol. 2017; 8:761. https://doi.org/10.3389/fimmu.2017.00761 [PubMed]
- 48. Itoh S, Yoshizumi T, Yugawa K, Imai D, Yoshiya S, Takeishi K, Toshima T, Harada N, Ikegami T, Soejima Y, Kohashi K, Oda Y, Mori M. Impact of immune response on outcomes in hepatocellular carcinoma: association with vascular formation. Hepatology. 2020; 72:1987–99. https://doi.org/10.1002/hep.31206 [PubMed]
- 49. Khemlina G, Ikeda S, Kurzrock R. The biology of hepatocellular carcinoma: implications for genomic and immune therapies. Mol Cancer. 2017; 16:149. https://doi.org/10.1186/s12943-017-0712-x [PubMed]
- 50. Huang J, Yan L, Cheng Z, Wu H, Du L, Wang J, Xu Y, Zeng Y. A randomized trial comparing radiofrequency ablation and surgical resection for HCC conforming to the Milan criteria. Ann Surg. 2010; 252:903–12. https://doi.org/10.1097/SLA.0b013e3181efc656 [PubMed]
- 51. Rochigneux P, Nault JC, Mallet F, Chretien AS, Barget N, Garcia AJ, Del Pozo L, Bourcier V, Blaise L, Grando-Lemaire V, N’Kontchou G, Nahon P, Seror O, et al. Dynamic of systemic immunity and its impact on tumor recurrence after radiofrequency ablation of hepatocellular carcinoma. Oncoimmunology. 2019; 8:1615818. https://doi.org/10.1080/2162402X.2019.1615818 [PubMed]
- 52. Camp RL, Dolled-Filhart M, Rimm DL. X-tile: a new bio-informatics tool for biomarker assessment and outcome-based cut-point optimization. Clin Cancer Res. 2004; 10:7252–59. https://doi.org/10.1158/1078-0432.CCR-04-0713 [PubMed]
- 53. Li T, Fan J, Wang B, Traugh N, Chen Q, Liu JS, Li B, Liu XS. TIMER: a web server for comprehensive analysis of tumor-infiltrating immune cells. Cancer Res. 2017; 77:e108–10. https://doi.org/10.1158/0008-5472.CAN-17-0307 [PubMed]
- 54. Newman AM, Liu CL, Green MR, Gentles AJ, Feng W, Xu Y, Hoang CD, Diehn M, Alizadeh AA. Robust enumeration of cell subsets from tissue expression profiles. Nat Methods. 2015; 12:453–57. https://doi.org/10.1038/nmeth.3337 [PubMed]
- 55. Miao YR, Zhang Q, Lei Q, Luo M, Xie GY, Wang H, Guo AY. ImmuCellAI: a unique method for comprehensive T-cell subsets abundance prediction and its application in cancer immunotherapy. Adv Sci (Weinh). 2020; 7:1902880. https://doi.org/10.1002/advs.201902880 [PubMed]