


Introduction
Triple-negative breast cancer (TNBC) is a special subtype of breast cancer that lacks the expression of ER (estrogen receptor), PR (progesterone receptor), and HER2 (human epidermal growth factor receptor 2). TNBC is characterized by high aggression and invasiveness that exhibit the most malignant biological behavior and the worst clinical outcome [1]. For the treatment of TNBC, neither endocrine therapy nor targeted therapy for HER2 could be applied in clinical practice [2]. Traditional therapeutic methods like surgery and systemic chemotherapy are still the first-line treatment for TNBC. Therefore, it is urgent to understand the biological and immunological profiles of TNBC to develop novel effective therapeutic strategies.
According to genome-wide expression profile, TNBC has been classified into six distinct molecular subtypes, including basal-like 1 (BL1), basal-like 2 (BL2), luminal androgen receptor (LAR), immunomodulatory (IM), mesenchymal (M), and mesenchymal stem-like (MSL) groups [3]. Besides, Burstein et al. identified four TNBC subgroups based on multi-omics genomic profiling, which clustered into Luminal/Androgen Receptor, Mesenchymal, Basal-Like Immune Suppressed, and Basal-Like Immune Activated groups [4]. Bareche et al. observed a higher expression level of immune signatures and checkpoint inhibitor genes in the IM subtype, which implied a better prognosis [5]. These efforts indicated that the heterogeneous immune profile in tumor microenvironment, and immunotherapies might be practical in some specific subtypes of TNBC.
Close attention has been given to the progression of immunotherapy in TNBC. Several immune-checkpoint inhibitors, including anti-cytotoxic T-lymphocyte-associated protein 4 (anti-CTLA-4), anti-programmed death-1 (anti-PD1), and anti-PD1 ligand (anti-PD-L1) monoclonal antibodies have been applied for selected advanced TNBC, which present favorable prognostic value in clinical trials [6–9]. The cooperation between tumor cells and extracellular microenvironment has been proved as an important indicator for therapeutic response and prognosis of TNBC [10–14]. Increasing evidence showed that the interaction between hypoxia and immune status in tumor microenvironment promotes the proliferation, migration, and invasion of TNBC [15–18].
Hypoxia is an intrinsic feature of solid tumors due to the imbalance between the proliferation rate of tumor cells and insufficient nutrient supply of vascular [19]. Increasing studies have recognized the important roles played by hypoxia in driving tumor immune suppression and immune escape. For instance, hypoxia increases the expression level of immunosuppressive cytokines (e.g., PD-1) and suppressive cells [e.g., regulatory T cells (Tregs) and myeloid-derived suppressor cells (MDSCs)], which in turn impede immune effector cells and induce immune escape [16]. Moreover, hypoxia triggers the IL-1β/IL1R1 signaling that leads to proliferative and invasive response of TNBC cells and promotes an aggressive feature of cancer-associated fibroblasts (CAFs) in TNBC [20]. Given that the interdependence between hypoxia and immune status in tumor microenvironment might affect the immune activity, therapeutic response and prognosis in TNBC, a comprehensive analysis of hypoxia and immune status might have promising prognostic value, and offer additional introspection and improvement for transformation studies and therapeutic decisions in TNBC.
In this study, by performing a comprehensive bioinformatics analysis based on cross-public datasets, we aimed to establish and substantiate a combined hypoxia and immune-related gene signature to predict prognosis, risk stratification, and therapeutic response in TNBC patients.
Materials and Methods
Data acquisition and preparation
The Schematic diagram is depicted in Figure 1. TNBC patients with clinical features and survival data across different platforms were enrolled in this study. The microarray dataset GSE58812 (N = 107) were downloaded from GEO (http://www.ncbi.nlm.nih.gov/geo/) [21], the normalized RNA-Seq data of 142 TNBC samples were procured from The Cancer Genome Atlas (TCGA) (https://portal.gdc.cancer.gov/repository), and the expression profiles of the Molecular Taxonomy of Breast Cancer International Consortium (METABRIC) TNBC dataset (N = 221) was obtained from cBioportal (http://www.cbioportal.org/) [22].
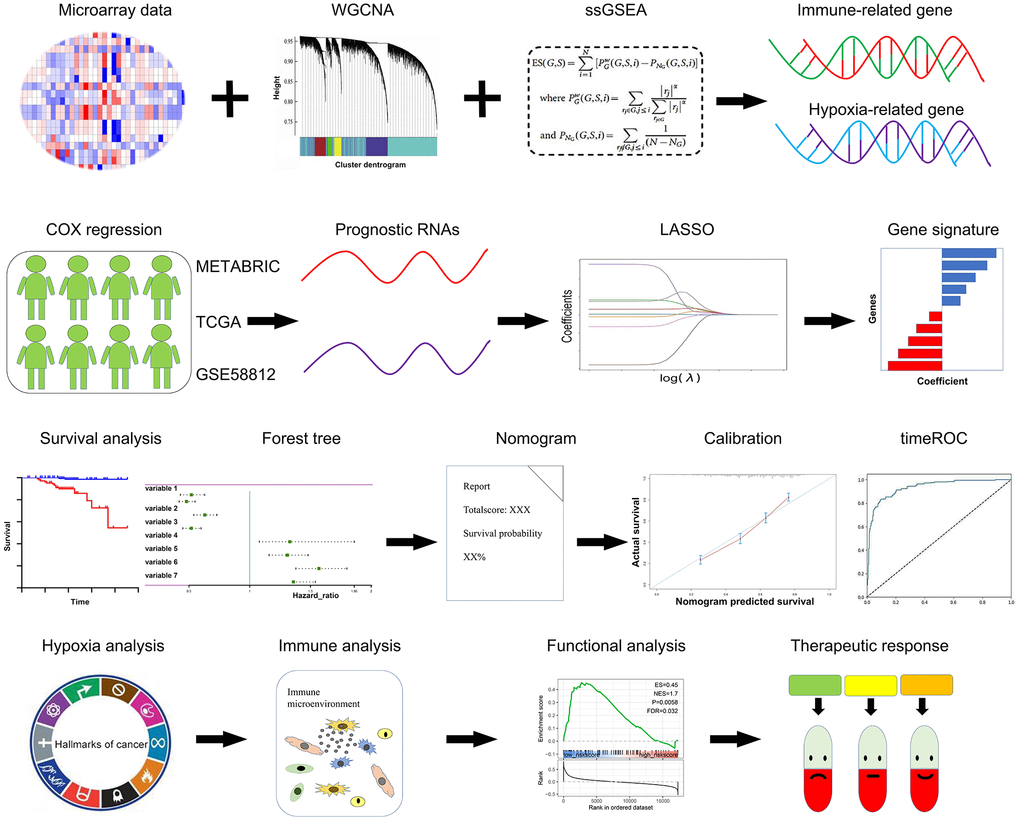
Figure 1. Schematic diagram of this study. A panel of prognostic hypoxia-related and immune-related genes were determined from the METABRIC, TCGA, and GSE58812 datasets. A comprehensive hypoxia and immune related genes were constituted using the LASSO regression model. The prognostic value, hypoxia and immune status, and therapeutic response were further validated in multiple cohorts.
R package ‘limma’ was applied for gene expression normalization [23]. All transcriptomic data contained in this study were normalized. This study strictly followed the acquirement procedures of the METABRIC, TCGA, and GEO datasets. This research also complied with the instruction of the Declaration of Helsinki.
Identification of the immune status and immune-associated genes
For the IRGs, 22 immune signatures were measured for their enrichment levels in respective TNBC cases by ssGSEA score [26, 27]. Patients were hierarchically clustered into three groups (high, median and low immune group) based on the ssGSEA score. Differential Expression Genes (DEGs) between high and low immune groups were identified by the “limma” package. Furthermore, genes with |log2 value (FC)| >1 and p < 0.05 after adjusting for FDR were considered as the immune-related DEGs. Finally, 1793 DEGs were identified from the above analyses.
Tumor microenvironment analysis
CIBERSORT was performed to analyze the divergent immunocyte infiltrating proportion between low-risk and high-risk groups in conformity with LM22 signatures with 1000 permutations [30]. The immune-related efficiency and fibroblasts were estimated using the ‘MCPcounter’ package [31]. immune and stromal components which reflect by immune and stromal scores were estimated using the ‘estimate’ package [32]. Moreover, the expression of key hypoxia and immune profiles between different risk groups were analyzed.
Functional study and therapeutic response
Gene set enrichment analysis (GSEA) [33] was performed to investigate the signaling enrichment between different risk groups using prognosis index with Clusterprofile package. The FDR q < 0.25 and P < 0.05 was considered statistical significance. 107 patients with survival information from GSE103091 cohort were obtained to validate the indicative significance of the hypoxia and immune gene signature. The data from GSE18864 and GSE90505 cohorts were obtained to analyze the indicative role of the hypoxia and immune gene signature for therapeutic response. Furthermore, a webtool GSCALite was applied to analyze the relationship between the expression profile of hypoxia-immune gene signature and IC50 data of different molecules in breast cancer cell lines [34].
Statistical analysis
The cross-cohort prognostic HRGs and IRGs were identified by Univariate Cox regression with a cutoff value of P < 0.1. Vital prognostic hypoxia and immune related genes were selected by the LASSO regression model. Multivariate Cox regression including HIRS and clinical characteristics was performed using the ‘survival’ package. The survival of different risk groups was evaluated using the Kaplan–Meier survival analysis with the log-rank test. A nomogram was plotted using the R package ‘rms’ to predict the prognosis for individual patients [35]. Time-dependent receiver operator characteristic (ROC) analyses were conducted to measure the predictive power of the nomogram using the ‘time-ROC’ package [36], and the areas under the curve (AUC) of all variables were compared. The divergence between immune cell fragments was estimated by the Wilcoxon test. HIRS-related analysis was estimated by Spearman’s correlation test. Statistical analyses were applied using R software (Version 4.0.4). A two-tailed P < 0.05 was considered statistical significance.
Data availability statement
This study is based on public datasets, which obtained from the Cancer Genome Atlas Program (TCGA), the cBio Cancer Genomics Portal (cBioportal), and Gene Expression Omnibus (GEO).
Results
Identification of gene signature related to hypoxia in TNBC
Based on the ssGSEA method and cancer hallmarks from MsigDB dataset, we calculated the hypoxia ssGSEA Zscore of TNBC patients from the METABRIC dataset (Figure 2A). Then, with transcriptomic profiles and hypoxia ssGSEA Z-scores in the METABRIC dataset, WGCNA was applied to screen for hypoxia related candidates (Figure 2B). the optimal soft threshold was determined with a power of β = 4 (Figure 2C), 47 modules were established (Figure 2D), and the pink module showed the highest correlated with hypoxia (Figure 2E), 840 promising candidates were identified from the pink model. Finally, 788 promising candidates related to hypoxia were screened in the three datasets (Figure 2F).
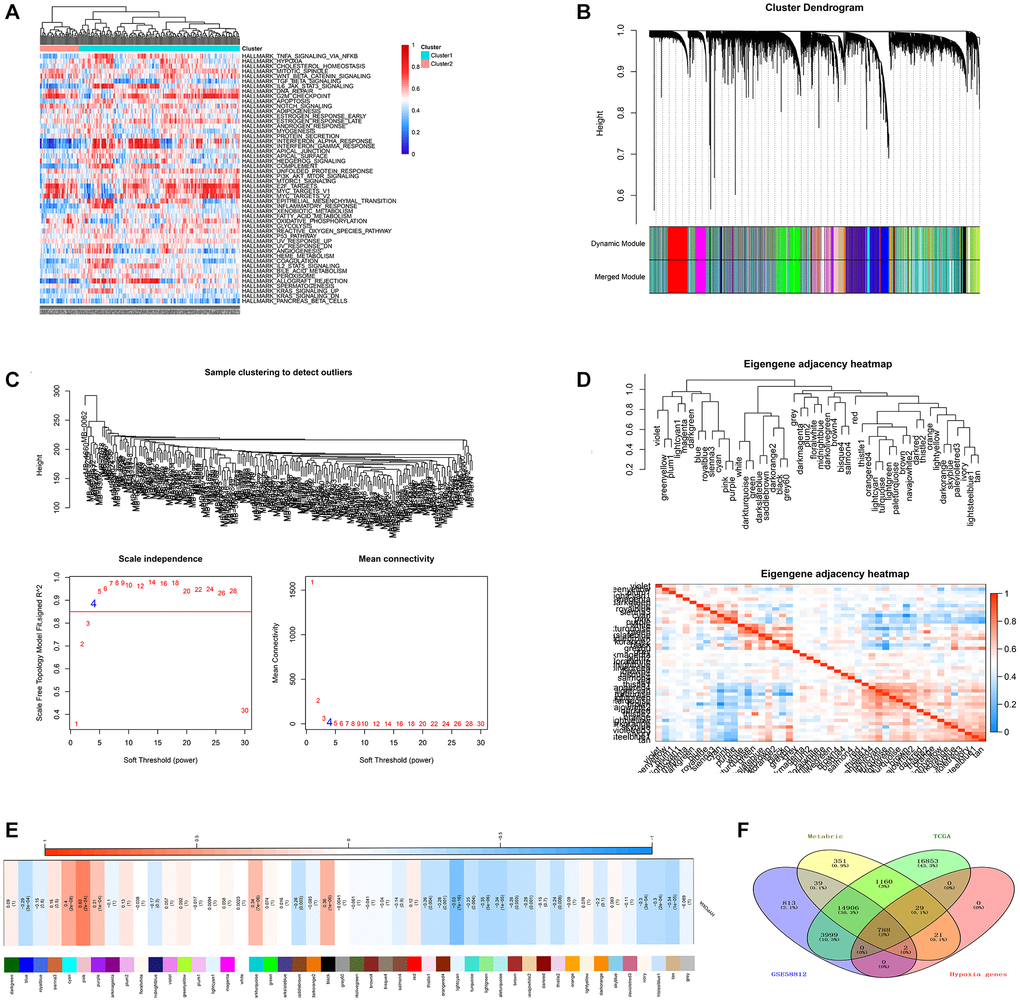
Figure 2. Identification of potential HRGs in TNBC. (A) Hypoxia ssGSEA scores were estimated in the METABRIC cohort. (B) WGCNA was applied with whole-transcriptome profiling data and hypoxia ssGSEA Z-scores. (C) The optimal soft threshold to confirm a scale free co-expression network. (D) A total of 47 non-grey modules were identified. (E) The pink module depicted the highest correlation (r = 0.64, p = 2e−24) with hypoxia. (F) Venn diagram suggested 788 hypoxia related genes in the three cohorts.
Identification of gene signature related to immune in TNBC
Based on the ssGSEA scores that specified the abundance and efficacy of immune cell fractions, TNBC samples in the METABRIC cohort were hierarchically assembled in immune-high, -median and -low groups, which displayed distinct abundance and efficacy of immunocytes (Figure 3A). Then, immune-related DEGs were obtained via comparing gene expression in the immune-low group with those in the immune-high group (Figure 3B), 1793 promising candidates were identified and 1175 cross-cohort IRGs were extracted in the three datasets (Figure 3C).
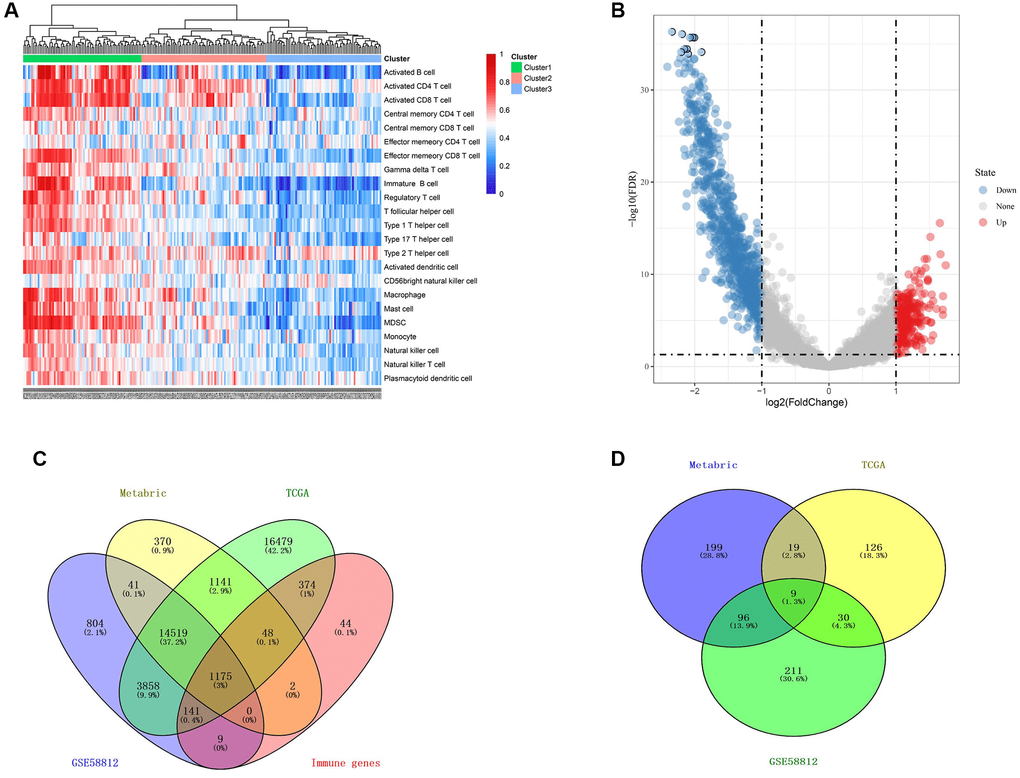
Figure 3. Identification of gene signature related to immune in TNBC. (A) immune related ssGSEA scores were estimated in the METABRIC cohort. (B) volcano plot demonstrated distinctive expressed immune-related genes between immune low and immune high groups (C) Venn diagram suggested 1175 immune related genes in the three cohorts. (D) Venn diagram suggested 9 prognostic hypoxia and immune related genes in the three cohorts.
Construction of a hypoxia and immune-related gene signature for predicting prognosis
Based on the available 788 HRGs and 1175 IRGs, 9 cross-cohort prognostic genes were classified by performing the univariate Cox regression analysis (Figure 3D). Then, LASSO regression model was applied to select the most valuable markers for survival (Figure 4A). With the optimal log λ value of –3.36 generated, an ensemble of 6 genes (SERPINE1, IL2RG, CXCL11, CXCL13, LRSAM1, TAPBPL) remained with their distinctive LASSO coefficients (Figure 4B and Supplementary Table 1). Then, the selected genes were exerted to the formula above and HIRS was calculated in all cohorts. Spearman’s correlation test implied that HIRS was notably associated the selected genes (Figure 4C and Supplementary Figure 1A–1B).
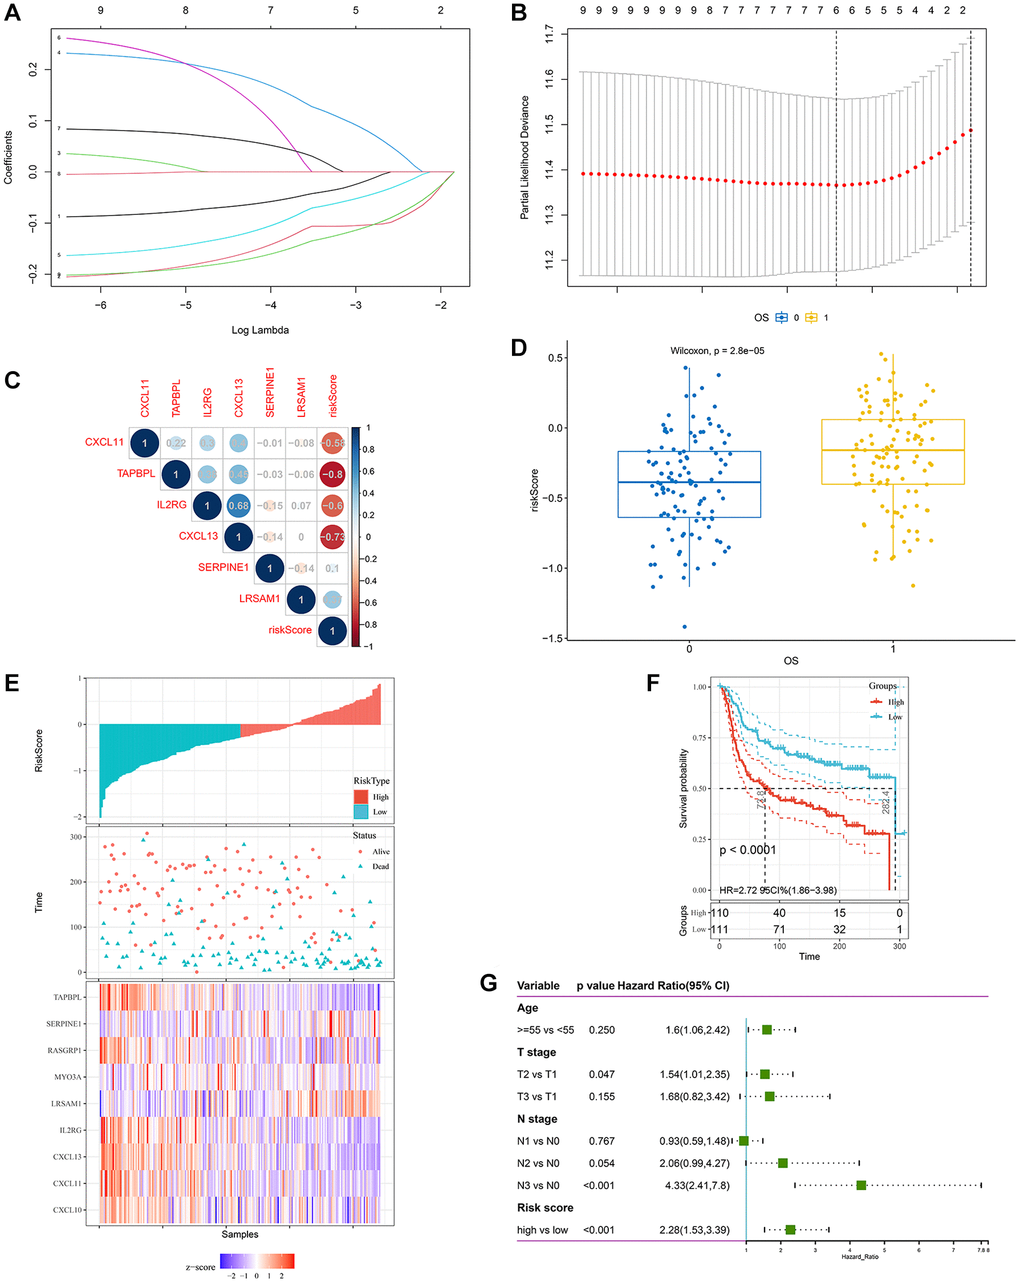
Figure 4. Construction of a hypoxia and immune-related gene signature for prognosis. (A, B) The LASSO coefficient profiles were constructed from 9 prognostic hypoxia and immune-related genes, and the tuning parameter (λ) was calculated based on the minimum criteria for OS with ten-fold cross validation. Six genes were selected according to the best fit profile. (C) Correlation between risk score and the selected 6 genes in the METABRIC cohort. (D) HIRS was remarkably increased in patients who died during follow-up. (E–F) Distributions of risk score, expression profile, and survival status of the gene signature. (G) Multivariate Cox regression model showed that HIRS as an independent risk factor for OS in the METABRIC cohort.
HIRS serves as a risk factor for prognosis in TNBC patients
Compared with alive patients, HIRS was remarkably increased in patients who dead during follow up in all datasets (Figure 4D and Supplementary Figure 1C–1D). Furthermore, worse prognosis has been exhibited in patients with higher HIRS than those with lower HIRS (Figure 4E–4F and Supplementary Figure 2A–2D). Among different clinicopathological parameters, multivariate Cox regression model showed that HIRS (HR = 2.28, p < 0.001) also as an independent risk factor for OSin the METABRIC cohort (Figure 4G). To validate the prognostic value of HIRS in external samples, it was further validated in the GSE103091 cohort. HIRS was remarkably increased in metastatic and dead patients (Supplementary Figure 3A, 3D). Distributions of risk score, expression profile, and survival status and of signature genes showed that patients with higher HIRS predicted worse MFS and OS than lower HIRS patients (Supplementary Figure 3B, 3C and 3E, 3F).
Then, a nomogram was constructed based on HIRS and other clinicopathological parameters in the METABRIC dataset to predict the survival for individual patients. As shown in Figure 5A, HIRS was an important predictor of OS in the visual model. Moreover, tROC and AUC were performed according to data availability (Figure 5B–5D and Supplementary Figure 4D–4F), the prediction accuracy of the nomogram for survival probability implied a promising predictive value of HIRS in the calibration analysis (Figure 5E and Supplementary Figure 4A–4C). Moreover, we analyzed the prediction accuracy of the nomogram in the GSE103091 cohort, the AUC values of the nomogram to predict 1-, 3- and 5-year MFS was 0.854, 0.759 and 0.711, respectively (Supplementary Figure 7A). The AUC values of the nomogram to predict 1-, 3- and 5-year OS was 0.860, 0.754 and 0.707, respectively (Supplementary Figure 7E). The calibration curves suggested that the nomogram-based predictive outcome had good consistency with the actual prognosis results (Supplementary Figure 7). The results revealed that the HIRS could be a promising marker for predicting clinical outcome in TNBC patients.
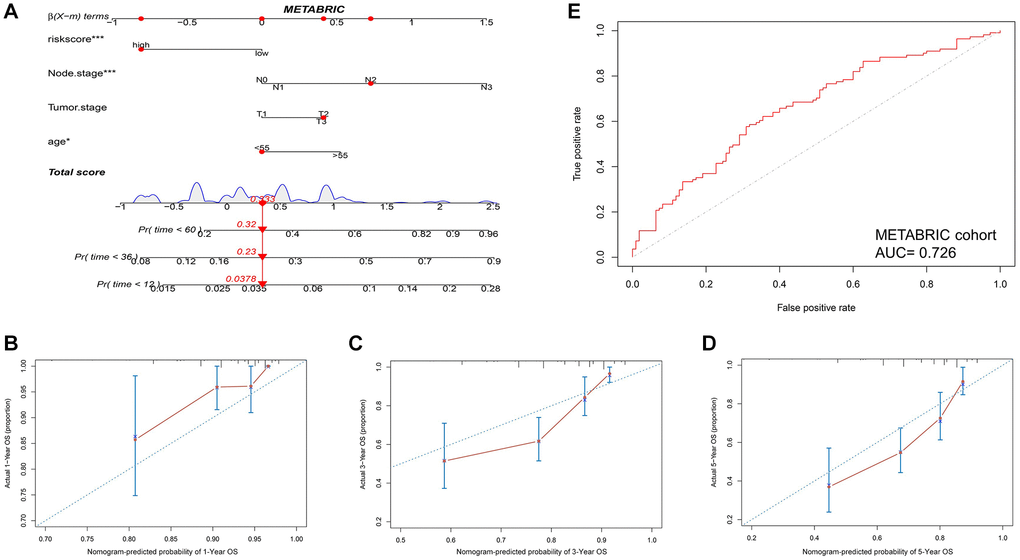
Figure 5. Combination of HIRS and clinicopathological features optimize risk stratification and survival prediction in the METABRIC cohort. (A) A nomogram was developed to analyze risk appraisal for individual patients. (B–D) Calibration analysis suggested a high accuracy of 1-, 3-, and 5-years OS prediction. (E) time-ROC analysis showed that the nomogram was a stable and reliable predictor for OS.
Validation of hypoxia and immune profiling in HIRS
Next, we analyzed the correlation between the hypoxia-immune related gene signature and HIF1A. SERPINE1 was shown to positively correlate with the expression of HIF1A (Figure 6A and Supplementary Figure 5A, 5D). Besides, HIRS was significantly associated with hypoxia-related genes, implied that HIRS might reflect hypoxia status in the tumor microenvironment (Figure 6B and Supplementary Figure 5B, 5E). With the hypoxia gene set from MSigDB, GSEA analyses revealed that the association of hypoxia status and HIRS in the METABRIC dataset (Figure 6C). Furthermore, natural killer cell mediated cytotoxicity, toll-like receptor signaling pathway, antigen processing and presentation, T-cell activation, and B-cell activation were significantly enriched in the high-risk group according to the GSEA analyses (Figure 6D and Supplementary Figure 5C, 5F).
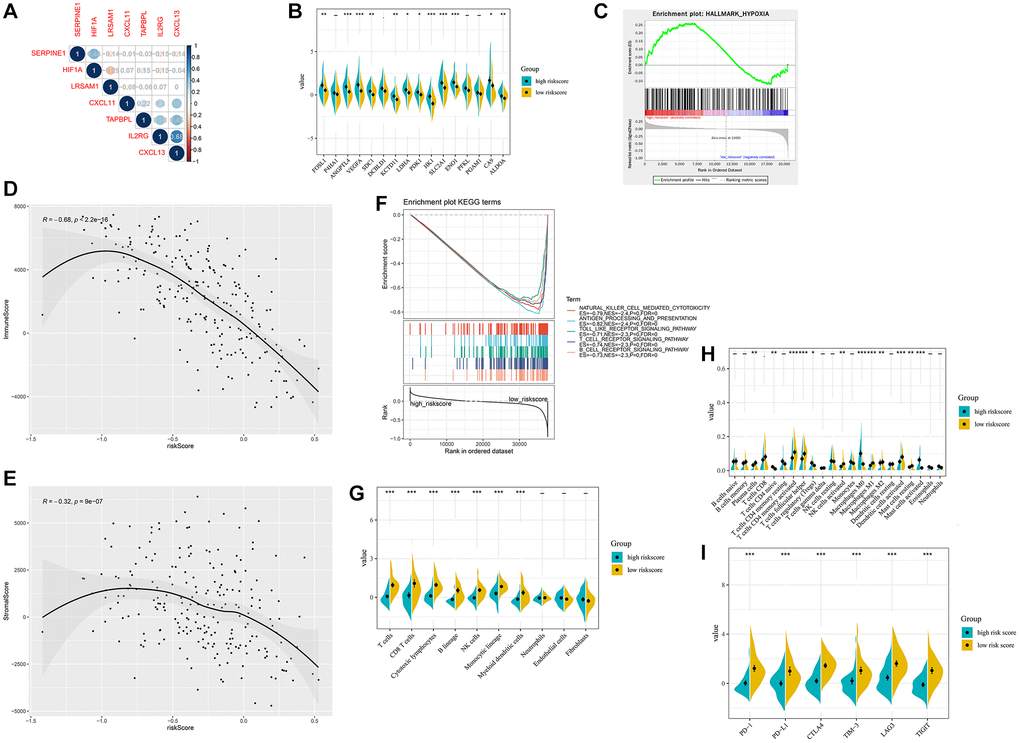
Figure 6. Hypoxia-related sketch, immune-related sketch, and tumor infiltrating immune cells in the HIRS based groups in the METABRIC cohort. (A) Correlation between the gene signature and HIF1A. (B) Correlation between HIRS and hypoxia-related genes. (C) GSEA confirmed the hypoxia status in the HIRS-based groups. (D) GSEA of immune-related signaling in the HIRS-based groups. (E–F) ESTIMATE analyses between different risk groups. (G) MCP-counter analyses between different risk groups. (H) CIBERSORT analyses between different risk groups. (I) the expression of immune checkpoint targets between different risk groups.
ESTIMATE algorithm indicated that HIRS was negatively correlated with the immune score in all cohorts (Figure 6E and Supplementary Figure 6A, 6F). Interestingly, an expressing reverse correlation between HIRS and the stromal score was also identified (Figure 6F and Supplementary Figure 6B, 6G). Meanwhile, MCP-counter suggested that patients with lower HIRS value had a higher level of tumor-infiltrating cytotoxic immune cells (Figure 6G and Supplementary Figure 6C, 6H). Furthermore, CIBERSORT algorithm (Figure 6H and Supplementary Figure 6D, 6I) confirmed that patients in the low-risk group were qualified with more antitumoral immune cells (plasma cells, activated dendritic cells, activated memory CD4 + T cells and NK cells), while patients in the high-risk group were characteristics of more regulatory T cells and M2 macrophages. Moreover, low-risk patients were correlated with a remarkably higher expression of immune checkpoint markers, like PD-1, PD-L1, CTLA-4, T-cell immunoglobulin and mucin-domain containing-3 (TIM-3), lymphocyte activation gene-3 (LAG3), and T Cell Immunoreceptor with Ig and ITIM Domains (TIGIT) comparative to that in the high-risk group (all P < 0.01) (Figure 6I and Supplementary Figure 6E, 6J).
HIRS severs as a potential marker of therapeutic resistance
Considering tumor hypoxia and immune status always promote resistance to chemotherapy, whether the gene signature we constructed is a marker of therapeutic resistance needs further investigation. Patients from GSE90505 and GSE18864 were used to validate the prediction. As shown in Figure 7A–7B, the high risk group showed worse outcomes after chemotherapy in the GSE18864 and GSE90505 cohorts. Moreover, a landscape plot was explored by GSCALite to exhibit the relationship between drug reactions and the expression level of hypoxia-immune related genes (Figure 7C). The bubble heatmap depicted significant correlations between individual genes with IC50 data in BRCA cell lines. Thoroughly, SERPINE1 conferred drug resistance, while IL2RG exhibited drug sensitivity, which may help to explore targeted drugs to improve the clinical outcomes for TNBC patients.
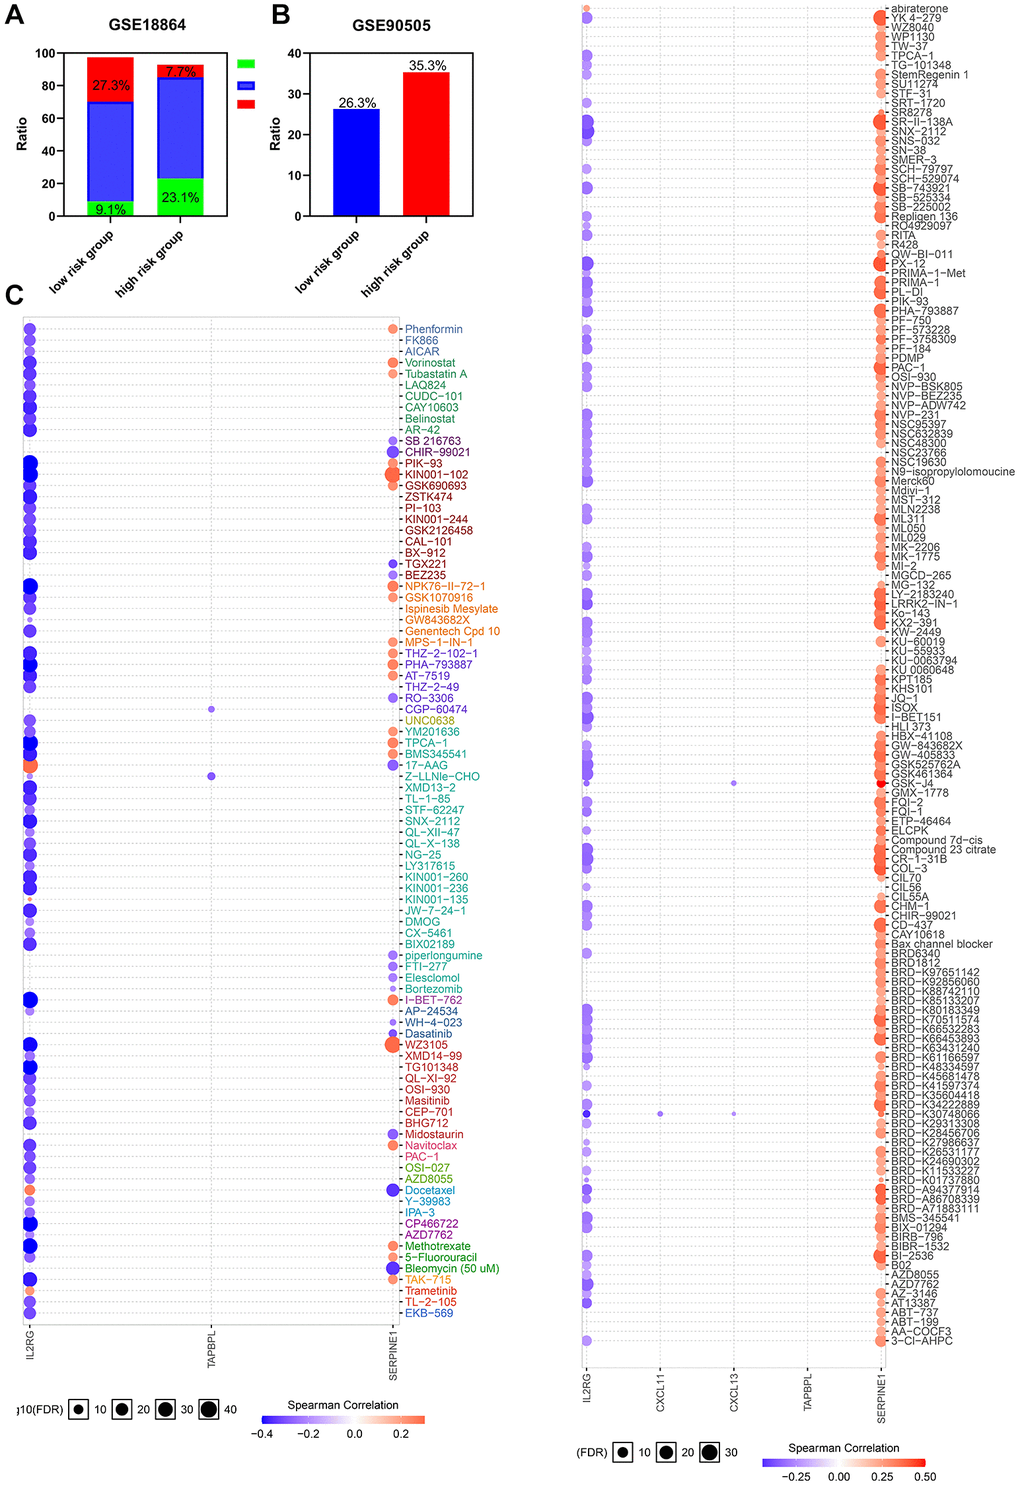
Figure 7. The risk classifier serves as a favorable biomarker of resistance to chemotherapy. (A) The ratio of complete response (CR) from GSE18864 cohort, and (B) the ratio of breast cancer related events from GSE90505 cohort in the HIRS based groups. (C) The relationship between gene signature and IC50 of different molecules in BRCA cell lines. PD, progressive disease; PR, partial remission, SD stable disease.
Validation for the indicative role of the HIRS in external cohort
For the validation cohort, patients from GSE103091 were separated into different risk groups according to the median value of HIRS. Correlations of the gene signature with HIF1A expression were shown in Figure 8A. The immune and stromal scores were negatively associated with HIRS (Figure 8B, 8C). MCP-counter suggested that patients with lower HIRS value presented with a higher percentage of tumor-infiltrating cytotoxic immune cells (Figure 8D), and the CIBERSORT results showed that the high-risk group were qualified with more immune suppressive cells (Figure 8E). Meanwhile, patients with higher HIRS were exhibited significantly lower expression of PD-1, PD-L1, CTLA-4, LAG3, TIGIT, and TIM-3 comparative to those in the low- risk group (all P < 0.01) (Figure 8F). Furthermore, GSEA showed that immune related signaling were notably enriched in the high-risk group (Figure 8G–8J).
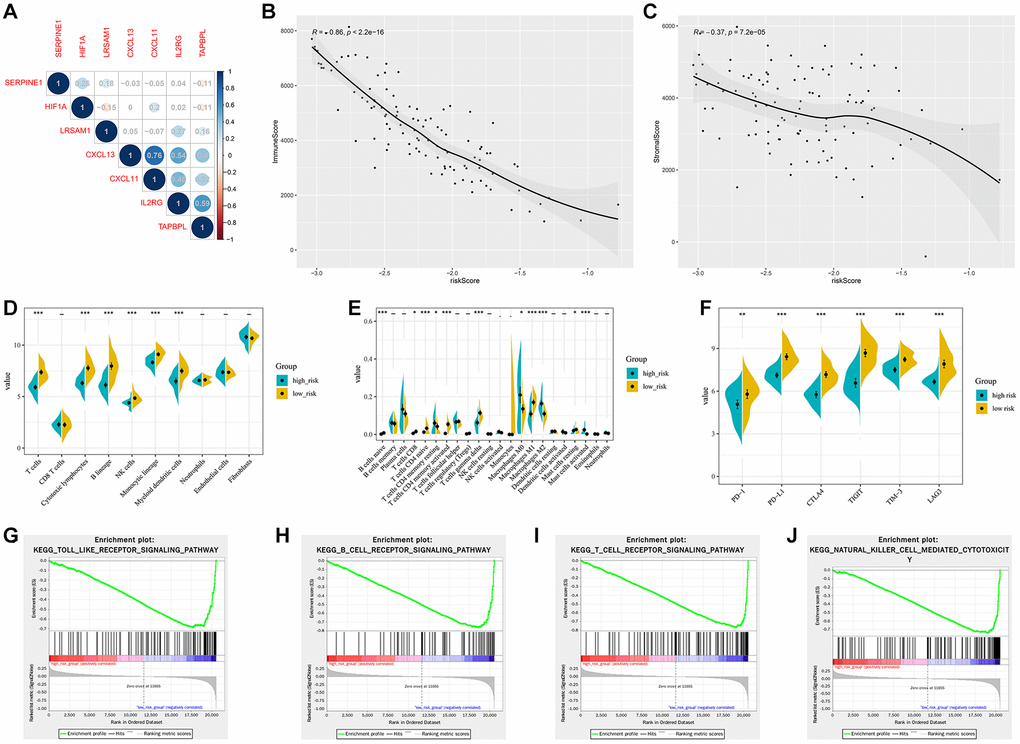
Figure 8. Validation of the hypoxia and immune related gene signature in the GSE103091 cohort. (A) Correlation network between the gene signature and HIF1A. Correlation between the risk score and immune score (B) and stromal score (C). (D) Association of MCP-counter-estimated infiltrating cells with the risk score. (E) Comparison of infiltrating immune cells (CIBERSORT) between different risk groups. (F) the expression of immune checkpoint targets between different risk groups. (G–J) GSEA of enriched immune-related signaling in the HIRS-based groups.
Discussion
To date, some hypoxia and immune related gene signatures for therapeutic response and prognosis have been established in different cancer types, like head and neck, gastric, breast cancer, and oral squamous cell carcinoma [37–40]. However, unavoidable deficiencies existed in previous studies. For instance, the hypoxia and immune-related gene signatures established in previous studies are roughly based on some public datasets or literature-reported genes, ignoring the fact that hypoxia and immune microenvironment as significant cancer hallmarks involving gene expression profiles.
Previous studies have addressed that hypoxia could reprogram the tumor microenvironment, resulting from the suppression of immune status in TNBC [16, 41, 42]. Given that hypoxia moderators and immune checkpoint inhibitors have been shown to present latent clinical application value in TNBC patients [41–44], we investigated the potential value of a combined hypoxia and immune gene signature for TNBC in this study. By using the ssGSEA and WGCNA methods, we evaluated the hypoxia and immune status in TNBC to choose the hypoxia related genes and immune related genes firstly, which promising the specificity and exclusivity of the gene signature we established in TNBC patients. Then, we selected 6 gene signatures that robust reflect the prognosis of TNBC patients using univariate cox regression and LASSO regression model.
Survival analyses demonstrated the six gene signatures were significantly associated with the prognosis of TNBC patients, and worse prognoses were observed in patients with higher HIRS. Moreover, the nomogram we constructed in this study had a favorable predictive performance for prognosis in TNBC patients. Both calibration plots and tROC curves indicated the stable and dependable performance of the nomogram for survival prediction in TNBC patients. As for hypoxia correlation, the key biomarkers of hypoxia (VEGFA, SLC2A1, ALDOA, ENO1CA9, etc.) are increasingly expressed in the high-risk group compared with their counterparts, implying a hypoxia status in the high-risk groups. Besides, GSEA analyses showed that patients from the high-risk group was significantly associated with hypoxia status.
For the association between the risk model with immune characteristics, Estimate analyses showed that both immune and stromal score were negatively correlated with HIRS, which indicated heterogeneous immune status within the different risk groups. In addition, MCP-counter demonstrated that activated immune cells including T cells, B cells and NK cells were sharply decreased for patients with high HIRS, implying an immune defect profile in this group. Besides, CIBERSORT revealed that patients with high HIRS had a remarkably higher percentage of M2 macrophages and Tregs phenotype. Whilst, immune-effective cells, like plasma cells, activated T cells and NK cells were decreased in the high-risk group, indicating that the risk model we constructed in this study may effectively predict the immune microenvironment. Immune checkpoints execute a vital role in carcinogenesis by espousing tumor immunosuppressive activities. Tumor cells can protect themselves from immune attack by activating immune checkpoint targets. Accumulating evidence suggested that patients with PD-L1 expression in tumor cells and stromal immune cells are more likely to respond to chemotherapy and immunotherapy and exhibit better prognosis [9, 45–47]. Previous study showed that hypoxia could induce high expression of PD-L1 on MDSCs and macrophages in tumor microenvironment, then suppresses the immune system to evade immune attack [48–50]. In our study, the expression of immune checkpoint markers was notably decreased in the high-risk group, which meant that the hypoxia-immune status in tumor microenvironment may affect the response to the immune checkpoint inhibitors (ICIs) therapy. Moreover, results from external cohorts and the GSCALite dataset indicated that the gene signatures we obtained could effectively depict the drug response of TNBC patients. Patients from the high-risk group showed worse outcomes after chemotherapy in GSE18864 and GSE90505 cohorts, which may explore targeted therapy to TNBC patients.
The comprehensive hypoxia–immune related gene signature we constructed indicated that personalized treatment should be exerted in distinct risk subgroups. For instance, immunotherapy, like anti-PD1/PD-L1 treatment, might be more effective in patients with low-risk feature. A lower HIRS was suggestive of a higher level of activated immune cells and higher efficacy for immunotherapy. Patients from the high-risk group had worse survival outcomes, a higher HIRS might indicate a hypoxia microenvironment, and limited probable benefit from immune checkpoint inhibitors. The findings indicated that further successive immunotherapy might effective after hypoxia modification.
Meanwhile, some limitations in this study should be noted. First, this is a cross-cohort and retrospective study, further verification in prospective trials is warranted. Second, the nomogram we developed need to be validated in external cohort to examine its performance and accuracy. Third, further experimental studies are needed to elucidate the underlying mechanism of the hypoxia and immune gene signatures in TNBC.
Conclusions
In summary, a novel hypoxia and immune related gene signature to predict survival and discriminate high-risk patients with TNBC were developed and cross-cohort validated. The hypoxia and immune related risk model could be a powerful tool to select patients for hypoxia-targeted therapies and immunotherapies. Large-scale, multi-center and prospective studies are warranted to validate the efficacy of the HIRS model we constructed in the future.
Author Contributions
XY and XL conceived and designed the study. MZ, XW and YJX developed the methodology. MQX, YHS, and WFP involved in data acquisition. XY, MZ, and XW performed bioinformatic analysis. XHL, and YJX analyzed and interpreted the data. XY and XL supervised the study. All authors approved the final manuscript.
Acknowledgments
We greatly acknowledge METABRIC, TCGA and GEO database for providing their platforms and contributors for uploading their meaningful datasets. We also thank all members of the laboratory for their kindness and help.
Conflicts of Interest
The authors declare no conflicts of interest related to this study.
Funding
The authors received no financial support for the research.
References
- 1. Dent R, Trudeau M, Pritchard KI, Hanna WM, Kahn HK, Sawka CA, Lickley LA, Rawlinson E, Sun P, Narod SA. Triple-negative breast cancer: clinical features and patterns of recurrence. Clin Cancer Res. 2007; 13:4429–34. https://doi.org/10.1158/1078-0432.CCR-06-3045 [PubMed]
- 2. Waks AG, Winer EP. Breast Cancer Treatment: A Review. JAMA. 2019; 321:288–300. https://doi.org/10.1001/jama.2018.19323 [PubMed]
- 3. Lehmann BD, Bauer JA, Chen X, Sanders ME, Chakravarthy AB, Shyr Y, Pietenpol JA. Identification of human triple-negative breast cancer subtypes and preclinical models for selection of targeted therapies. J Clin Invest. 2011; 121:2750–67. https://doi.org/10.1172/JCI45014 [PubMed]
- 4. Burstein MD, Tsimelzon A, Poage GM, Covington KR, Contreras A, Fuqua SA, Savage MI, Osborne CK, Hilsenbeck SG, Chang JC, Mills GB, Lau CC, Brown PH. Comprehensive genomic analysis identifies novel subtypes and targets of triple- negative breast cancer. Clin Cancer Res. 2015; 21:1688–98. https://doi.org/10.1158/1078-0432.CCR-14-0432 [PubMed]
- 5. Bareche Y, Venet D, Ignatiadis M, Aftimos P, Piccart M, Rothe F, Sotiriou C. Unravelling triple-negative breast cancer molecular heterogeneity using an integrative multiomic analysis. Ann Oncol. 2018; 29:895–902. https://doi.org/10.1093/annonc/mdy024 [PubMed]
- 6. Winer EP, Lipatov O, Im SA, Goncalves A, Muñoz-Couselo E, Lee KS, Schmid P, Tamura K, Testa L, Witzel I, Ohtani S, Turner N, Zambelli S, et al, and KEYNOTE-119 investigators. Pembrolizumab versus investigator-choice chemotherapy for metastatic triple- negative breast cancer (KEYNOTE-119): a randomised, open-label, phase 3 trial. Lancet Oncol. 2021; 22:499–511. https://doi.org/10.1016/S1470-2045(20)30754-3 [PubMed]
- 7. Brown LC, Salgado R, Luen SJ, Savas P, Loi S. Tumor-Infiltrating Lymphocyctes in Triple-Negative Breast Cancer: Update for 2020. Cancer J. 2021; 27:25–31. https://doi.org/10.1097/PPO.0000000000000501 [PubMed]
- 8. Mittendorf EA, Zhang H, Barrios CH, Saji S, Jung KH, Hegg R, Koehler A, Sohn J, Iwata H, Telli ML, Ferrario C, Punie K, Penault-Llorca F, et al. Neoadjuvant atezolizumab in combination with sequential nab-paclitaxel and anthracycline- based chemotherapy versus placebo and chemotherapy in patients with early-stage triple-negative breast cancer (IMpassion031): a randomised, double-blind, phase 3 trial. Lancet. 2020; 396:1090–100. https://doi.org/10.1016/S0140-6736(20)31953-X [PubMed]
- 9. Cortes J, Cescon DW, Rugo HS, Nowecki Z, Im SA, Yusof MM, Gallardo C, Lipatov O, Barrios CH, Holgado E, Iwata H, Masuda N, Otero MT, et al, and KEYNOTE-355 Investigators. Pembrolizumab plus chemotherapy versus placebo plus chemotherapy for previously untreated locally recurrent inoperable or metastatic triple-negative breast cancer (KEYNOTE-355): a randomised, placebo-controlled, double-blind, phase 3 clinical trial. Lancet. 2020; 396:1817–28. https://doi.org/10.1016/S0140-6736(20)32531-9 [PubMed]
- 10. Fu T, Dai LJ, Wu SY, Xiao Y, Ma D, Jiang YZ, Shao ZM. Spatial architecture of the immune microenvironment orchestrates tumor immunity and therapeutic response. J Hematol Oncol. 2021; 14:98. https://doi.org/10.1186/s13045-021-01103-4 [PubMed]
- 11. Santoni M, Romagnoli E, Saladino T, Foghini L, Guarino S, Capponi M, Giannini M, Cognigni PD, Ferrara G, Battelli N. Triple negative breast cancer: Key role of Tumor-Associated Macrophages in regulating the activity of anti-PD-1/PD-L1 agents. Biochim Biophys Acta Rev Cancer. 2018; 1869:78–84. https://doi.org/10.1016/j.bbcan.2017.10.007 [PubMed]
- 12. Hamilton EP, Kaklamani V, Falkson C, Vidal GA, Ward PJ, Patre M, Chui SY, Rotmensch J, Gupta K, Molinero L, Li Y, Emens LA. Impact of Anti-HER2 Treatments Combined With Atezolizumab on the Tumor Immune Microenvironment in Early or Metastatic Breast Cancer: Results From a Phase Ib Study. Clin Breast Cancer. 2021. [Epub ahead of print]. https://doi.org/10.1016/j.clbc.2021.04.011 [PubMed]
- 13. Loi S, Michiels S, Salgado R, Sirtaine N, Jose V, Fumagalli D, Kellokumpu-Lehtinen PL, Bono P, Kataja V, Desmedt C, Piccart MJ, Loibl S, Denkert C, et al. Tumor infiltrating lymphocytes are prognostic in triple negative breast cancer and predictive for trastuzumab benefit in early breast cancer: results from the FinHER trial. Ann Oncol. 2014; 25:1544–50. https://doi.org/10.1093/annonc/mdu112 [PubMed]
- 14. Gruosso T, Gigoux M, Manem VSK, Bertos N, Zuo D, Perlitch I, Saleh SMI, Zhao H, Souleimanova M, Johnson RM, Monette A, Ramos VM, Hallett MT, et al. Spatially distinct tumor immune microenvironments stratify triple-negative breast cancers. J Clin Invest. 2019; 129:1785–800. https://doi.org/10.1172/JCI96313 [PubMed]
- 15. Tatiparti K, Rauf MA, Sau S, Iyer AK. Carbonic Anhydrase-IX Guided Albumin Nanoparticles for Hypoxia-mediated Triple-Negative Breast Cancer Cell Killing and Imaging of Patient-derived Tumor. Molecules. 2020; 25:2362. https://doi.org/10.3390/molecules25102362 [PubMed]
- 16. Qian X, Zhang Q, Shao N, Shan Z, Cheang T, Zhang Z, Su Q, Wang S, Lin Y. Respiratory hyperoxia reverses immunosuppression by regulating myeloid-derived suppressor cells and PD-L1 expression in a triple-negative breast cancer mouse model. Am J Cancer Res. 2019; 9:529–45. [PubMed]
- 17. Ling B, Watt K, Banerjee S, Newsted D, Truesdell P, Adams J, Sidhu SS, Craig AWB. A novel immunotherapy targeting MMP-14 limits hypoxia, immune suppression and metastasis in triple-negative breast cancer models. Oncotarget. 2017; 8:58372–85. https://doi.org/10.18632/oncotarget.17702 [PubMed]
- 18. Azimi I, Milevskiy MJG, Chalmers SB, Yapa KT, Robitaille M, Henry C, Baillie GJ, Thompson EW, Roberts-Thomson SJ, Monteith GR. ORAI1 and ORAI3 in Breast Cancer Molecular Subtypes and the Identification of ORAI3 as a Hypoxia Sensitive Gene and a Regulator of Hypoxia Responses. Cancers (Basel). 2019; 11:208. https://doi.org/10.3390/cancers11020208 [PubMed]
- 19. Hanahan D, Weinberg RA. Hallmarks of cancer: the next generation. Cell. 2011; 144:646–74. https://doi.org/10.1016/j.cell.2011.02.013 [PubMed]
- 20. Lappano R, Talia M, Cirillo F, Rigiracciolo DC, Scordamaglia D, Guzzi R, Miglietta AM, De Francesco EM, Belfiore A, Sims AH, Maggiolini M. The IL1β-IL1R signaling is involved in the stimulatory effects triggered by hypoxia in breast cancer cells and cancer-associated fibroblasts (CAFs). J Exp Clin Cancer Res. 2020; 39:153. https://doi.org/10.1186/s13046-020-01667-y [PubMed]
- 21. Jézéquel P, Loussouarn D, Guérin-Charbonnel C, Campion L, Vanier A, Gouraud W, Lasla H, Guette C, Valo I, Verrièle V, Campone M. Gene-expression molecular subtyping of triple-negative breast cancer tumours: importance of immune response. Breast Cancer Res. 2015; 17:43. https://doi.org/10.1186/s13058-015-0550-y [PubMed]
- 22. Curtis C, Shah SP, Chin SF, Turashvili G, Rueda OM, Dunning MJ, Speed D, Lynch AG, Samarajiwa S, Yuan Y, Gräf S, Ha G, Haffari G, et al, and METABRIC Group. The genomic and transcriptomic architecture of 2,000 breast tumours reveals novel subgroups. Nature. 2012; 486:346–52. https://doi.org/10.1038/nature10983 [PubMed]
- 23. Ritchie ME, Phipson B, Wu D, Hu Y, Law CW, Shi W, Smyth GK. limma powers differential expression analyses for RNA-sequencing and microarray studies. Nucleic Acids Res. 2015; 43:e47. https://doi.org/10.1093/nar/gkv007 [PubMed]
- 24. Hänzelmann S, Castelo R, Guinney J. GSVA: gene set variation analysis for microarray and RNA-seq data. BMC Bioinformatics. 2013; 14:7. https://doi.org/10.1186/1471-2105-14-7 [PubMed]
- 25. Langfelder P, Horvath S. WGCNA: an R package for weighted correlation network analysis. BMC Bioinformatics. 2008; 9:559. https://doi.org/10.1186/1471-2105-9-559 [PubMed]
- 26. He Y, Jiang Z, Chen C, Wang X. Classification of triple-negative breast cancers based on Immunogenomic profiling. J Exp Clin Cancer Res. 2018; 37:327. https://doi.org/10.1186/s13046-018-1002-1 [PubMed]
- 27. Barbie DA, Tamayo P, Boehm JS, Kim SY, Moody SE, Dunn IF, Schinzel AC, Sandy P, Meylan E, Scholl C, Fröhling S, Chan EM, Sos ML, et al. Systematic RNA interference reveals that oncogenic KRAS-driven cancers require TBK1. Nature. 2009; 462:108–12. https://doi.org/10.1038/nature08460 [PubMed]
- 28. Tibshirani R. The lasso method for variable selection in the Cox model. Stat Med. 1997; 16:385–95. https://doi.org/10.1002/(sici)1097-0258(19970228)16:4<385::aid-sim380>3.0.co;2-3 [PubMed]
- 29. Sun J, Zhao T, Zhao D, Qi X, Bao X, Shi R, Su C. Development and validation of a hypoxia-related gene signature to predict overall survival in early-stage lung adenocarcinoma patients. Ther Adv Med Oncol. 2020; 12:1758835920937904. https://doi.org/10.1177/1758835920937904 [PubMed]
- 30. Newman AM, Liu CL, Green MR, Gentles AJ, Feng W, Xu Y, Hoang CD, Diehn M, Alizadeh AA. Robust enumeration of cell subsets from tissue expression profiles. Nat Methods. 2015; 12:453–57. https://doi.org/10.1038/nmeth.3337 [PubMed]
- 31. Becht E, Giraldo NA, Lacroix L, Buttard B, Elarouci N, Petitprez F, Selves J, Laurent-Puig P, Sautès-Fridman C, Fridman WH, de Reyniès A. Estimating the population abundance of tissue-infiltrating immune and stromal cell populations using gene expression. Genome Biol. 2016; 17:218. https://doi.org/10.1186/s13059-016-1070-5 [PubMed]
- 32. Yoshihara K, Shahmoradgoli M, Martínez E, Vegesna R, Kim H, Torres-Garcia W, Treviño V, Shen H, Laird PW, Levine DA, Carter SL, Getz G, Stemke-Hale K, et al. Inferring tumour purity and stromal and immune cell admixture from expression data. Nat Commun. 2013; 4:2612. https://doi.org/10.1038/ncomms3612 [PubMed]
- 33. Subramanian A, Tamayo P, Mootha VK, Mukherjee S, Ebert BL, Gillette MA, Paulovich A, Pomeroy SL, Golub TR, Lander ES, Mesirov JP. Gene set enrichment analysis: a knowledge-based approach for interpreting genome-wide expression profiles. Proc Natl Acad Sci U S A. 2005; 102:15545–50. https://doi.org/10.1073/pnas.0506580102 [PubMed]
- 34. Liu CJ, Hu FF, Xia MX, Han L, Zhang Q, Guo AY. GSCALite: a web server for gene set cancer analysis. Bioinformatics. 2018; 34:3771–72. https://doi.org/10.1093/bioinformatics/bty411 [PubMed]
- 35. Zhang Z, Kattan MW. Drawing Nomograms with R: applications to categorical outcome and survival data. Ann Transl Med. 2017; 5:211. https://doi.org/10.21037/atm.2017.04.01 [PubMed]
- 36. Blanche P, Dartigues JF, Jacqmin-Gadda H. Estimating and comparing time- dependent areas under receiver operating characteristic curves for censored event times with competing risks. Stat Med. 2013; 32:5381–97. https://doi.org/10.1002/sim.5958 [PubMed]
- 37. Zeng H, Luo M, Chen L, Ma X, Ma X. Machine learning analysis of DNA methylation in a hypoxia-immune model of oral squamous cell carcinoma. Int Immunopharmacol. 2020; 89:107098. https://doi.org/10.1016/j.intimp.2020.107098 [PubMed]
- 38. Liu Y, Wu J, Huang W, Weng S, Wang B, Chen Y, Wang H. Development and validation of a hypoxia-immune-based microenvironment gene signature for risk stratification in gastric cancer. J Transl Med. 2020; 18:201. https://doi.org/10.1186/s12967-020-02366-0 [PubMed]
- 39. Brooks JM, Menezes AN, Ibrahim M, Archer L, Lal N, Bagnall CJ, von Zeidler SV, Valentine HR, Spruce RJ, Batis N, Bryant JL, Hartley M, Kaul B, et al. Development and Validation of a Combined Hypoxia and Immune Prognostic Classifier for Head and Neck Cancer. Clin Cancer Res. 2019; 25:5315–28. https://doi.org/10.1158/1078-0432.CCR-18-3314 [PubMed]
- 40. Zheng S, Zou Y, Liang JY, Xiao W, Yang A, Meng T, Lu S, Luo Z, Xie X. Identification and validation of a combined hypoxia and immune index for triple- negative breast cancer. Mol Oncol. 2020; 14:2814–33. https://doi.org/10.1002/1878-0261.12747 [PubMed]
- 41. Nanda R, Chow LQ, Dees EC, Berger R, Gupta S, Geva R, Pusztai L, Pathiraja K, Aktan G, Cheng JD, Karantza V, Buisseret L. Pembrolizumab in Patients With Advanced Triple-Negative Breast Cancer: Phase Ib KEYNOTE-012 Study. J Clin Oncol. 2016; 34:2460–67. https://doi.org/10.1200/JCO.2015.64.8931 [PubMed]
- 42. Li X, Jeon YH, Kwon N, Park JG, Guo T, Kim HR, Huang JD, Lee DS, Yoon J. In Vivo-assembled phthalocyanine/albumin supramolecular complexes combined with a hypoxia-activated prodrug for enhanced photodynamic immunotherapy of cancer. Biomaterials. 2021; 266:120430. https://doi.org/10.1016/j.biomaterials.2020.120430 [PubMed]
- 43. Jiang YZ, Liu Y, Xiao Y, Hu X, Jiang L, Zuo WJ, Ma D, Ding J, Zhu X, Zou J, Verschraegen C, Stover DG, Kaklamani V, et al. Molecular subtyping and genomic profiling expand precision medicine in refractory metastatic triple- negative breast cancer: the FUTURE trial. Cell Res. 2021; 31:178–86. https://doi.org/10.1038/s41422-020-0375-9 [PubMed]
- 44. Rugo HS, Loi S, Adams S, Schmid P, Schneeweiss A, Barrios CH, Iwata H, Diéras V, Winer EP, Kockx MM, Peeters D, Chui SY, Lin JC, et al. PD-L1 Immunohistochemistry Assay Comparison in Atezolizumab plus nab- Paclitaxel-Treated Advanced Triple-Negative Breast Cancer. J Natl Cancer Inst. 2021. [Epub ahead of print]. https://doi.org/10.1093/jnci/djab108 [PubMed]
- 45. Tarantino P, Gandini S, Trapani D, Criscitiello C, Curigliano G. Immunotherapy addition to neoadjuvant chemotherapy for early triple negative breast cancer: A systematic review and meta-analysis of randomized clinical trials. Crit Rev Oncol Hematol. 2021; 159:103223. https://doi.org/10.1016/j.critrevonc.2021.103223 [PubMed]
- 46. Kwapisz D. Pembrolizumab and atezolizumab in triple-negative breast cancer. Cancer Immunol Immunother. 2021; 70:607–17. https://doi.org/10.1007/s00262-020-02736-z [PubMed]
- 47. Gibson J. Anti-PD-L1 for metastatic triple-negative breast cancer. Lancet Oncol. 2015; 16:e264. https://doi.org/10.1016/S1470-2045(15)70208-1 [PubMed]
- 48. You L, Wu W, Wang X, Fang L, Adam V, Nepovimova E, Wu Q, Kuca K. The role of hypoxia-inducible factor 1 in tumor immune evasion. Med Res Rev. 2021; 41:1622–43. https://doi.org/10.1002/med.21771 [PubMed]
- 49. Mok TN, Chen J, Pan J, Ming WK, He Q, Sin TH, Deng J, Li J, Zha Z. Use of a Virtual Reality Simulator for Tendon Repair Training: Randomized Controlled Trial. JMIR Serious Games. 2021; 9:e27544. https://doi.org/10.2196/27544 [PubMed]
- 50. Damgaci S, Ibrahim-Hashim A, Enriquez-Navas PM, Pilon-Thomas S, Guvenis A, Gillies RJ. Hypoxia and acidosis: immune suppressors and therapeutic targets. Immunology. 2018; 154:354–62. https://doi.org/10.1111/imm.12917 [PubMed]