


Introduction
Hepatocellular carcinoma (HCC) is the fourth leading cause of cancer-related deaths [1]. HCC is usually initiated by hepatitis B (HBV) infection and chronic liver diseases, resulting in the genetic aberrations of key driver genes, such as p53 and CTNNB [2]. Although systematic treatments have significantly increased the five-year survival rate of patients with HCC, exploring the underlying molecular mechanisms of HCC is highly required for aiding to the development of more effective therapeutic strategies.
Less than 2% of the human genome can be transcribed into protein-coding mRNAs, while more than 75% is actively transcribed into non-coding RNAs, such as microRNAs (miRNAs), long non-coding RNAs (lncRNAs), and circular RNAs (circRNAs) [3]. LncRNAs are a family of non-coding RNAs that are longer than 200 nucleotides (nts) in length and unable to be translated into proteins [4, 5]. LncRNAs have been found to affect multitudes of cellular processes via numerous mechanisms [6]. Nuclear lncRNAs modulate the transcription of target genes by interacting with transcription factors or chromatin modifiers. In addition, mRNA splicing and chromatin interaction were also proved to be mediated by lncRNAs that are localized in the nucleus [7]. When localized in the cytosol, lncRNAs have been shown to directly bind to mRNAs or proteins through base-pairing or specific secondary structures, leading to the stability or/and activity alterations of these macromolecules [6]. Another well-known mechanism of cytoplasmic lncRNAs is functioning as sponges for miRNAs [8].
MiRNAs are 22-nt small non-coding RNAs that enhance the degradation or/and translation of mRNAs by binding to the 3’ untranslated regions (UTRs) [9]. Thus, through sponging miRNAs, lncRNAs are capable to indirectly enhance the levels of target mRNAs. Multitudes of lncRNAs such as lnc-ATB [10], lncRNA-LALR1 [11], and lncHAND2 [12] have been found to aberrantly expressed and serve as modulators during the progression of HCC. Suppressors of cytokine signalling 2 (SOCS2) has been shown to correlate with various inflammatory diseases and cancer [13]. In HCC patients, low expression of SOCS2 is associated with advanced TNM staging and is a promising prognostic marker [14].
Although lncRNAs such as MIAT and PCNAP1 have been shown to promote the HCC progression, the functions and underlying mechanisms of lncRNAs in HCC still need to be explored [15, 16]. As long intergenic non-protein coding RNA 2362 (LINC02362) is a lncRNA whose biological functions are ill-investigated, we aimed to check whether LINC02362 is involved in the progression of HCC. Through online datamining, we observed that LINC02362 was lower expressed in HCC patient samples and was correlated with favorable outcomes of HCC patients. Depletion of LINC02362 in HCC cells resulted in the enhanced survival, migratory and invasive properties as well as the induction of epithelial-to-mesenchymal transition (EMT). In addition, miR-516b-5p was enriched as a target miRNA of LINC02362. Furthermore, LINC02362 promoted the expression of SOSC2 via sponging miR-516b-5p, leading to the alleviation of HCC cell survival, migration, invasion and EMT. In summary, we shed light on the mechanism by which LINC02362 exerts its novel negative regulatory functions during HCC progression, which may provide HCC treatments with a new therapeutic agent.
Results
LINC02362 is associated with a better prognosis of HCC patients
As LINC02362 is an annotated lncRNA whose biological roles have not been well studied, it is worth investigating whether LINC02362 is involved in the progression of HCC. To this end, we checked the levels of LINC02362 in non-tumor and HCC samples. Interestingly, we observed that LINC02362 was expressed at significantly lower levels in HCC samples than those in non-tumor liver samples (Figure 1A). Next, we performed data analysis in the TCGA-LIHC database which includes the clinical parameters of HCC patients. As shown in the Kaplan-Meier plots in Figure 1B, 1C, low expression of LINC02362 was correlated with a poor prognosis in terms of overall survival (OS) and disease-free interval (DFI). It is of note that, between the two groups, i.e. LINC02362-low and LINC02362-high, the OS trend was reversed after six years and there was almost no significant difference in terms of DFI (Figure 1B, 1C). We supposed that many patients might die before six years or they developed metastases at this time point, resulting in only a few patients (with seven patients in Figure 1B and four patients in Figure 1C) were still alive after this time point and the trend after six years may not be representative due to the low amount of patients. In addition, LINC02362 was less expressed in serum alpha-fetoprotein (AFP)-positive HCC patients whose prognosis is more favorable (Figure 1D) [17]. Nevertheless, we noticed that LINC02362 was higher expressed in stage C than in stages A and B in terms of Child-Pugh classification, which was not as expected and will be discussed in the discussion section (Figure 1E). Furthermore, we found that LINC02362 was significantly decreased in the later histologic or TNM grades in comparison with the early benign grade G1 or stage I, respectively (Figure 1F, 1I). Moreover, LINC02362 was downregulated in dead HCC patients than that in survivors (Figure 1G). Since vascular invasion is a hallmark of HCC progression [18], we analyzed LINC02362 levels in HCC patients with or without vascular invasion. Surprisingly, LINC02362 was expressed at lower levels in patients with microvascular or macrovascular invasion than that in those without vascular invasion (Figure 1H). Lower LINC02362 level was observed in TNM stage II and III than in their corresponding controls. Correlation between LINC02362 expression and clinicopathological variables was summarized in Supplementary Table 3. Collectively, LINC02362 is correlated with a better prognosis in HCC patients.
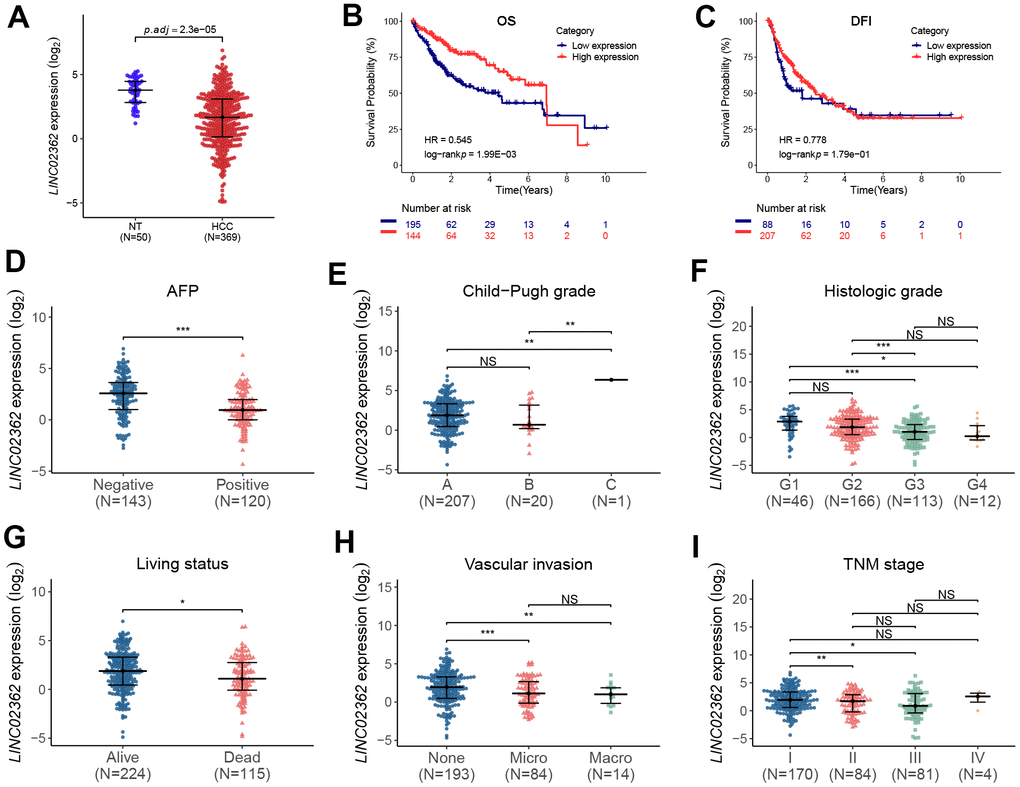
Figure 1. LINC02362 is correlated with a favorable prognosis of HCC patients. (A) Differential analyses of LINC02362 levels in non-tumor (NT; n=50) or HCC tissues (n=369). (B, C) Kaplan-Meier plots showing the overall survival (OS; B) or disease-free interval (DFI; C) of HCC patients stratified by LINC02362 levels. (D–I) The analyses of expression of LINC02362 in HCC patients with serum alpha feto-protein (AFP)-negative or positive (D), different Child-Pugh grades (E), histological grades (F), living status (G), vascular invasion (H) or TNM stages (I). *0.01 < P < 0.05, **0.001 < P < 0.01, ***0.0001 < P < 0.001. NS, not significant.
LINC02362 mitigates HCC cell survival, migration, invasion and EMT
Based on the fact that LINC02362 was associated with better outcomes in patients with HCC, we hypothesized that LINC02362 might function as a tumor-suppressive lncRNA. To test our assumption, LINC02362 was ectopically expressed in Hep3B and PLC/PRF/5 cells, both of which are commonly used cell lines for HCC research (Figure 2A). The MTT assay showed that overexpression of LINC02362 mitigated the proliferation of these two HCC cell lines (Figure 2B). This conclusion was further confirmed by the EdU labeling experiments (Figure 2C, 2D). We then investigated whether the cell cycle was altered upon LINC02362 misexpression. As expected, overexpressing LINC02362 potentiated the cell cycle arrest in HCC cell lines (Figure 2E, 2F). As apoptosis might contribute to the change of cell survival, we evaluated the apoptotic ability of HCC cells. We found that LINC02362 ectopic expression enhanced the apoptosis of HCC cells (Figure 2G, 2H). Moreover, we observed that LINC02362 suppressed the migratory and invasive abilities of HCC cells (Figure 3A, 3B). Since the gain of cell migratory and cell invasive abilities is tightly correlate with the induction of EMT [19], we detected the changes of EMT markers in Hep3B cells. Upon the ectopic expression of LINC02362, the levels of epithelial marker E-cadherin was enhanced while the levels of two mesenchymal markers N-cadherin and Vimentin were significantly decreased (Figure 3C), indicating the EMT process was attenuated by LINC02362. Taken together, overexpression of LINC02362 decreases the survival abilities by inhibiting cell proliferation, improving cell apoptosis, and alleviating the migration, invasion and EMT in HCC cells, suggesting that LINC02362 is a lncRNA that attenuates HCC progression.
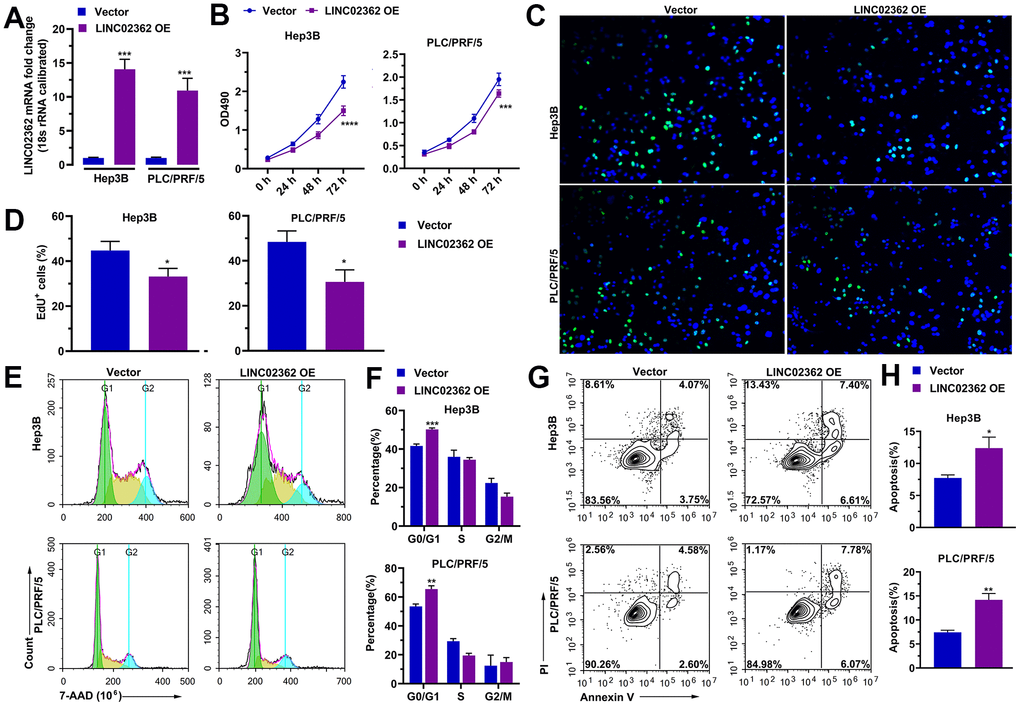
Figure 2. LINC02362 suppresses HCC cell survival. (A) RT-qPCR quantification (n=3) of LINC02362 expression in Hep3B or PLC/PRF/5 cells with LINC02362 ectopic expression. (B) MTT assay (n=3) for measuring the proliferative abilities of HCC cells with LINC02362 overexpression. (C, D) EdU labeling to detect the percentage of dividing cells in LINC02362-overexpressing HCC cells and the corresponding quantification (D; n=3). (E, F) Measurement (E) and quantification (F; n=3) of cell cycle of HCC cells by flow cytometry. (G, H) Detection (G) and quantification (H; n=3) of apoptotic cells in HCC cells overexpressing LINC02362. *0.01 < P < 0.05, **0.001 < P < 0.01, ***0.0001 < P < 0.001, ****P < 0.0001.
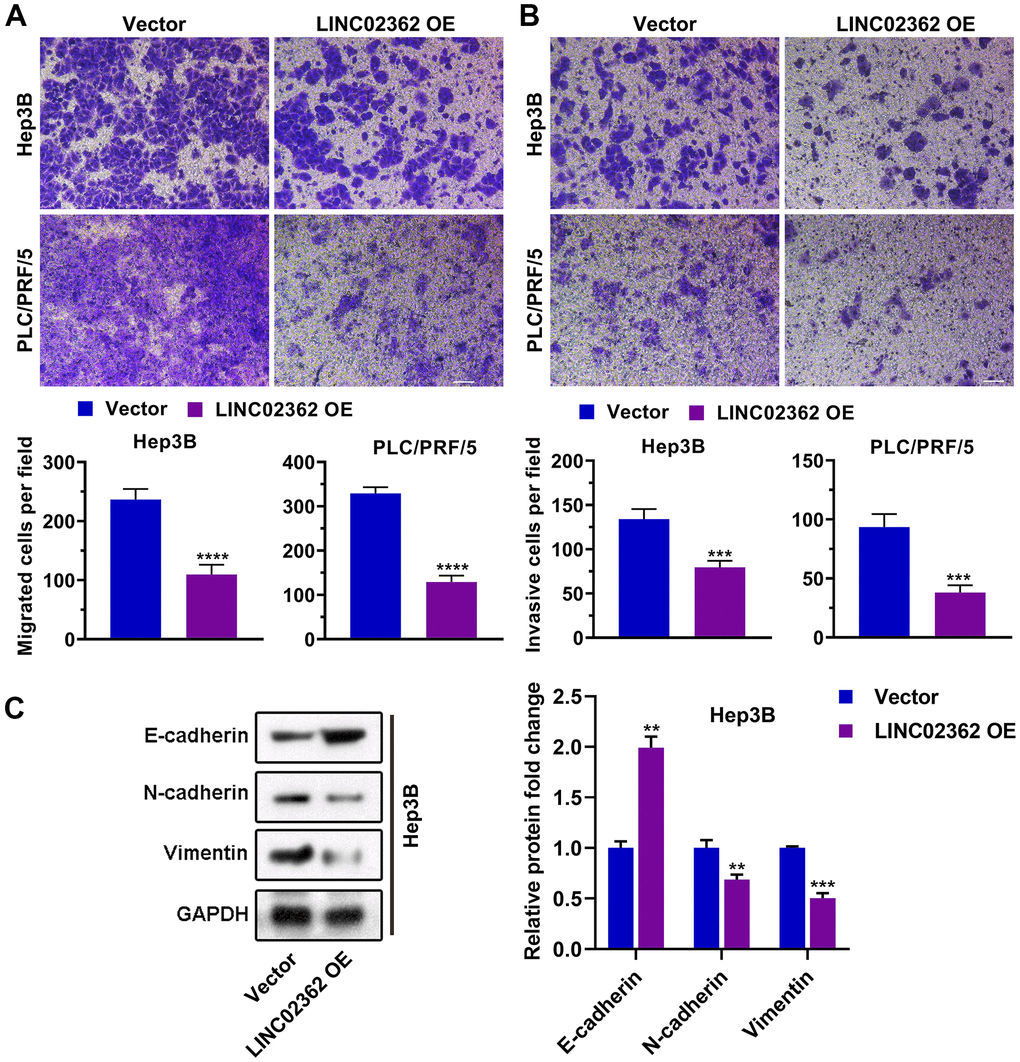
Figure 3. LINC02362 inhibits HCC cell migration, invasion and EMT. (A) Transwell assays to test the effects of LINC02362 overexpression on HCC cell migration. Representative pictures (upper) and quantification (lower; n=3) are shown. (B) Transwell assays to test the effects of LINC02362 overexpression on HCC cell invasion. Representative pictures (upper) and quantification (lower; n=3) are shown. (C) Representative images (left) and quantification (right; n=3) of western blotting analysis for detecting the levels of EMT markers in Hep3B cells. **0.001 < P < 0.01, ***0.0001 < P < 0.001, ****P < 0.0001.
miR-516b-5p is a target miRNA of LINC02362
Since the biological function of a lncRNA is highly dependent on its localization in cells [20], we first checked where LINC02362 is localized. Subcellular fractionation experiments, in which cytosolic RNA 18S and nuclear RNA U6 were used as positive controls, showed that LINC02362 was mainly localized in the cytoplasm (Figure 4A), which was confirmed by the Fluorescent in situ Hybridization (FISH; Supplementary Figure 1) and in silico prediction data from an online database (Supplementary Figure 2). Because a common mechanism of cytoplasmic lncRNAs is functioning as competitive endogenous RNAs (ceRNAs) to regulate the levels of target miRNAs [21], we checked the potential miRNA targets of LINC02362 by in silico prediction. After overlapping the miRNAs upregulated in the TCGA-LIHC dataset with miRNAs that were predicted as LINC02362 candidate targets in two databases, we enriched miR-516b-5p as the only miRNA in the intersection of these three datasets (Figure 4B). As lncRNA-miRNA interaction leads to the downregulation of both lncRNA and miRNA, we then performed a luciferase reporter assay to test the effects of miR-516b-5p on LINC02362. Relative luciferase activity indicated that miR-516b-5p overexpression caused a decrease in the reporter consisting of the interacting fragment of LINC02362, while mutating the nucleotides responsible for miR-516b-5p binding on LINC02362 released the inhibitory effect (Figure 4C, 4D). In addition, ectopic expression of LINC02362 suppressed miR-516b-5p levels while depletion of LINC02362 enhanced the miR-516b-5p expression (Figure 4E). Furthermore, we showed that miR-516b-5p was highly expressed in HCC tumor samples compared with the non-tumor specimens (Figure 4F). In addition, although there was an inverse correlation between LINC02362 and miR-516b-5p, the association was insignificant (Figure 4G). However, we did observed that high miR-516b-5p levels were correlated with poor prognosis of HCC patients (Figure 4H, 4I). Taken together, we validated miR-516b-5p as a downstream target of LINC02362.
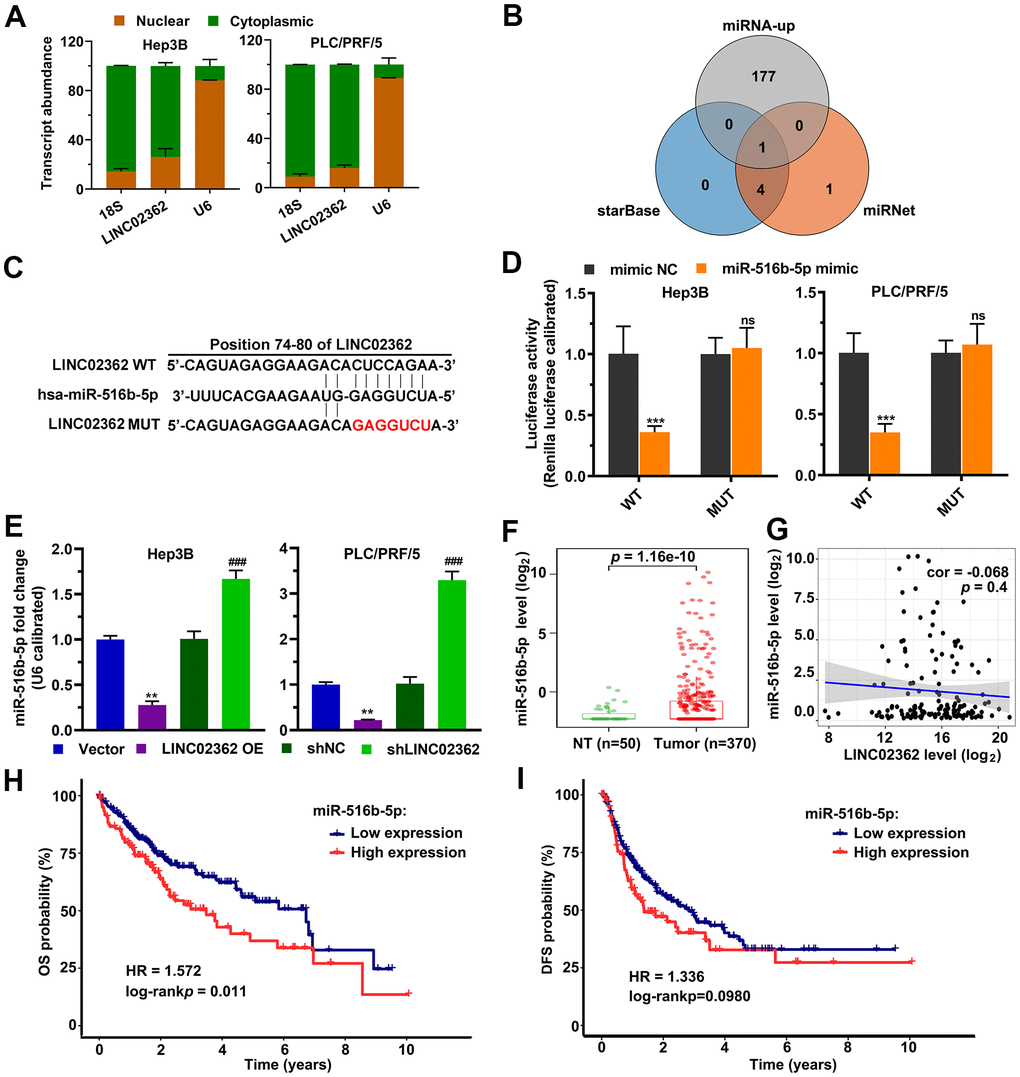
Figure 4. LINC02362 functions as a sponge for miR-516b-5p. (A) Subcellular fractionation (n=3) for quantifying the localization of LINC02362 in HCC cells. (B) Venn diagram showing the overlap between the indicated three databases. (C) Schematic plot indicating the putative binding site between LINC02362 and miR-516b-5p and the sequences upon mutagenesis. (D) Dual luciferase assays (n=3) for checking the effects of miR-516b-5p on the indicated 3’UTR constructs. (E) RT-qPCR detection (n=3) of the miR-516b-5p expression upon misexpression of LINC02362. (F) Datamining to check the levels of miR-516b-5p in non-tumor (NT; n=50) or HCC tissues (n=370). (G) Scatter plot showing the correlation between LINC02362 and miR-516b-5p. (H, I) Kaplan-Meier plots showing the overall survival (OS, H) or disease-free survival (DFS, I) of HCC patients stratified by miR-516b-5p levels. **0.001 < P < 0.01, *** or ### 0.0001 < P < 0.001. NS, not significant.
LINC02362 sponges miR-516b-5p to mitigate HCC progression
Next, we asked whether the biological effects of miR-516b-5p on HCC cells can be attenuated by LINC02362 as we showed that these two RNAs interact with each other (Figure 4C, 4D). First, RT-qPCR results suggested that the levels of exogenously expressed miR-516b-5p could be inhibited upon LINC02362 ectopic expression (Figure 5A). Vice versa, endogenous or exogenous LINC02362 was suppressed by the overexpression of miR-516b-5p (Figure 5B), suggesting that these two RNA molecules modulate the levels of each other in a negative manner. Furthermore, MTT data showed that the proliferation-supporting effect imposed by miR-516b-5p was significantly mitigated upon the ectopic expression of LINC02362 (Figure 5C). Similarly, the EdU signal and cell cycle progression improved by miR-516b-5p was attenuated by LINC02362 (Figure 5D–5G). Moreover, the cell apoptosis decreased by miR-516b-5p could be significantly alleviated by LINC02362 (Figure 5H, 5I). Furthermore, LINC02362 rescued the migration- and invasion-enhancing effects as well as the induction of EMT imposed by miR-516b-5p (Figure 6A–6C). Collectively, our data demonstrated that LINC02362 sponges miR-516b-5p to mitigate the tumor-promoting effects exerted by miR-516b-5p.
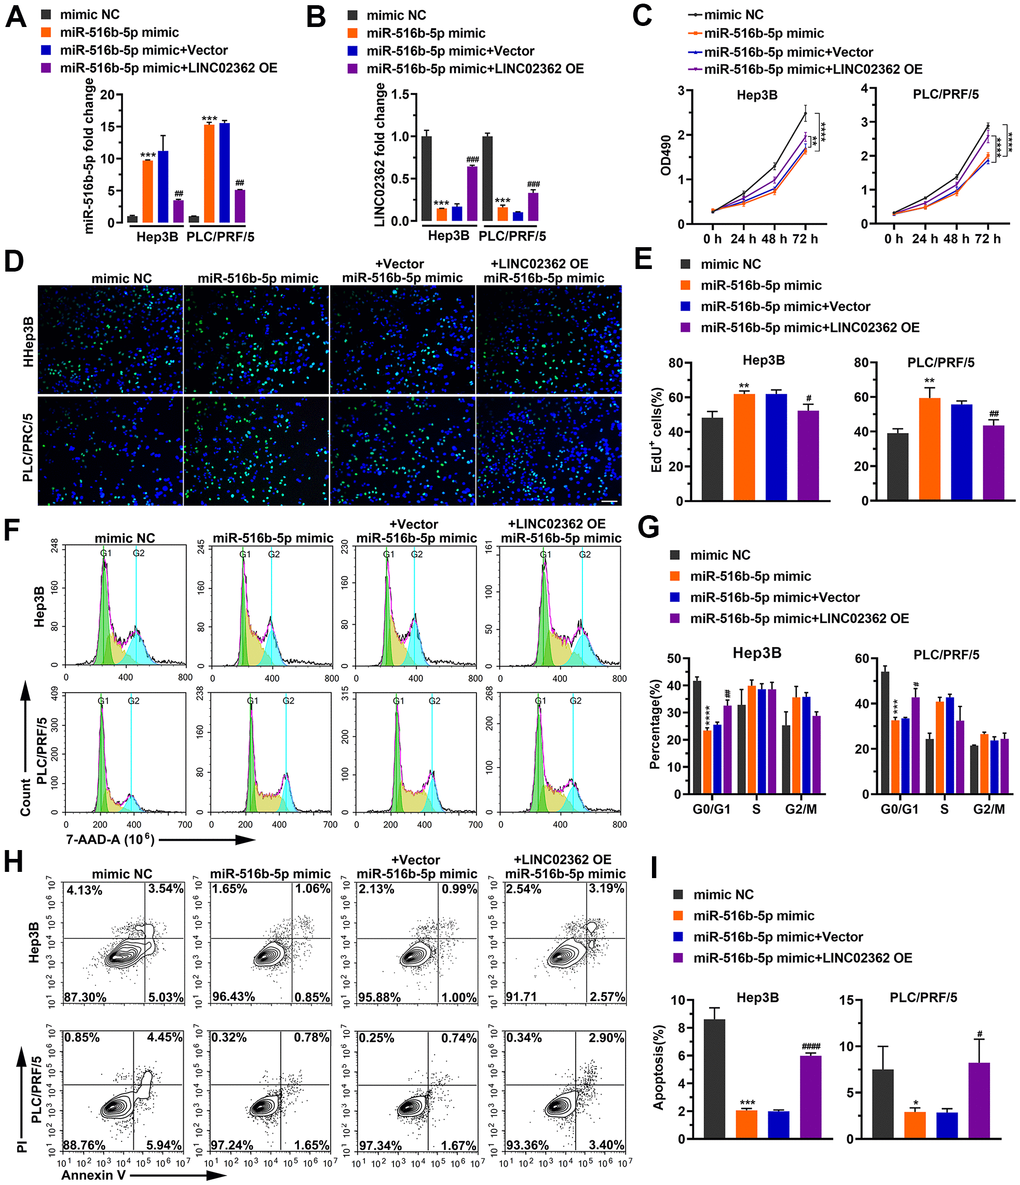
Figure 5. LINC02362 sponges miR-516b-5p to mitigate the enhancement of HCC cell survival. (A, B) RT-qPCR quantification of miR-516b-5p (A) and LINC02362 (B) expression in Hep3B and PLC/PRF/5 cells (n=3). (C) MTT assay (n=3) for measuring the proliferative abilities of HCC cells overexpressing miR-516b-5p and/or LINC02362. (D, E) EdU labeling to detect the percentage of dividing cells in LINC02362 and miR-516b-5p-overexpressing HCC cells (D) and the corresponding quantification (E; n=3). Bar=100μm. (F, G) Measurement (F) and quantification (G; n=3) of the cell cycle in HCC cells by flow cytometry. (H, I) Detection (H) and quantification (I; n=3) of apoptotic cells in HCC cells overexpressing LINC02362 and miR-516b-5p. * or # 0.01 < P < 0.05, ** or ## 0.001 < P < 0.01, *** or ### 0.0001 < P < 0.001, **** or #### P < 0.0001.
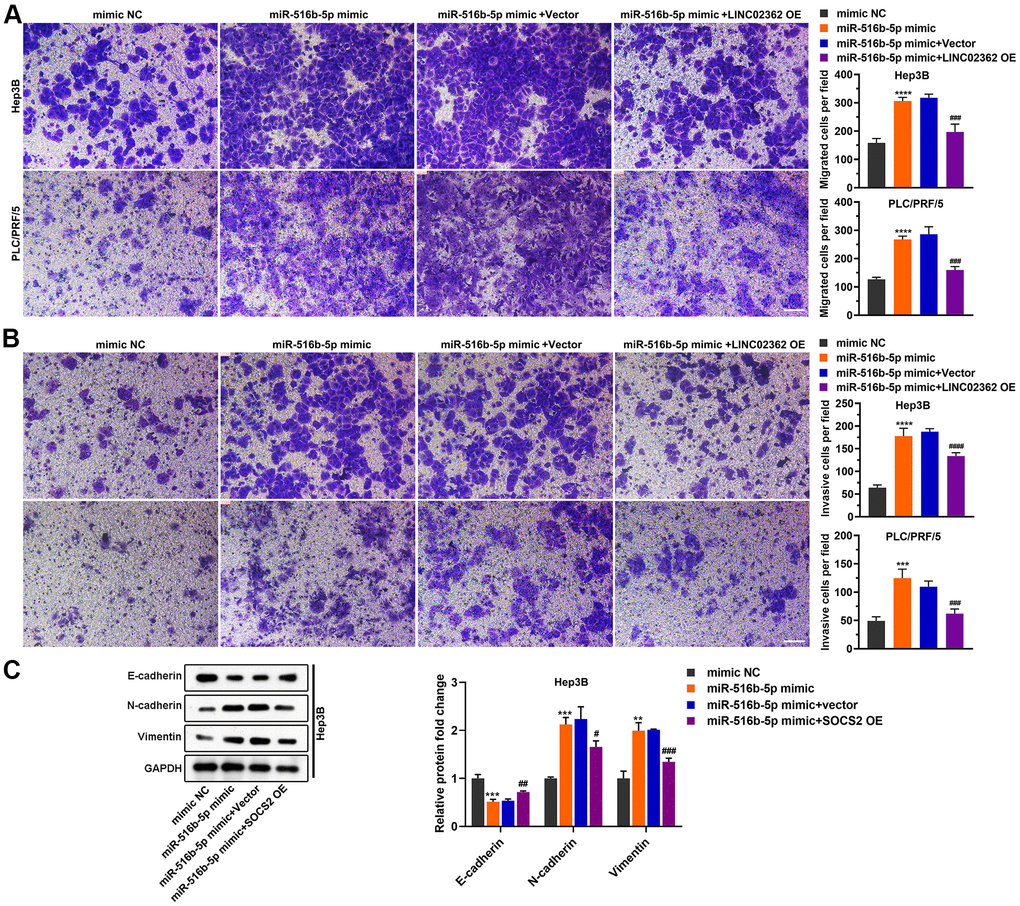
Figure 6. LINC02362 sponges miR-516b-5p to attenuate the augment of HCC cell migration and invasion. (A) Transwell assays to test the effects of LINC02362 and miR-516b-5p overexpression on HCC cell migration. Representative images (left) and quantification (right; n=3) are shown. (B) Transwell assays to test the effects of LINC02362 and miR-516b-5p overexpression on HCC cell invasion. Representative images (left) and quantification (right; n=3) are shown. (C) Representative images (left) and quantification (right; n=3) of western blotting analysis for detecting the levels of EMT markers in Hep3B cells. # 0.01 < P < 0.05, ** or ## 0.001 < P < 0.01, *** or ### 0.0001 < P < 0.001, **** or #### P < 0.0001.
The effects of LINC02362 on HCC cells are dependent on miR-516b-5p
To examine whether miR-516b-5p is critical for the effects of LINC02362 on HCC cells, we ectopically expressed miR-516b-5p in HCC cells with LINC02362 overexpression. Interestingly, we observed that the inhibition of cell proliferation, migration, invasion and EMT as well as the promotion of cell cycle arrest and apoptosis imposed by LINC02362 were restored when miR-516b-5p was re-expressed (Figures 7, 8). Collectively, we confirmed that the tumor-suppressive roles of LINC02362 on HCC cells is highly dependent on the inhibition of miR-516b-5p.
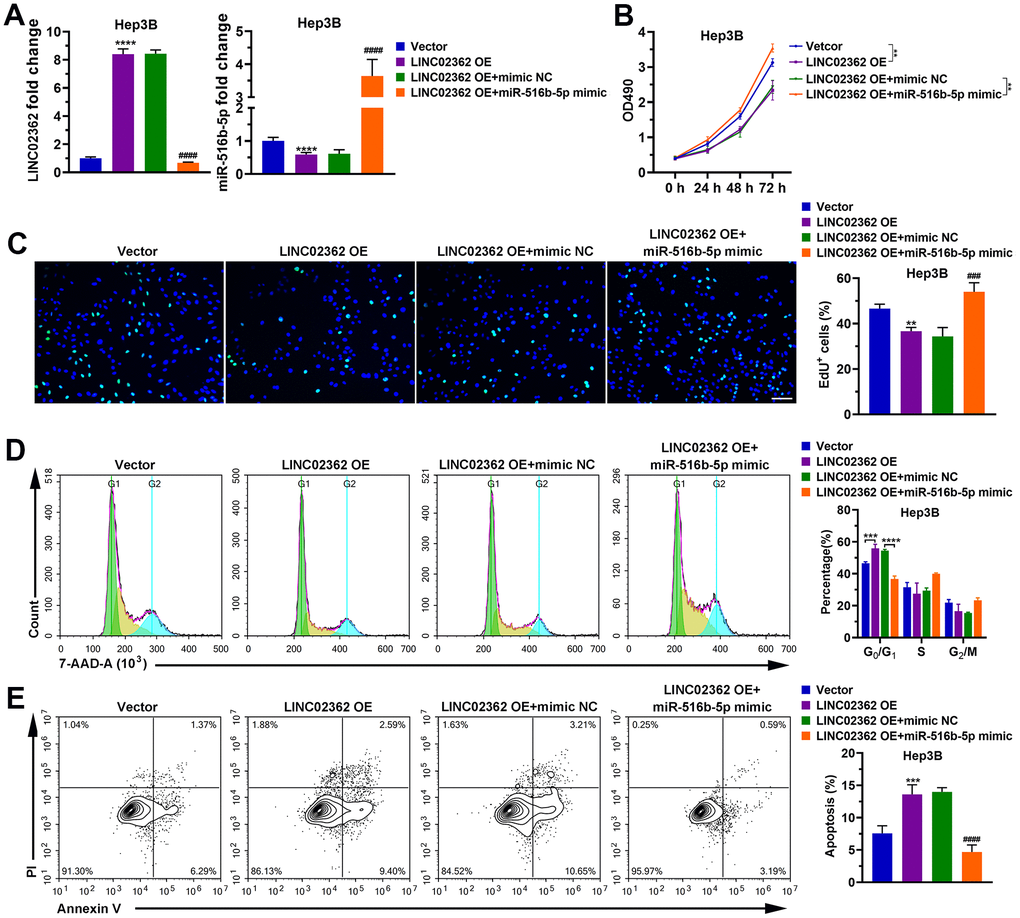
Figure 7. miR-516b-5p is critical for the effects of LINC02362 on HCC cell survival. (A) RT-qPCR quantification of miR-516b-5p (left) and LINC02362 (right) expression in Hep3B and PLC/PRF/5 cells (n=3). (B) MTT assay (n=3) for measuring the proliferative abilities of HCC cells overexpressing miR-516b-5p and/or LINC02362. (C) EdU labeling to detect the percentage of dividing cells in LINC02362 and miR-516b-5p-overexpressing HCC cells (left) and the corresponding quantification (right; n=3). Bar=100μm. (D) Measurement (left) and quantification (right; n=3) of the cell cycle in HCC cells by flow cytometry. (E) Detection (left) and quantification (right; n=3) of apoptotic cells in HCC cells overexpressing LINC02362 and miR-516b-5p. ** 0.001 < P < 0.01, *** or ### 0.0001 < P < 0.001, **** or #### P < 0.0001.
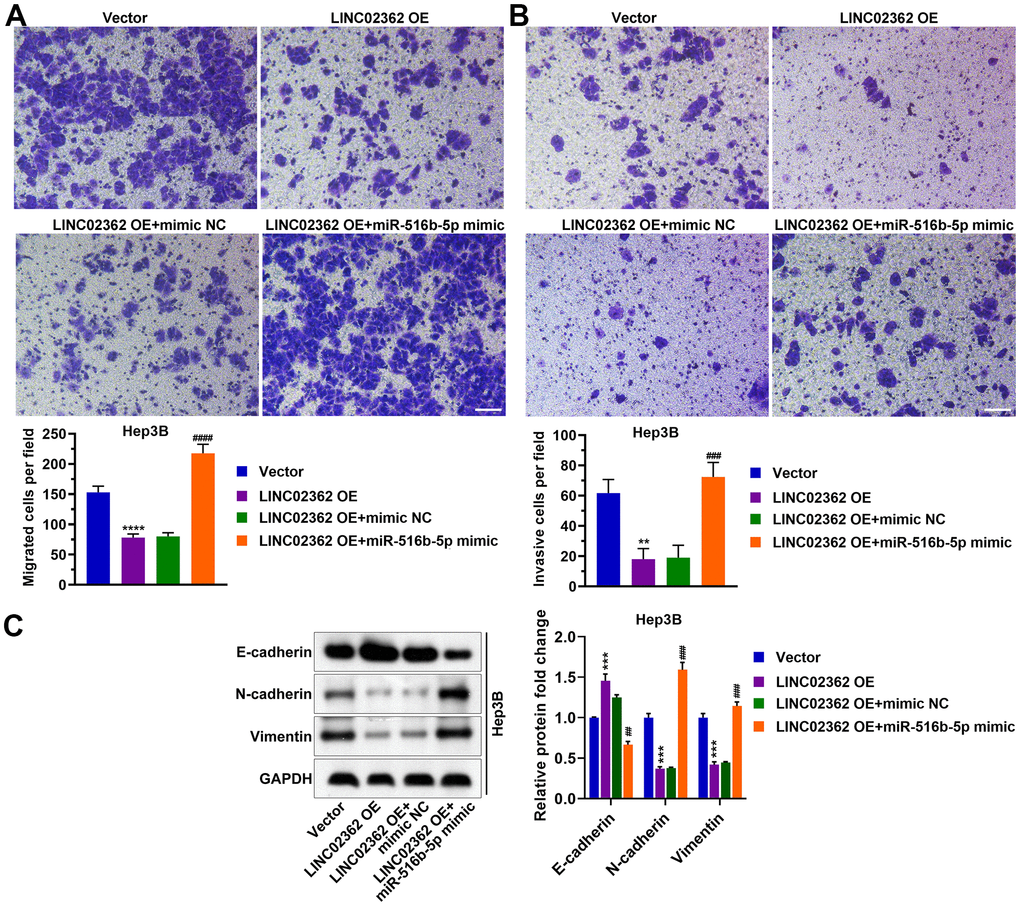
Figure 8. miR-516b-5p is pivotal for the effects of LINC02362 on the migration, invasion and EMT of HCC cells. (A) Transwell assays to test the effects of LINC02362 and miR-516b-5p overexpression on HCC cell migration. Representative images (left) and quantification (right; n=3) are shown. (B) Transwell assays to test the effects of LINC02362 and miR-516b-5p overexpression on HCC cell invasion. Representative images (left) and quantification (right; n=3) are shown. (C) Representative images (left) and quantification (right; n=3) of western blotting analysis for detecting the levels of EMT markers in Hep3B cells. ** or ## 0.001 < P < 0.01, *** or ### 0.0001 < P < 0.001, **** P < 0.0001.
SOCS2 is a downstream gene of miR-516b-5p
Since miRNAs exert their functions by binding to and inhibiting the stability of specific mRNAs [22], we then predicted candidate target mRNAs of miR-516b-5p. Upon performing overlap analysis based on five databases, SOCS2 was enriched as the sole potential hit downstream of miR-516b-5p (Figure 9A). The following reporter assay indicated that miR-516b-5p suppressed the activity of wild-type but not the mutant SOCS2 3’UTR element (Figure 9B, 9C). RT-qPCR and western blotting analysis further validated the inhibition of miR-516b-5p on SOCS2 at both mRNA and protein levels (Figure 9D, 9E). Moreover, data from patients with HCC revealed a negative correlation between miR-516b-5p and SOCS2 levels, which supported the reversely regulatory relationship between these two molecules (Figure 9F). Since we have proved that miR-516b-5p is a downstream effector of LINC02362 (Figures 4, 5), the expression of SOCS2, a target mRNA of miR-516b-5p, might be indirectly regulated by LINC02362. As expected, both mRNA and protein of SOCS2 were upregulated by LINC02362 ectopic expression and downregulated by LINC02362 depletion (Figure 9G, 9H). The positive correlation between LINC02362 and SOCS2 was confirmed in the HCC patients as well (Figure 9I). Furthermore, the data also showed that SOCS2 mRNA levels were decreased in HCC samples compared with non-tumor samples (Figure 9J). Interestingly, low levels of SOCS2 were shown to be associated with worse outcomes in HCC patients (Figure 9K, 9L). In summary, we identified SOCS2 as a direct target gene of miR-516b-5p and as an indirect target gene of LINC02362.
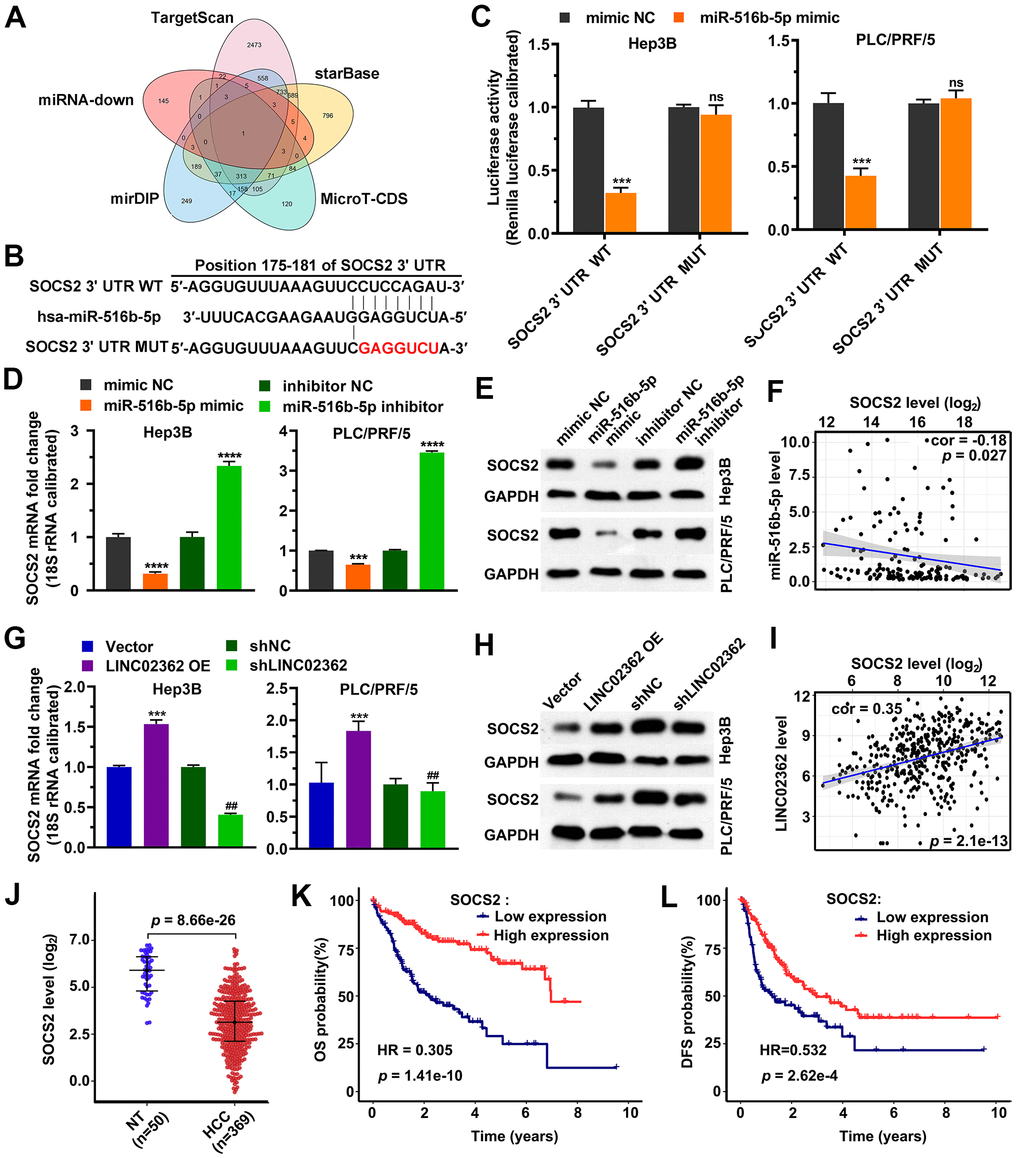
Figure 9. SOCS2 is a downstream target gene of miR-516b-5p. (A) Venn diagram indicating the overlap between the indicated 5 databases. (B) Schematic plot expressing the putative binding site between miR-516b-5p and SOCS2 and the sequences upon mutagenesis. (C) Dual luciferase assays (n=3) for checking the effects of miR-516b-5p on the indicated 3’UTR constructs. (D, E) RT-qPCR (D) and western blotting (E) detection (n=3) of the SOCS2 expression upon misexpression of miR-516b-5p. (F) Scatter plot showing the correlation between miR-516b-5p and SOCS2. (G, H) RT-qPCR (G) and western blotting (H) detection (n=3) of the SOCS2 expression upon misexpression of LINC02362. (I) Scatter plot showing the correlation between LINC02362 and SOCS2. (J) Data mining to check the levels of SOCS2 in non-tumor (NT; n=50) or HCC tissues (n=369). (K, L) Kaplan-Meier plots showing the overall survival (OS, K) or disease-free survival (DFS, L) of HCC patients stratified by SOCS expression. ## 0.001 < P < 0.01, *** 0.0001 < P < 0.001, **** P < 0.0001. NS, not significant.
SOCS2 contributes to the tumor-suppressive function of LINC02362
To determine whether SOCS2 is a key indirect target of LINC02362 during the mitigation of HCC progression, we performed a series of rescue experiments. Results from RT-qPCR indicated that knockdown of SOCS2 did not change the expression of LINC02362, suggesting that LINC02362 could not be regulated by SOCS2 (Figure 10A). However, when SOCS2 was depleted, the inhibitory effects of LINC02362 on HCC cell proliferation and cell cycle progression were attenuated, as demonstrated by MTT and EdU staining (Figure 10B–10H). On the contrary, the promotion of cell apoptosis by LINC02362 was rescued upon the knockdown of SOCS2 (Figure 10I, 10J). Moreover, SOCS2 depletion also mitigated the suppressive effects of LINC02362 on HCC cell migration, invasion and EMT (Figure 11A–11C). In conclusion, our data revealed that SOCS2 is an indirect downstream target gene of LINC02362 that inhibits HCC progression.
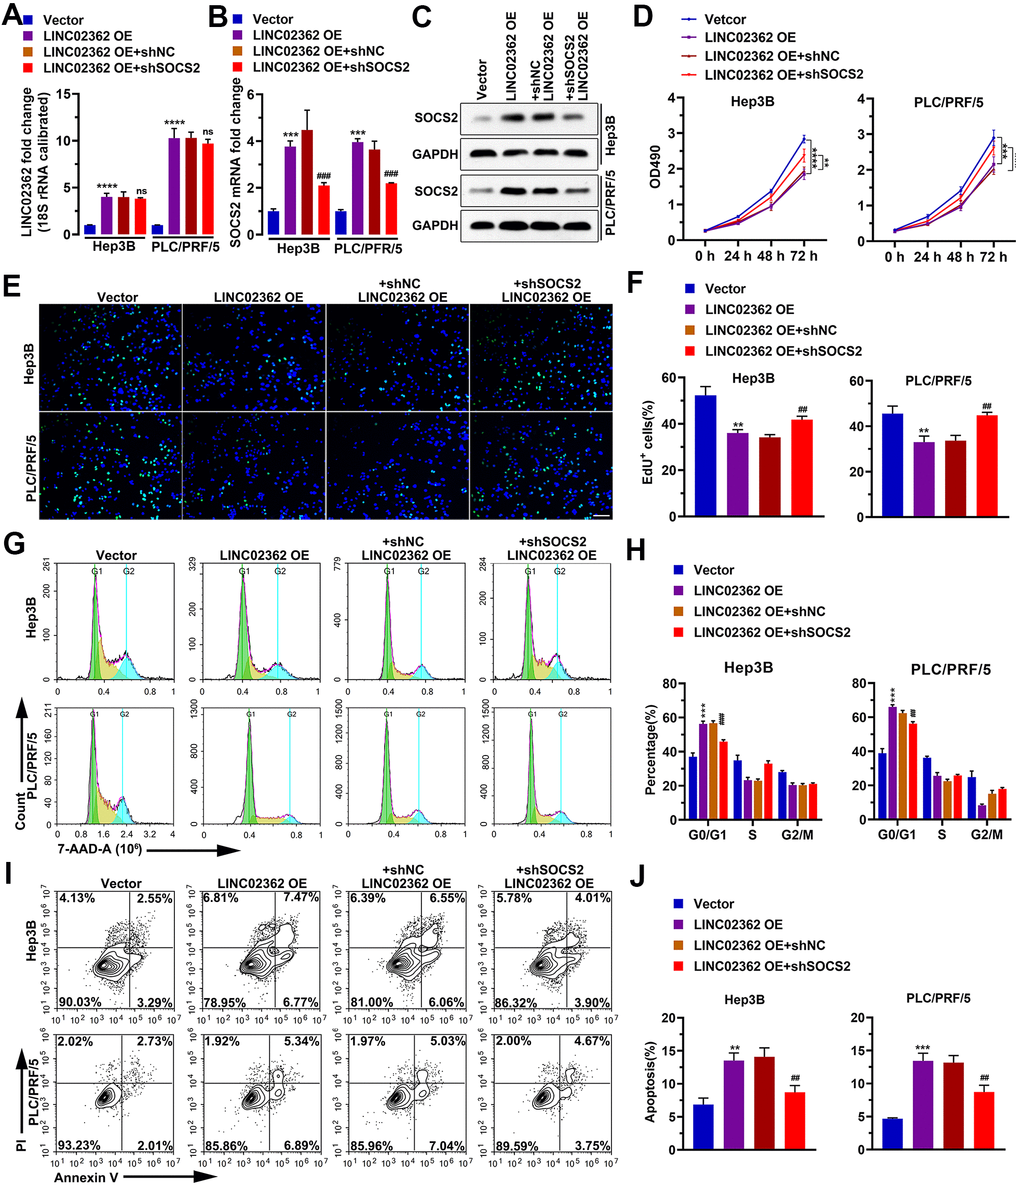
Figure 10. SOCS2 mediates the inhibitory effects of LINC02362 on HCC cell survival. (A, B) RT-qPCR quantification (n=3) of LINC02362 (A) and SOCS2 (B) expression in Hep3B and PLC/PRF/5 cells. (C) Quantification of SOCS2 levels by western blotting (n=3) with LINC02362 and SOCS2 misexpression. (D) MTT assay (n=3) for measuring the proliferative abilities of HCC cells with LINC02362 and SOCS2 misexpression. (E, F) EdU labeling to detect the percentage of dividing cells in LINC02362 and SOCS2 misexpressing HCC cells (E) and the corresponding quantification (F; n=3). Bar=100μm. (G, H) Measurement (G) and quantification (H; n=3) of the cell cycle in HCC cells by flow cytometry. (I, J) Detection (I) and quantification (J; n=3) of apoptotic cells in HCC cells misexpressing LINC02362 and SOCS2. # 0.01 < P < 0.05, ** or ## 0.001 < P < 0.01, *** or ### 0.0001 < P < 0.001, **** P < 0.0001. NS, not significant.
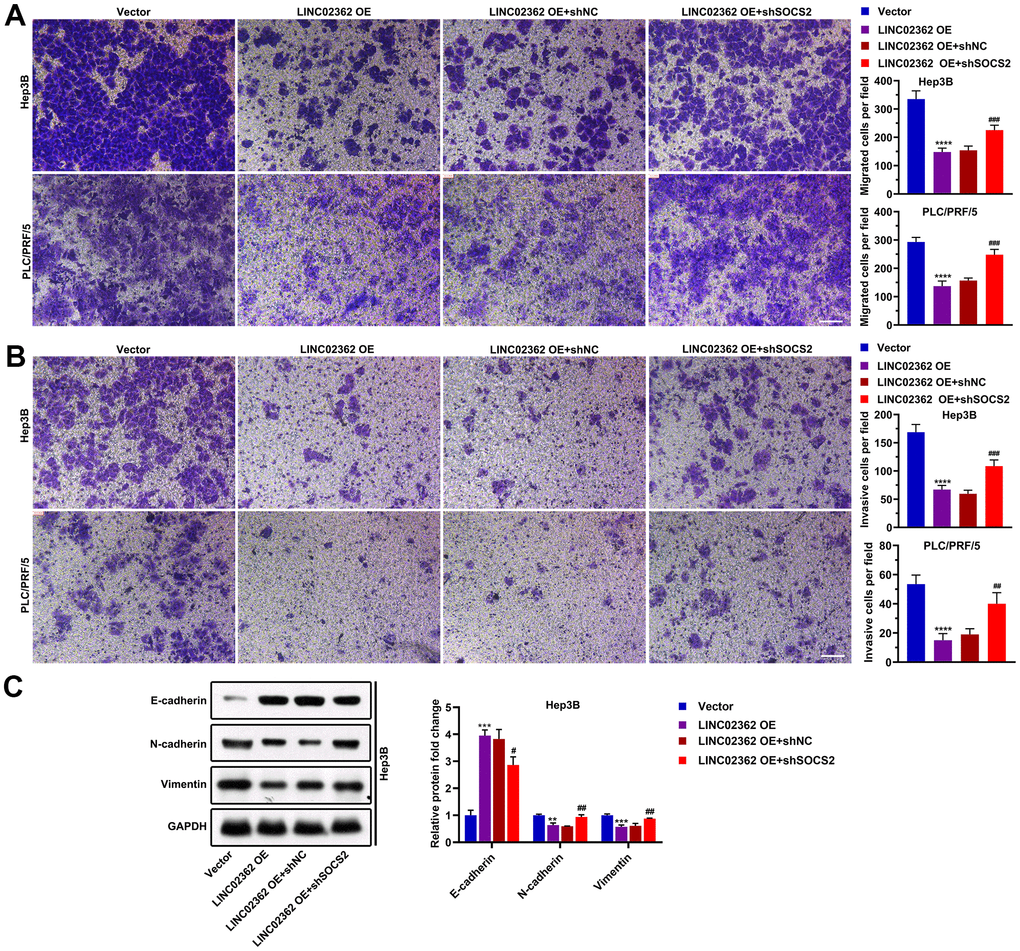
Figure 11. SOCS2 is critical for the suppressive effects of LINC02362 on HCC cell migration, invasion and EMT. (A) Transwell assays for testing the effects of LINC02362 and SOCS2 misexpression on HCC cell migration. Representative pictures (left) and quantification (right; n=3) are shown. (B) Transwell assays for testing the effects of LINC02362 and SOCS2 misexpression on HCC cell invasion. Representative pictures (left) and quantification (right; n=3) are shown. (C) Representative images (left) and quantification (right; n=3) of western blotting analysis for detecting the levels of EMT markers in Hep3B cells. ## 0.001 < P < 0.01, *** or ### 0.0001 < P < 0.001, **** P < 0.0001.
Discussion
In the present study, we unveil LINC02362 as a novel tumor-inhibitory lncRNA by directly sponging miR-516b-5p and indirectly increasing the levels of SOCS2, leading to the attenuation of proliferation and metastasis as well as the augment of apoptosis in HCC cells (Figure 12). Datamining analyses are first exploited to assess the clinical significance of LINC02362 in HCC. In Figure 1E, we find that the levels of LINC02362 are upregulated in Child-Pugh grade C subgroup compared with stage A and B, which seems to be conflicted with our hypothesis. However, this might be because that only one patient is included in the grade C subclass, which cannot provide strong evidence of the clinical significance of LINC02362. To better understand the clinical value of LINC02362, we will generate our own cohort of HCC patients and apply the clinical information for further checking the correlation between LINC02362 and HCC patient survival to determine whether it can be used as a prognostic biomarker.
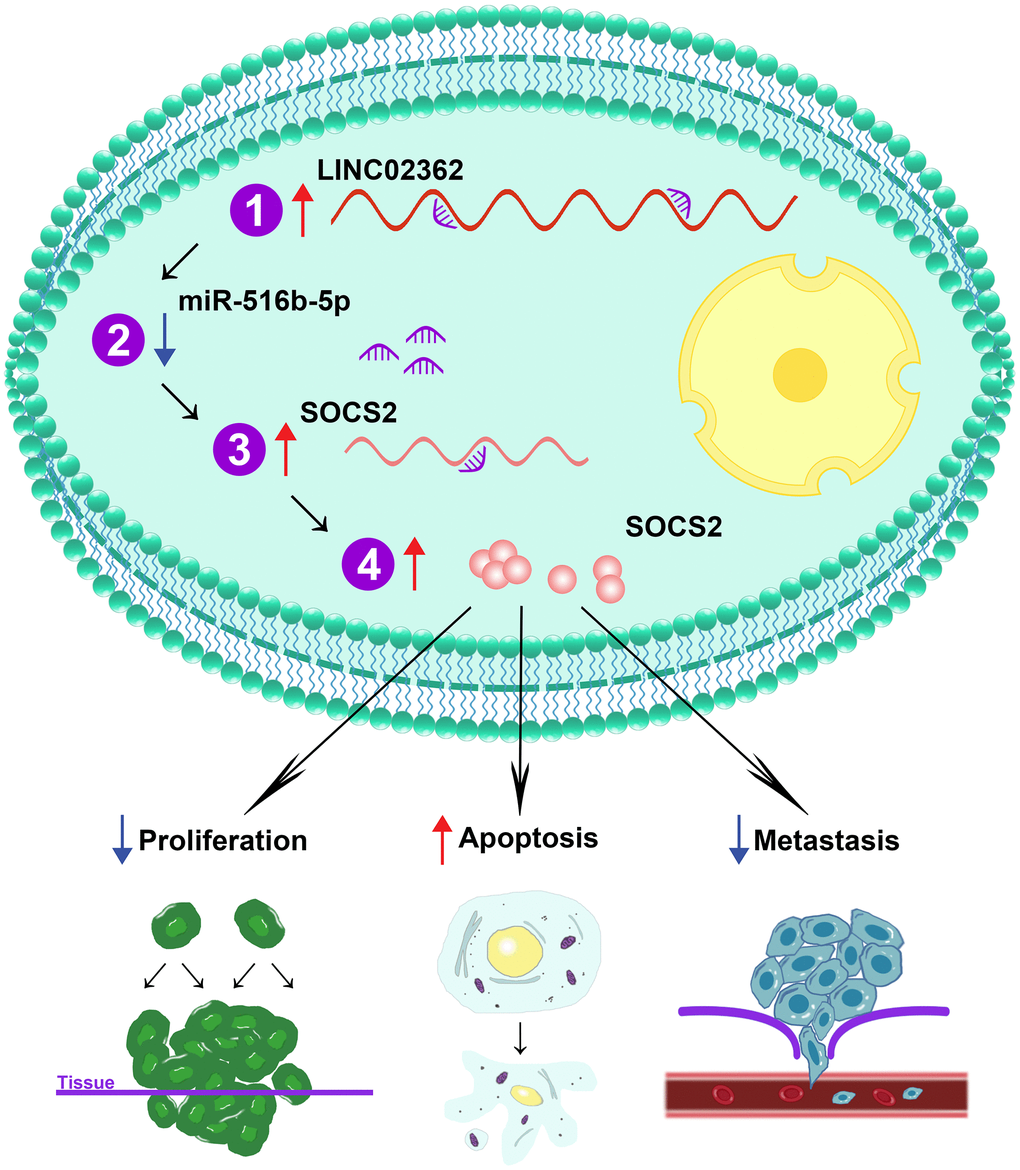
Figure 12. Schematic working model of LINC02362/miR-516b-5p/SOCS2 axis on HCC progression. Schematic model showing the mechanism how the LINC02362/miR-516b-5p/SOCS2 axis regulate the HCC progression. Upon the upregulation of LINC02362, downstream target miRNA miR-516b-5p is sponged and the levels are decreased in the HCC cells. As miR-516b-5p is a negative regulator of SOCS2, the SOCS2 mRNA and protein levels are enhanced by LINC02362, resulting in the mitigation of cell proliferation and metastasis and augment of cell apoptosis of HCC cells.
The clinical significance of LINC02362 is demonstrated in details by data mining, which provides an ideal candidate lncRNA for HCC prognosis. However, further investigations are required to better understand whether this lncRNA is eligible to serve as a biomarker. For example, it is of great significance to study the prognostic value of LINC02362 in different subgroups of HCC in order to get more hints on which subset of patients can benefit from the therapeutic applications based on LINC02362.
LINC02362 is a 766 nt lncRNA whose biological function has not been well-investigated. Here, we confirmed its cytoplasmic localization and the ceRNA mechanism. Many studies have shown that the interacting proteins are pivotal partners of one specific lncRNA in the regulation of cellular processes as well [23–26]. For instance, NKILA was proved to interact with the NF-κB complex in the cytosol to regulate the progression of breast cancer cells [23]. To fully mine the partners of LINC02362, systematic and unbiased approaches are required. For example, mass spectrum analysis can be exploited to screen the interacting proteins of LINC02362 upon the RNA pull-down by LINC02362 probes. In addition, RNA sequencing can be applied to uncover the downstream genes of LINC02362, which can be further used to enrich the pathways modulated by LINC02362.
Importantly, despite one lncRNA may have multiple miRNA targets, we enrich miR-516b-5p as a target miRNA of LINC02362 via an unbiased method in which we take three independent databases into consideration. Although no significant association is observed between miR-516b-5p and LINC02362, there is indeed an inverse correlation trend between these two molecules (Figure 4G). Moreover, we validate that miR-516b-5p is a tumor-supporting miRNA in Figures 5, 6. To further ask the correlation between miR-516b-5p and LINC02362, it is worthy to test their expression in more HCC samples and preferably in our own cohort. Moreover, although the tumor-suppressive effects of LINC02362 and the tumor-promoting effects of miR-516b-5p were determined by in vitro assays, we believe that extra results from in vivo models such as mice xenograft models may further confirm our conclusion.
We show that LINC02362 inhibits HCC progression via enhancing the level of SOCS2, which is accomplished by sponging miR-516b-5p. SOCS2 has been proved to act as a pivotal tumor suppressor in various types of cancer. SOCS2 was confirmed to suppresses HCC cell proliferation, migration, and stemness recently [27]. However, the expression pattern and biological functions of SOCS2 remains investigated. In this study, we link the underlying mechanism of LINC02362 and miR-516-5p with SOCS2, which adds another layer of regulation to the alteration of SOCS2 expression.
In summary, we identify LINC02362 as an HCC-suppressive lncRNA that may be developed as a biomarker for HCC prognosis and a therapeutic agent. The miR-516b-5p/SOCS2 axis is uncovered as the mechanism by which LINC02362 regulate HCC progression, which offers a paradigm for investigating the regulatory mechanisms of lncRNAs in biological processes.
Materials and Methods
Datamining
RNA sequencing data of HCC patients (n=369) and non-tumor tissues (n=50) were downloaded from the TCGA-LIHC database (https://portal.gdc.cancer.gov/). The clinical survival data, parameters, and mRNA and miRNA sequencing data of HCC patients were obtained from the UCSC Xena platform (https://tcga.xenahubs.net). The normalization of all sequencing data and differentially expressed genes were analyzed by R edgeR package (version 3.30.3). The threshold was |log2FC(fold change)| > 1 and FDR < 0.05. Patient survival analyses were performed using the Kaplan-Meier curve R survival package (Version 3.1 12). The p value was calculated by Log Rand test.
Cell culture
HEK293T, Hep3B, and PLC/PRF/5 cells were purchased from the American Type Culture Collection (ATCC). All the cells were maintained in Dulbecco’s modified Eagle’s medium (DMEM; Thermo Fisher; 41966029) supplemented with 10% fetal bovine serum (FBS; Thermo Fisher; 26140079) and kept in a humidified incubator with 5% CO2 at 37° C, and were routinely checked for mycoplasma free.
Real-time quantitative PCR (RT-qPCR)
Total RNA was extracted using TRIzol reagent (Invitrogen; 15596026). After measuring the RNA levels, the same amount of RNA (100 ng-1 μg) was reversely transcribed into cDNA using the RevertAid First Strand cDNA Synthesis Kit (Thermo Fisher; K1621). Subsequently, cDNAs were diluted five times with H2O and applied for qPCR together with the corresponding primers and SYBR Green PCR Master Mix (Thermo Fisher; 4309155) in the CFX-96 machine (Bio-Rad). All primers used in this study are listed in Supplementary Table 1. 18S RNA was set as a reference transcript to calibrate the relative expression of each gene according to the 2 -ΔΔCt formula.
5-ethnyl-2 deoxyuridine (EdU) incorporation assays
EdU experiments were performed by applying an EdU Apollo 488 kit (RiboBio; C10310-1). Briefly, cells were seeded in wells of 24-well plate. The next day, cells were treated with EdU (50 μM) and kept in the incubator for 4 h. Subsequently, cells were fixed and treated with glycine, followed by permeabilization with 0.5% Triton X-100 in PBS for 5 min, and stained according to the manufacturer’s instructions.
Flow cytometry analyses
For cell cycle analyses, 70% ethanol was applied to fix cells at 4° C overnight. Cells were then washed and treated with propidium iodide (Sigma; P4170; 50 μg/mL) and RNase A (Thermo Fisher; R1253) for 30 min at 37° C. Finally, at least 1 × 10⁴ cells were captured using a flow cytometer (BD Biosciences). For apoptosis detection, the Annexin V-FITC/PI Apoptosis Detection Kit (Sigma; APOAF-60TST). The signal cells were collected and washed twice with PBS. Afterwards, cells were then stained with Annexin V-FITC and PI according to the manufacturer’s instructions for 15 min at RT in the dark. The aforementioned flow cytometer was used to capture the signals from cells, and all data were quantified using the Flowjo software.
Transwell assays
Cell migration and invasion were performed based on the Corning® Transwell® polycarbonate membrane cell culture inserts with 8.0 μm pore size (Merck; CLS3422-48EA). Briefly, 5 × 10⁴ Hep3B and PLC/PRF/5 cells were seeded in the top insert after 48 h of transfection with the indicated plasmids or miRNA mimics. At 48 h post-seeding, cells on the top flat were removed using a swab, while cells on the bottom flat were fixed with 4% PFA and stained with 0.1% crystal violet. Stained cells were photographed and counted under a microscope.
Subcellular fractionation
Hep3B or PLC/PRF/5 cells (1 × 10⁶ cells) were collected after trypsinization. Subsequently, nuclear or cytosolic compartments were obtained using the PARIS™ Kit (Thermo Fisher; AM1921) according to the manufacturer’s instructions. The same amount of RNA was subjected to cDNA synthesis and RT-qPCR analyses.
RNA fluorescent in situ hybridization (FISH)
To check the localization of circ0007360, we applied the RNA FISH method. The whole procedure was done based on the instructions from the Fluorescent in situ Hybridization Kit (Rabobio; C10910). The probes were also ordered from Rabobio as follows: FISH Probe Mix (Red; Rabobio; C10920), h-U6 FISH Probe Mix (Red) (Rabobio; LNC110101), h-18S FISH Probe Mix (Red; Rabobio; LNC110201).
Dual luciferase reporter assays
Before the day of transfection, 1 x 10⁵ Hep3B or PLC/PRF/5 cells were seeded in wells of a 24-well plate. The next day, luciferase containing plasmids encoding the indicated 3’UTR regions or miRNA mimics were transfected into the cells using Lipofectamine 3000. Two days post-transfection, cells were lysed using passive lysis buffer, and the lysates were used to measure Firefly and Renilla luciferase activities using the Dual-Luciferase® Reporter Assay kit (Promega; E1910). Renilla luciferase activity was used for the normalization of relative luciferase activity.
MTT analyses
MTT assays were performed to determine the viability of HCC cells. Briefly, 1 × 10³ Hep3B or PLC/PRF/5 cells were seeded in wells of 96-well plates in six replicates. At each time point, 10 μL MTT reagent (0.5 mg/ml at final concentration) was added to each well. After incubating the plates at 37° C for 4 h, the remaining medium was replaced with 100 μL DMSO to dissolve the cell contents. The absorbance values were measured using a plate reader at 490 nm wavelength.
Western blotting
In brief, cells were lysed in RIPA buffer (Beyotime; P0013B) on ice for 20 min, followed by centrifugation. Total protein levels were quantified using a Pierce™ BCA Protein Assay Kit (Thermo Fisher; 23225). Next, the same amount of protein was separated by SDS-PAGE and transferred to a PVDF membrane. The membranes were then blocked with 5% milk in TBST, followed by incubation with primary antibodies (Supplementary Table 2) at 4° C overnight. After washing with TBST, the blots were incubated with the corresponding secondary antibodies. Finally, ECL substrate (Thermo Fisher; 32209) was used to expose the blots, and the films were subjected to signal capture.
Statistical analyses
All data are expressed as the mean ± standard deviation. Student’s t test was used to analyze the statistical significance using GraphPad software. P < 0.05 was considered statistically significant (*0.01 < P < 0.05, **0.001 < P < 0.01, ***0.0001 < P < 0.001, ****P < 0.0001). NS, not significant.
Author Contributions
D.L. and T.Z. designed and performed the experiments, analyzed and interpreted the results and created the Figures. Y.L. helped with molecular cloning and confocal microscopy analyses. Y.X. and X.C. helped with the analysis of HCC cancer patient data. J.C. and W.Z. directed the research. D.L. and W.Z. wrote the manuscript. W.Z. supervised the project. All authors revised the content and approved the final manuscript.
Conflicts of Interest
The authors declare that they have no conflicts of interest.
Funding
Our study was supported by Sanming Project of Medicine in Shenzhen (SZSM201612071), Shenzhen Key Medical Discipline Construction Fund (SZXK078) and the Cell Technology Center and Transformation Base, Innovation Center of Guangdong-Hong Kong-Macao Greater Bay Area, Ministry of Science and Technology of China (Grant No. YCZYPT[2018]03-1).
Editorial Note
This corresponding author has a verified history of publications using a personal email address for correspondence
References
- 1. Villanueva A. Hepatocellular Carcinoma. N Engl J Med. 2019; 380:1450–62. https://doi.org/10.1056/NEJMra1713263 [PubMed]
- 2. Craig AJ, von Felden J, Garcia-Lezana T, Sarcognato S, Villanueva A. Tumour evolution in hepatocellular carcinoma. Nat Rev Gastroenterol Hepatol. 2020; 17:139–52. https://doi.org/10.1038/s41575-019-0229-4 [PubMed]
- 3. Hombach S, Kretz M. Non-coding RNAs: Classification, Biology and Functioning. Adv Exp Med Biol. 2016; 937:3–17. https://doi.org/10.1007/978-3-319-42059-2_1 [PubMed]
- 4. Batista PJ, Chang HY. Long noncoding RNAs: cellular address codes in development and disease. Cell. 2013; 152:1298–307. https://doi.org/10.1016/j.cell.2013.02.012 [PubMed]
- 5. Schmitt AM, Chang HY. Long Noncoding RNAs in Cancer Pathways. Cancer Cell. 2016; 29:452–63. https://doi.org/10.1016/j.ccell.2016.03.010 [PubMed]
- 6. Lin C, Yang L. Long Noncoding RNA in Cancer: Wiring Signaling Circuitry. Trends Cell Biol. 2018; 28:287–301. https://doi.org/10.1016/j.tcb.2017.11.008 [PubMed]
- 7. Kondo Y, Shinjo K, Katsushima K. Long non-coding RNAs as an epigenetic regulator in human cancers. Cancer Sci. 2017; 108:1927–33. https://doi.org/10.1111/cas.13342 [PubMed]
- 8. Wang Y, Chen F, Zhao M, Yang Z, Li J, Zhang S, Zhang W, Ye L, Zhang X. The long noncoding RNA HULC promotes liver cancer by increasing the expression of the HMGA2 oncogene via sequestration of the microRNA-186. J Biol Chem. 2017; 292:15395–407. https://doi.org/10.1074/jbc.M117.783738 [PubMed]
- 9. Adams BD, Kasinski AL, Slack FJ. Aberrant regulation and function of microRNAs in cancer. Curr Biol. 2014; 24:R762–76. https://doi.org/10.1016/j.cub.2014.06.043 [PubMed]
- 10. Yuan JH, Yang F, Wang F, Ma JZ, Guo YJ, Tao QF, Liu F, Pan W, Wang TT, Zhou CC, Wang SB, Wang YZ, Yang Y, et al. A long noncoding RNA activated by TGF-β promotes the invasion-metastasis cascade in hepatocellular carcinoma. Cancer Cell. 2014; 25:666–81. https://doi.org/10.1016/j.ccr.2014.03.010 [PubMed]
- 11. Xu D, Yang F, Yuan JH, Zhang L, Bi HS, Zhou CC, Liu F, Wang F, Sun SH. Long noncoding RNAs associated with liver regeneration 1 accelerates hepatocyte proliferation during liver regeneration by activating Wnt/β-catenin signaling. Hepatology. 2013; 58:739–51. https://doi.org/10.1002/hep.26361 [PubMed]
- 12. Wang Y, Zhu P, Wang J, Zhu X, Luo J, Meng S, Wu J, Ye B, He L, Du Y, He L, Chen R, Tian Y, Fan Z. Long noncoding RNA lncHand2 promotes liver repopulation via c-Met signaling. J Hepatol. 2018; 69:861–72. https://doi.org/10.1016/j.jhep.2018.03.029 [PubMed]
- 13. Letellier E, Haan S. SOCS2: physiological and pathological functions. Front Biosci (Elite Ed). 2016; 8:189–204. https://doi.org/10.2741/E760 [PubMed]
- 14. Qiu X, Zheng J, Guo X, Gao X, Liu H, Tu Y, Zhang Y. Reduced expression of SOCS2 and SOCS6 in hepatocellular carcinoma correlates with aggressive tumor progression and poor prognosis. Mol Cell Biochem. 2013; 378:99–106. https://doi.org/10.1007/s11010-013-1599-5 [PubMed]
- 15. Huang Z, Zhou JK, Peng Y, He W, Huang C. The role of long noncoding RNAs in hepatocellular carcinoma. Mol Cancer. 2020; 19:77. https://doi.org/10.1186/s12943-020-01188-4 [PubMed]
- 16. Huang X, Gao Y, Qin J, Lu S. lncRNA MIAT promotes proliferation and invasion of HCC cells via sponging miR-214. Am J Physiol Gastrointest Liver Physiol. 2018; 314:G559–G565. https://doi.org/10.1152/ajpgi.00242.2017 [PubMed]
- 17. Özdemir F, Baskiran A. The Importance of AFP in Liver Transplantation for HCC. J Gastrointest Cancer. 2020; 51:1127–32. https://doi.org/10.1007/s12029-020-00486-w [PubMed]
- 18. Erstad DJ, Tanabe KK. Prognostic and Therapeutic Implications of Microvascular Invasion in Hepatocellular Carcinoma. Ann Surg Oncol. 2019; 26:1474–93. https://doi.org/10.1245/s10434-019-07227-9 [PubMed]
- 19. Pastushenko I, Blanpain C. EMT Transition States during Tumor Progression and Metastasis. Trends Cell Biol. 2019; 29:212–26. https://doi.org/10.1016/j.tcb.2018.12.001 [PubMed]
- 20. Statello L, Guo CJ, Chen LL, Huarte M. Gene regulation by long non-coding RNAs and its biological functions. Nat Rev Mol Cell Biol. 2021; 22:96–118. https://doi.org/10.1038/s41580-020-00315-9 [PubMed]
- 21. Rashid F, Shah A, Shan G. Long Non-coding RNAs in the Cytoplasm. Genomics Proteomics Bioinformatics. 2016; 14:73–80. https://doi.org/10.1016/j.gpb.2016.03.005 [PubMed]
- 22. Pasquinelli AE. MicroRNAs and their targets: recognition, regulation and an emerging reciprocal relationship. Nat Rev Genet. 2012; 13:271–82. https://doi.org/10.1038/nrg3162 [PubMed]
- 23. Liu B, Sun L, Liu Q, Gong C, Yao Y, Lv X, Lin L, Yao H, Su F, Li D, Zeng M, Song E. A cytoplasmic NF-κB interacting long noncoding RNA blocks IκB phosphorylation and suppresses breast cancer metastasis. Cancer Cell. 2015; 27:370–81. https://doi.org/10.1016/j.ccell.2015.02.004 [PubMed]
- 24. Hosono Y, Niknafs YS, Prensner JR, Iyer MK, Dhanasekaran SM, Mehra R, Pitchiaya S, Tien J, Escara-Wilke J, Poliakov A, Chu SC, Saleh S, Sankar K, et al. Oncogenic Role of THOR, a Conserved Cancer/Testis Long Non-coding RNA. Cell. 2017; 171:1559–72.e20. https://doi.org/10.1016/j.cell.2017.11.040 [PubMed]
- 25. Grelet S, Link LA, Howley B, Obellianne C, Palanisamy V, Gangaraju VK, Diehl JA, Howe PH. A regulated PNUTS mRNA to lncRNA splice switch mediates EMT and tumour progression. Nat Cell Biol. 2017; 19:1105–15. https://doi.org/10.1038/ncb3595 [PubMed]
- 26. Leucci E, Vendramin R, Spinazzi M, Laurette P, Fiers M, Wouters J, Radaelli E, Eyckerman S, Leonelli C, Vanderheyden K, Rogiers A, Hermans E, Baatsen P, et al. Melanoma addiction to the long non-coding RNA SAMMSON. Nature. 2016; 531:518–22. https://doi.org/10.1038/nature17161 [PubMed]
- 27. Cui M, Sun J, Hou J, Fang T, Wang X, Ge C, Zhao F, Chen T, Xie H, Cui Y, Yao M, Li J, Li H. The suppressor of cytokine signaling 2 (SOCS2) inhibits tumor metastasis in hepatocellular carcinoma. Tumour Biol. 2016; 37:13521–31. https://doi.org/10.1007/s13277-016-5215-7 [PubMed]