


Introduction
Age-related hearing loss (ARHL) and dementia are two important global health concerns [1, 2]. ARHL has been considered as a promising modifiable risk factor for cognitive impairment [3–5]. Nonetheless, the relationship between ARHL and Alzheimer’s disease (AD) is still controversial [3]. Besides the insufficient statistical power due to small sample size, their relationship might be further complicated by misclassification bias due to misdiagnosis, given that (1) AD was defined in previous observational studies mostly without pathological evidence, such as amyloid PET imaging or cerebrospinal fluid (CSF) biomarkers; (2) aged subjects with hearing loss (HL) might be more intellectually capable than what the cognitive tests suggest [6]. Therefore, investigating the association between ARHL and AD biomarkers might be less biased and more informative about the causal relationship.
In recent AD criteria [7, 8], the levels of CSF Aβ1-42, tau, p-tau181, as well as PET imaging results have been established as core AD biomarkers to define the progressive stages in AD continuum, including preclinical AD, mild cognitive decline (MCI) due to AD, and dementia due to AD. Also, longitudinal observational studies suggested that the above biomarkers [9–12] and their ratios (tau/Aβ1-42 [13, 14] and p-tau181/Aβ1-42 [15, 16]) are good predictors of cognitive decline. In the AD continuum, the abnormal accumulation of these pathological proteins will finally lead to the structural atrophy and functional loss of specific brain regions, particularly the hippocampus and entorhinal cortex. In the present study, we aimed to explore how ARHL can influence these neurodegenerative biomarkers in the Alzheimer’s continuum based on the Alzheimer’s Disease Neuroimaging Initiative (ADNI) database.
Results
ARHL and CSF biomarkers
We first investigated the association of ARHL with the baseline levels of the CSF Aβ and tau proteins in total group. CSF measurements of Aβ42, tau, and ptau181 were available for 479 participants (67 HC, 209 preclinical AD, 93 MCI due to AD, and 110 dementia due to AD), of whom 60 had ARHL (Table 1). No association was found between ARHL and CSF Aβ42 levels (β = 0.002, p = 0.28). (Figure 1A) ARHL was associated with higher levels of CSF total tau (β = 0.23, p = 0.002) and ptau181 (β = 0.17, p = 0.017) after adjustment for age, gender, education, APOE4 status, pathological diagnosis, DM2, hypertension, hyperlipidemia, BMI, and extracted CSF volume. (Figure 1B–1C) CSF levels of tau (111 ± 54 pg/ml, 95% confidence interval (CI) = 95.6 to 124.6 pg/ml) and ptau181 (49 ± 26 pg/ml, 95% CI = 42 to 55 pg/ml) were significantly higher in individuals with ARHL than those in HN group (100 ± 61 pg/ml, 95% CI = 94 to 106 pg/ml for tau; 45 ± 26pg/ml, 95% CI = 42 to 47 pg/ml for ptau181). As for the biomarker ratios, ARHL was associated with higher CSF total tau/Aβ42 ratio (β = 7.96, p = 0.01), but not with ptau181 /Aβ42 ratio (β = 0.15, p = 0.07). (Supplementary Figure 1)
Table 1. Participant characteristics at baseline.
| CSF Aβ42, tau, and ptau | Amyloid PET | Hippocampus | Other ROIs# | ||||||||||||||||||||||||||||||||||||||||||||||||||||||||||||||||||||||||||||||||||||||||||||||||
| HL | HN | p value | HL | HN | p value | HL | HN | p value | HL | HN | p value | ||||||||||||||||||||||||||||||||||||||||||||||||||||||||||||||||||||||||||||||||||||||||
| No. | 60 | 419 | 106 | 560 | 131 | 746 | 74 | 440 | |||||||||||||||||||||||||||||||||||||||||||||||||||||||||||||||||||||||||||||||||||||||||||
| Age (Mean ± SD, year) | 77.4 ± 5.0 | 72.7 ± 7.1 | <0.0001 | 77.3 ± 5.2 | 72.4 ± 6.9 | <0.0001 | 77.5 ± 5.1 | 73.0 ± 6.9 | < 0.0001 | 77.2 ± 5.6 | 72.5 ± 6.9 | <0.0001 | |||||||||||||||||||||||||||||||||||||||||||||||||||||||||||||||||||||||||||||||||||||||
| Gender (M/F) | 50/15 | 220/199 | 0.0002 | 70/36 | 265/295 | 0.0004 | 90/41 | 362/384 | < 0.0001 | 53/21 | 201/239 | <0.0001 | |||||||||||||||||||||||||||||||||||||||||||||||||||||||||||||||||||||||||||||||||||||||
| Education (Mean ± SD, year) | 16.2 ± 3.0 | 15.9± 2.7 | 0.46 | 16.5 ± 2.8 | 16.3 ± 2.6 | 0.38 | 16.3± 2.9 | 16.0± 2.7 | 0.27 | 16.3 ± 2.9 | 15.9 ± 2.8 | 0.25 | |||||||||||||||||||||||||||||||||||||||||||||||||||||||||||||||||||||||||||||||||||||||
| APOE Ɛ4 carrier status (0/1/2) | 37/19/4 | 180/180/61 | 0.0174 | 65/33/8 | 261/230/68 | 0.02 | 79/42/10 | 355/301/90 | 0.02 | 41/27/6 | 198/188/54 | 0.22 | |||||||||||||||||||||||||||||||||||||||||||||||||||||||||||||||||||||||||||||||||||||||
| Hypertension (yes/no) | 26/34 | 194/225 | 0.67 | 49/57 | 257/303 | 0.95 | 66/65 | 343/403 | 0.35 | 39/35 | 188/252 | 0.11 | |||||||||||||||||||||||||||||||||||||||||||||||||||||||||||||||||||||||||||||||||||||||
| Hyperlipidemia (yes/no) | 29/31 | 217/202 | 0.62 | 60/46 | 286/274 | 0.30 | 68/63 | 379/367 | 0.82 | 34/40 | 208/232 | 0.83 | |||||||||||||||||||||||||||||||||||||||||||||||||||||||||||||||||||||||||||||||||||||||
| BMI (Mean ± SD, kg/m2) | 26.2 ± 4.1 | 26.8 ± 5.1 | 0.43 | 26.4 ± 4.4 | 27.4± 5.4 | 0.06 | 26.5 ± 4.6 | 27.0± 5.0 | 0.31 | 26.2 ± 4.2 | 26.6 ± 4.9 | 0.46 | |||||||||||||||||||||||||||||||||||||||||||||||||||||||||||||||||||||||||||||||||||||||
| DM2 (yes/no) | 4/56 | 29/390 | 0.94 | 10/96 | 54/506 | 0.95 | 15/126 | 63/683 | 0.40 | 7/67 | 36/404 | 0.71 | |||||||||||||||||||||||||||||||||||||||||||||||||||||||||||||||||||||||||||||||||||||||
| CSF volume (ml) | 19.0 ± 4.7 | 18.5 ± 5.1 | 0.44 | … | … | … | … | … | … | … | … | … | |||||||||||||||||||||||||||||||||||||||||||||||||||||||||||||||||||||||||||||||||||||||
| Disease continuum | |||||||||||||||||||||||||||||||||||||||||||||||||||||||||||||||||||||||||||||||||||||||||||||||||||
| Healthy control | 11 | 56 | 0.13& | 17 | 76 | 0.13& | 30 | 164 | 0.15& | 17 | 94 | 0.21& | |||||||||||||||||||||||||||||||||||||||||||||||||||||||||||||||||||||||||||||||||||||||
| Preclinical AD | 27 | 182 | 33 | 147 | 27 | 123 | 15 | 70 | |||||||||||||||||||||||||||||||||||||||||||||||||||||||||||||||||||||||||||||||||||||||||||
| MCI due to AD | 13 | 80 | 41 | 229 | 56 | 295 | 30 | 163 | |||||||||||||||||||||||||||||||||||||||||||||||||||||||||||||||||||||||||||||||||||||||||||
| Dementia due to AD | 9 | 101 | 15 | 108 | 18 | 164 | 12 | 113 | |||||||||||||||||||||||||||||||||||||||||||||||||||||||||||||||||||||||||||||||||||||||||||
| Abbreviations: HL = Hearing Loss; HN = Hearing Normal; AD = Alzheimer’s Disease; BMI = Body Mass Index; DM2 = Diabetes Mellitus Type 2; ROI = Region of Interest | |||||||||||||||||||||||||||||||||||||||||||||||||||||||||||||||||||||||||||||||||||||||||||||||||||
| #Other five ROIs include middle temporal cortex, entorhinal cortex, parahippocampal area, posterior cingulate, and precuneus | |||||||||||||||||||||||||||||||||||||||||||||||||||||||||||||||||||||||||||||||||||||||||||||||||||
| &Chi-square test for trend of proportion of HL across disease continuum groups | |||||||||||||||||||||||||||||||||||||||||||||||||||||||||||||||||||||||||||||||||||||||||||||||||||
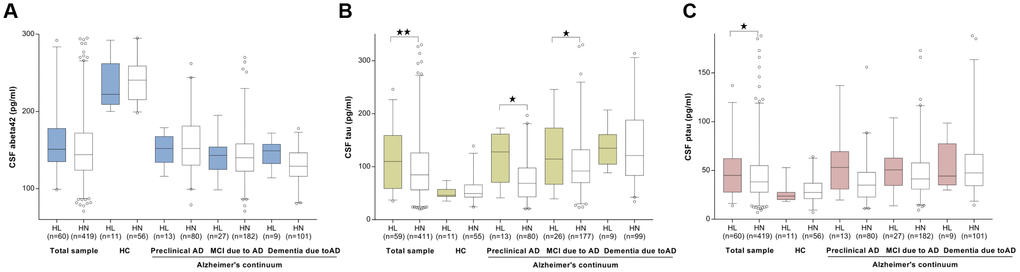
Figure 1. The cross-sectional associations between ARHL and CSF biomarkers. No association was found between ARHL and CSF Aβ42 levels (A). ARHL was associated with higher levels of CSF total tau (B) and ptau181 (C). All the above analyses were adjusted for age, gender, education, APOE4 status, pathological diagnosis of AD, DM2, hypertension, hyperlipidemia, BMI, and extracted CSF volume. *p value was calculated for the total sample.
When stratified by AD continuum group, as expected, CSF Aβ42 levels decreased and tau (total tau or ptau181) levels increased across groups from HC through preclinical AD and MCI to dementia. ARHL was associated with a higher level of CSF total tau only among those at preclinical and MCI stages (Figure 1A), but was not associated with CSF ptau181 or Aβ42 in any group (Figure 1B–1C). Potential interactions with APOE4 status and gender were found for CSF Aβ42 and total tau (p=0.07), respectively. Subgroup analyses showed that ARHL was associated with higher levels of CSF tau or ptau181 only among APOE4 carrier (β = 0.24, p = 0.03 for tau; β = 0.25, p = 0.03 for ptau181) and male (β = 0.30, p = 0.001 for tau; β = 0.19, p = 0.03 for ptau181) groups (Supplementary Figure 2).
We next studied whether ARHL was associated with the changes of Aβ and tau levels through longitudinal analyses of the following 24 month widow from the baseline. ARHL was not associated with the change rate of Aβ42 (Figure 2A), but with the faster elevation rates of CSF tau (Figure 2B) and ptau181 (Figure 2C) in HC or preclinical AD, after adjustment for age, gender, education, APOE4 status, DM2, hypertension, hyperlipidemia, BMI, and extracted CSF volume. Similar results were concluded when the follow-up window was extended to 5 years.
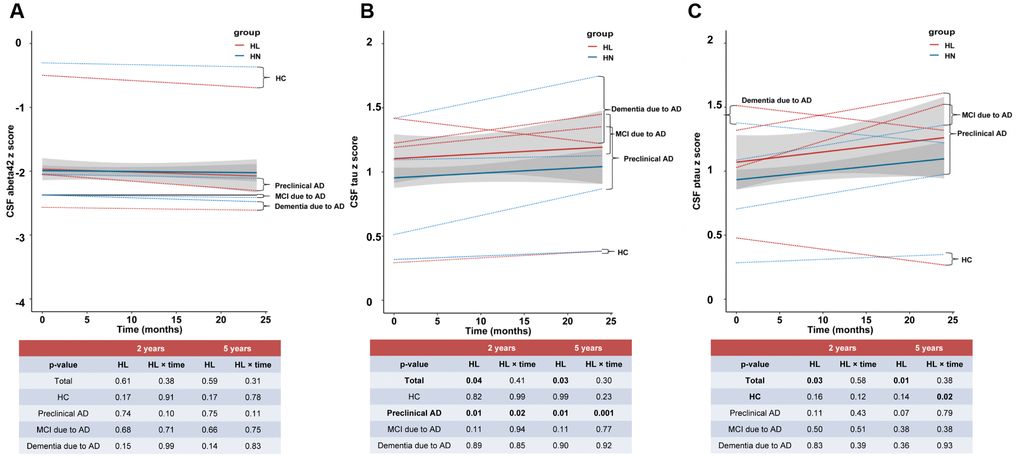
Figure 2. The longitudinal influences of ARHL on CSF biomarkers. ARHL at baseline was not associated with the change rate of Aβ42 (A), but with the faster elevation rates of CSF tau (B) and ptau181 (C). All the above analyses were adjusted for age, gender, education, APOE4 status, pathological diagnosis of AD, DM2, hypertension, hyperlipidemia, BMI, and extracted CSF volume. *p value was calculated for the total sample.
ARHL and amyloid PET
We then investigated the association of ARHL with the molecular imaging results. Florbetapir PET scans were available for 666 participants (93 HC, 180 preclinical AD, 270 MCI, and 123 AD), of whom 106 had ARHL (Table 1). As expected, a florbetapir cortical summary measurement (SUVR) increased across groups through the AD continuum. We did not identify a statistically significant association between ARHL and (summary or regional) SUVR when adjusting for all variables mentioned above. Similarly, no associations were detected between ARHL and SUVR when the analyses were stratified by AD continuum group. (Supplementary Figure 3)
ARHL and MRI biomarkers
Cortical thickness or volume measures were available in 877 participants for hippocampus and 514 participants for another 20 ROIs. As expected, the cortical measures were greatest in HC, followed by those at the preclinical stage, and then those with MCI and dementia due to AD. In the fully-adjusted model, ARHL was associated with higher volume of hippocampus (β = 188.8, p = 0.04) (Figure 3A) and thickness/volume of parahippocampus (β = 8.99, p = 0.03 for volume of left side; β = 7.18, p = 0.07 for volume of right side; β = 0.33, p = 4.86×10⁻³ for thickness of left side; β = 0.27, p = 0.01 for thickness of right side) and entorhinal cortex (β = 5.41, p = 1.44×10⁻⁵ for volume of left side; β = 2.08, p = 0.01 for volume of right side; β = 0.76, p = 1.55×10⁻⁴for thickness of left side; β = 0.80, p = 3.71×10⁻⁴for thickness of right side) (Figure 4A–4D). Only the associations of ARHL with entorhinal cortex survived the Bonferrroni adjustment. When stratified by AD continuum stage, no association was found with hippocampus volume in any group. (Figure 3A) ARHL showed significant association with higher entorhinal cortex at baseline only in the MCI and dementia stage. (Figure 4A–4D) There were no significant associations of ARHL with cortical structural measures of middle temporal region, posterior cingulate, and precuneus.
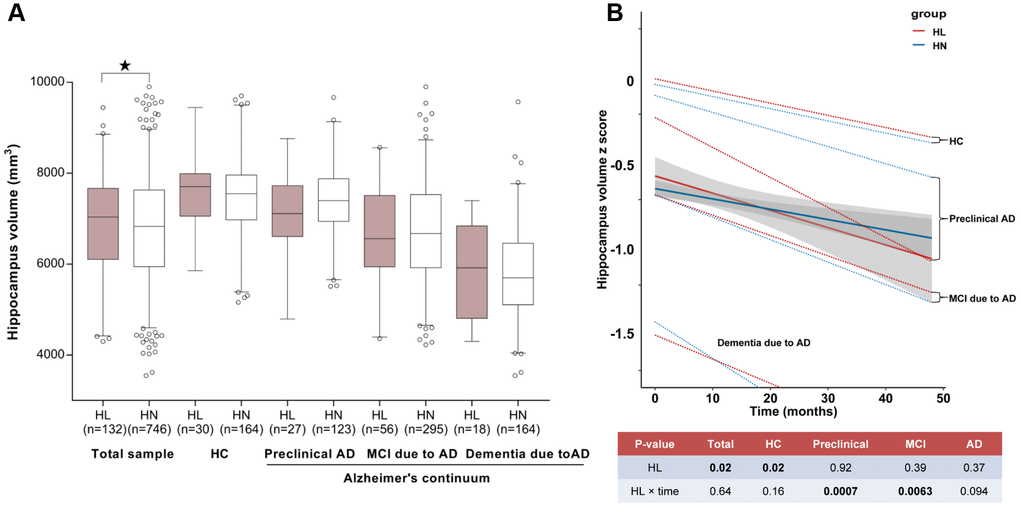
Figure 3. The relationship between ARHL and hippocampus volume. ARHL was associated with larger volume of hippocampus. Nonetheless, when stratified by AD continuum stage, no association was found in any group. (A) ARHL was associated with more rapid cortical thinning, especially in the preclinical or prodromal AD stage (B). All analyses were adjusted for age, gender, education, APOE4 status, pathological diagnosis of AD (for total sample), DM2, hypertension, hyperlipidemia, BMI, and ICV. *p value was calculated for the total sample.
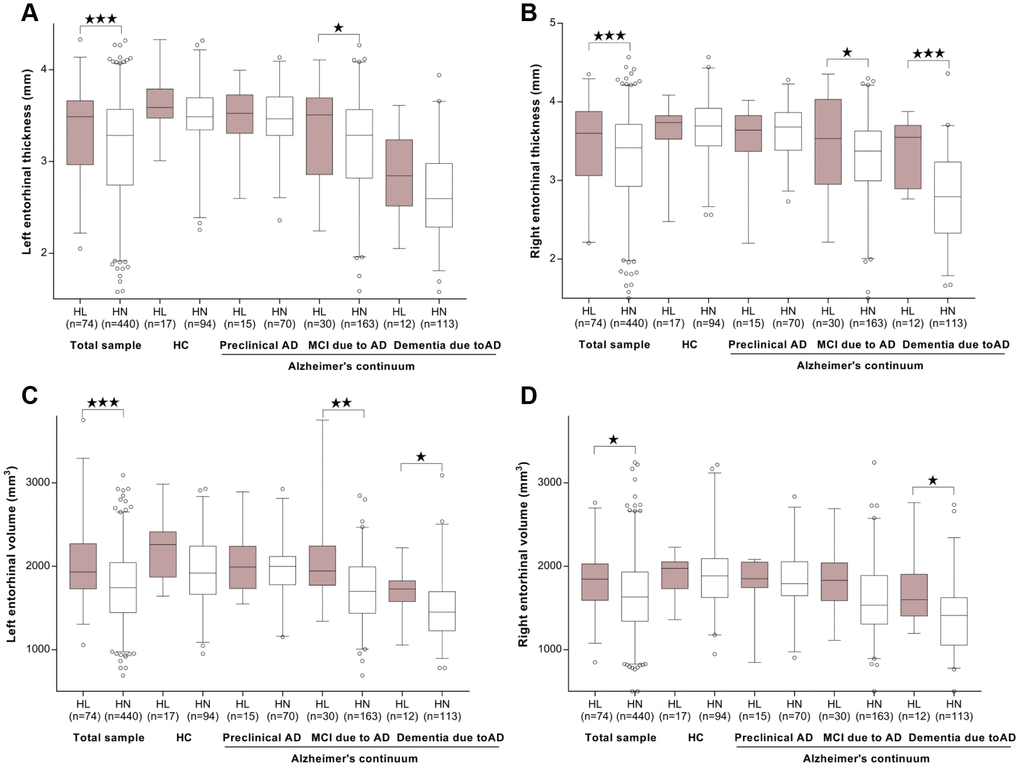
Figure 4. The cross-sectional associations between ARHL and structural measurements of entorhinal cortex. ARHL was associated with higher thickness/volume of entorhinal cortex. The significant associations with higher entorihnal cortex at baseline were observed only in MCI and/or dementia stage. (A–D) All analyses were adjusted for age, gender, education, APOE4 status, pathological diagnosis of AD, DM2, hypertension, hyperlipidemia, BMI, and intracranial volume. *p value was calculated for the total sample.
Moreover, the longitudinal analyses showed that ARHL at baseline was associated with more rapid cortical thinning in hippocampus (Figure 3B) and entorhinal cortex (Figure 5A–5D) in preclinical or prodromal AD, after adjusting for age, gender, education, APOE4 status, DM2, hypertension, hyperlipidemia, BMI, and ICV. Similar trends were observed in HC and preclinical stages.
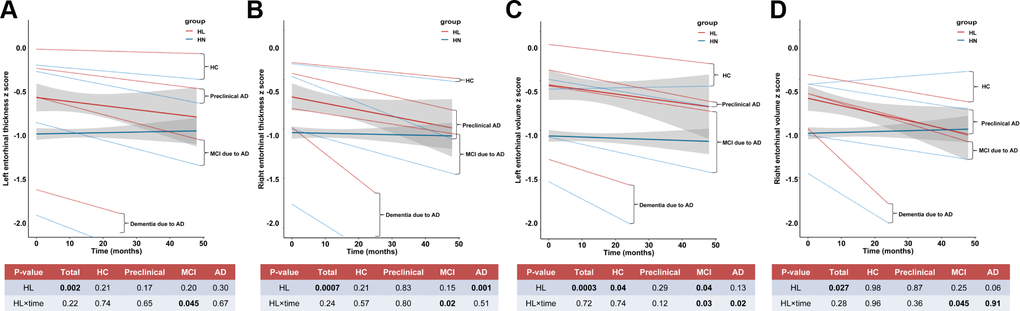
Figure 5. The longitudinal influences of ARHL on structural measurements of entorhinal cortex. ARHL at baseline was associated with more rapid cortical thinning in bilateral entorhinal cortex in prodromal AD stage (A–D). All analyses were adjusted for age, gender, education, APOE4 status, pathological diagnosis of AD, DM2, hypertension, hyperlipidemia, BMI, and intracranial volume. *p value was calculated for the total sample.
Among those who had both cortical measures and CSF measures available (n = 822 for hippocampus; n = 491 for other ROIs), the addition of Aβ42, tau, and ptau181 in the regression of ARHL with cortical measures barely influenced the effect size (β) of ARHL. We did not identify any interaction between APOE4 or gender and ARHL in predicting brain imaging or CSF biomarker measures.
Discussion
Degeneration of the auditory system was reported in AD decades ago [17]. In addition to confirming the prior findings that ARHL is associated with temporal lobe atrophy [18], we demonstrated for the first time, a strong link between ARHL and the amount of tau, ptau181, tau/Aβ1-42 ratio in CSF as well as reserve capability of entorhinal cortex. These influences seemed to be more obvious in the non-demented stage of the AD continuum. We did not find a significant relationship between ARHL and Aβ levels.
Our findings are also consistent with animal histopathologic data showing that p-tau expression in hippocampus was significantly elevated after 12 months follow-up of mice with HL [19]. It can be implied that ARHL imparts influences on neurodegeneration via promoting tau pathology but not Aβ. Neuropathological and in vivo studies indicated that tau pathology could induce cognitive impairment across AD spectrum via synaptic dysfunction and neuronal loss [20], independent of amyloid pathology [21]. Notably, the negative associations might not be explained by inter-individual variations in total Aβ production because ARHL was also found not to influence CSF Aβ1-42/Aβ1-40 ratio (Supplementary Figure 4). Still, future studies should further explore the association between ARHL and amyloid in brain regions associated with the auditory function, such as the medial geniculate body (MGB) and inferior colliculus (IC), where pathological deposits were distributed throughout in AD patients [17].
Interestingly, we found subjects with ARHL had greater volume/thickness of hippocampus and entorhinal cortex at baseline. A possible explanation is that ARHL might play different roles in different stages of AD continuum. We noticed that these cross-sectional associations were only significant in clinical stage of AD continuum. On the other hand, the trends of ARHL associated with more rapid cortical thinning in hippocampus and entorhinal cortex in total group were found majoly in preclinical or prodromal stage. However, this hypothesis warrants further validation in larger studies.
There are several pathways through which ARHL may associate with increased levels of tau and ptau in CSF. Potential pathways include the SIRT1-PGC1a and LKB1-AMPK pathway that plays a role in maintaining cerebral neuron function via regulating mitochondrial function, and vascular endothelial growth factor signal pathway responsible for vascular angiogenesis and the blood–brain barrier integrity [22]. More importantly, it was shown that the expression levels of these proteins were changed in both HL and AD [22]. More animal studies are needed to shed light on the potential mechanisms via which ARHL acts in AD.
Our study had certain limitations. First, although a causal relationship between ARHL and dementia is strengthened by longitudinal analyses in the present study, the attrition bias due to loss to follow-up is not corrected in the analyses. Future studies with large sample size, longer follow-up duration, and lower attrition rate might provide more powerful evidence to support the relationship. Second, the longitudinal association can reflect, but not represent the causal relationship. Third, AHRL can contribute to depression that may exacerbate the cognitive impairment and neurodegeneration biomarker profile [23]. Although we excluded individuals with mental diseases or other neurologic conditions other than AD in the present analyses, we still cannot exclude the influences of other potential confounders, such as social isolation. Fourth, the sample size of ARHL group in some subgroups (e.g., in HC group and dementia group) was small and the results warrant further validation in larger studies. Fifth, the accurate definition of ARHL here is restricted by the information accessible from the dataset (see Supplementary Tables 1–3). As a sensitivity analysis, the results barely changed after including those who had age of onset of HL before 60.
In conclusion, our current study identified the cross-sectional as well as the longitudinal association of ARHL and the known biomarkers of AD. Our results suggested that the neurodegenerative effects of ARHL might be driven by accelerating cerebrospinal fluid tau levels and atrophy of entorhinal cortex. Furthermore, our findings suggest that prevention or management of ARHL in preclinical and prodromal stage of AD might be effective in combating neurodegeneration.
Materials and Methods
ADNI
All data (including the baseline demographic characteristics, biomarkers, medical history (MH), and physical examination (PE)) were downloaded from the ADNI database (adni.loni.usc.edu). As a multicenter study, ADNI is designed to develop clinical, imaging, genetic, and biochemical biomarkers for the early detection and tracking of AD. The participants are adults aged 55–90 years with healthy control (HC), mild cognitive impairment (MCI), or mild Alzheimer’s disease (AD). Further information can be found at http://www.adni-info.org/ and in previous reports [24–29].
Participants
The search terms used for the screening for HL include “hear”, “auditory”, “ear”, “deaf”, “presbycusis”, and “HOH (hard of hearing)”. Based on the records in MH and PE datasets, 559 participants were found to be with HL at baseline, among which 340 had information of covariates available. Furthermore, another 96 participants with HL were excluded, including 75 who had HL before 60 years and 21 who had no information about age of onset for HL, leaving 244 who had HL after 60 years old (69.7 ± 5.9, defined as age-related HL (ARHL) herein). In the subsequent analyses, we further excluded individuals with a history of psychiatric conditions (including depression), neurologic diseases other than AD, malignancy, or stroke. To restrict the study population to the AD continuum, we excluded participants with clinical diagnosis of MCI or dementia but not with evidence of cerebral Aβ deposition detected by PET (AV45 > 1.11) or CSF (Aβ < 192 pg/ml) [30]. (Figure 6) Finally, samples with data of CSF (n = 479 for Aβ42, tau, and ptau181), amyloid PET (n = 666), and brain structural measures (n = 877 for hippocampus; n = 514 for other regions) were included in the cross-sectional analyses. (Table 1).
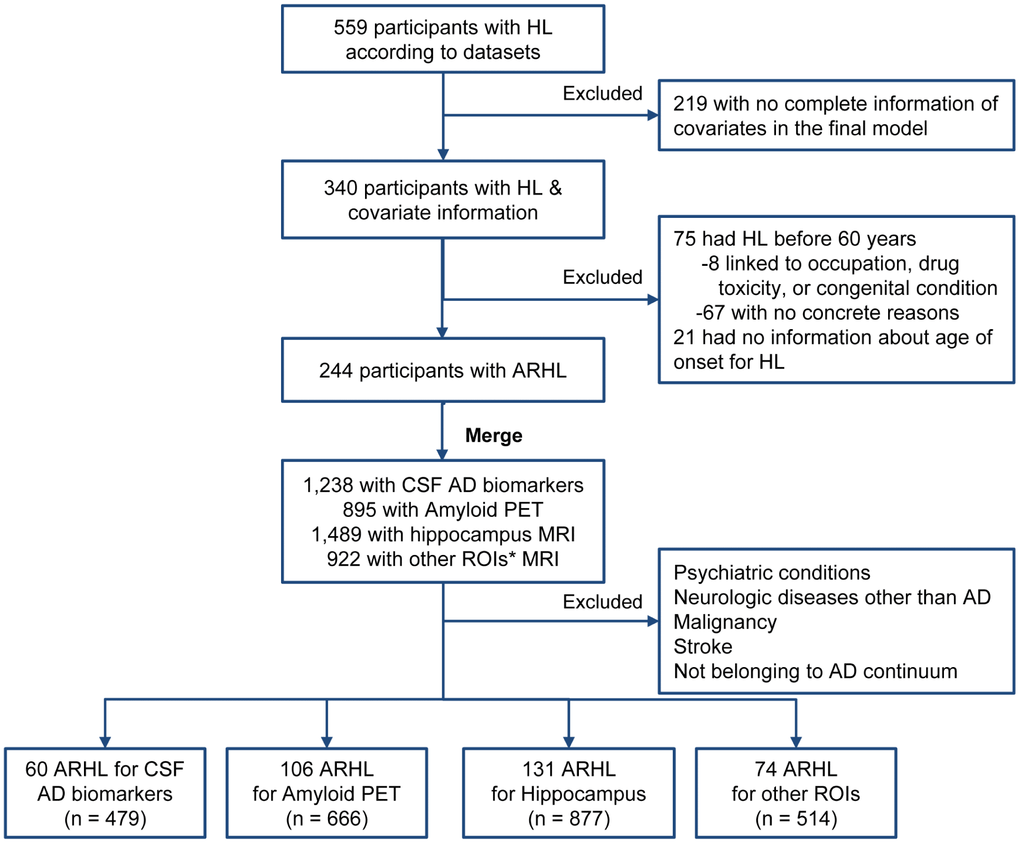
Figure 6. Flow chart of searching for ARHL. Abbreviations: HL = hearing loss; ARHL = age-related HL; CSF = cerebrospinal fluid, ROI = regions of interest. Searching terms for covariates: Hypertension: “hypert”, “HTN”, and “blood pressure”; Hyperlipemia: “lipid”, “cholesterol”, “hyperlipemia”, and “HLP”; DM2: “diabete”, “diabetic”, and “insulin”; Depression: “depress”. Other covariates (including age, gender, apoe4 status, education, diagnosis, and BMI) are accessible without searching the relevant database. *Other ROIs include middle temporal cortex, entorhinal cortex, parahippocampal area, posterior cingulate, and precuneus.
CSF measurements
CSF collection and procedural protocols have been described previously [30]. Baseline CSF Aβ1-42, tau, and p-tau181 (pg/ml) were measured using the INNOBIA AlzBio3 immunoassay (Fujirebio, Belgium). The within-batch precision values were <10% (5.1–7.8% for Aβ1-42, 4.4–9.8% for tau and 5.1–8.8% for ptau181, respectively).
18F florbetapir AV45 PET imaging
Florbetapirdata in the most fully pre-processed format was downloaded from LONI (http://adni.loni.usc.edu). The data preprocessing is accessible online (adni.loni.ucla.edu/about-data-samples/image-data/). The mean florbetapir AV45 uptake (representing the Aβ retention) within each region was calculated by co-registering the florbetapir scan to the corresponding MRI. Florbetapir SUVRs were created by averaging across four cortical grey matter regions (frontal, cingulate, lateral parietal, lateral temporal) and dividing the summary by reference region. Further details of PET acquisition and the region-of-interest protocol have been summarized previously [31].
MRI structure
The process of MRI acquisition in ADNI has been described elsewhere [32, 33]. In brief, ADNI MRIs were acquired at multiple sites with1.5T GE, Philips, and Siemens MRI scanners using a magnetization prepared rapid acquisition gradient echo (MP-RAGE) sequence. Two high-resolution T1-weighted MRI scans were collected for each participant using a sagittal 3D MP-RAGE sequence with an approximate TR=2400ms, minimum full TE, approximate TI=1000ms, and approximate flip angle of 8 degrees. Scans were collected with a 24cm field of view and an acquisition matrix of 192 x 192 x 166 (x, y, z dimensions), to yield a standard voxel size of 1.25 x 1.25 x 1.2 mm. Images were then reconstructed to give a 256 x 256 x 166 matrix and voxel size of approximately 1 x 1 x 1.2 mm. Herein, six brain regions were defined as brain regions of interest (ROI) in the present study, including hippocampus, parahippocampal area, middle temporal cortex, entorhinal cortex, posteriorcingulate, and precuneus. The atrophy of the above regions in AD has been validated in previous MRI studies [33–38].
Statistical analyses
Chi-square tests (for categorical variables), Student t test (for continuous variables with normal distributions), and Mann-Whitney U test (for variables with skewed distributions) were used to compare demographic, clinical, and diagnostic variables between HL and hearing normal (HN) groups. In case of skewed distribution (Shapiro-Wilk test > 0.05) of biomarker data, transformation was performed to approximate a normal distribution via “car” package of R software.
In the cross-sectional analyses, we firstly studied the associations of ARHL with CSF biomarkers (Aβ42, tau, ptau181, tau/Aβ42, and ptau181/Aβ42) after adjusting for age, gender, education, APOE4 status, pathological diagnosis of AD, diabetes mellitus type-2 (DM2), hypertension, hyperlipidemia, body mass index (BMI), and extracted CSF volume. Next, differences in amyloid PET and cortical structural measures (volume or thickness) between ARHL and HN were tested in 21 ROIs using a regression model adjusting for age, gender, education, APOE4 status, pathological diagnosis of AD, DM2, hypertension, hyperlipidemia, BMI, and intracranial volume (ICV). Significance of the HL status was examined after correction for multiple comparisons using Bonferroni method (p < 0.05). A two-way analysis of covariance model was utilized to estimate whether the association differed across the diagnostic groups. Multiple interaction terms for gender, APOE4 status, and pathological diagnosis of AD were used to explore whether strata effect existed. In case of any potential interaction (p < 0.1), subgroup analysis was further performed. All the above analyses were repeated after stratifying by the AD continuum (preclinical AD, MCI, and dementia). Finally, to explore the influences of ARHL on the longitudinal change in the above biomarkers, we fitted linear mixed effects models to characterize individual paths of change. These models had random intercepts and slopes for time and an unstructured covariance matrix for the random effects and included the interaction between (continuous) time and ARHL as predictor. All outcome variables in linear mixed-effects models were standardized to z scores (healthy control as reference) to facilitate comparisons between modalities. Age, gender, education, APOE4 status, pathological diagnosis, DM2, hypertension, hyperlipidemia, BMI, extracted CSF volume or ICV were covariates.
P < 0.05 was considered significant in all analyses except where specifically noted. R version 3.5.1 and GraphPad Prism 7.00 software were used for statistical analyses and figure preparation.
Ethics approval
The study was approved by institutional review boards of all participating institutions, and written informed consent was obtained from all participants or their guardians according to the Declaration of Helsinki (consent for research).
Supplementary Materials
Author Contributions
Prof. Yu: conceptualization and design of the study, analysis and interpretation of data and revision of the manuscript. Dr. Xu: collection and analysis of the data, drafting and revision of the manuscript, and prepared all the figures. Prof. Zhang: drafting and revision of the manuscript. Dr.Li and Dr. Chen-Chen Tan: interpretation of the data and revision of the manuscript. MS. Cao: revision of the manuscript. Prof. Lan Tan: design and conceptualization of the study, revision of the manuscript. Data used in preparation of this article were obtained from the Alzheimer’s Disease Neuroimaging Initiative (ADNI) database (adni.loni.usc.edu). As such, the investigators within the ADNI contributed to the design and implementation of ADNI and/or provided data but did not participate in analysis or writing of this report.
Acknowledgments
The authors thank contributors, including the staff at Alzheimer’s Disease Centers who collected samples used in this study, patients, and their families whose help and participation made this work possible.
Conflicts of Interest
We declare that none authors have financial disclosures and conflicts of interest.
Funding
This study was supported by grants from the National Natural Science Foundation of China (91849126). Data collection and sharing for this project were funded by the Alzheimer's Disease Neuroimaging Initiative (ADNI) (National Institutes of Health Grant U01 AG024904) and DOD ADNI (Department of Defense award number W81XWH-12-2-0012). ADNI is funded by the National Institute on Aging, the National Institute of Biomedical Imaging and Bioengineering, and through generous contributions from the following: AbbVie, Alzheimer’s Association; Alzheimer’s Drug Discovery Foundation; Araclon Biotech; BioClinica, Inc.; Biogen; Bristol-Myers Squibb Company; CereSpir, Inc.; Cogstate; Eisai Inc.; Elan Pharmaceuticals, Inc.; Eli Lilly and Company; EuroImmun; F. Hoffmann-La Roche Ltd and its affiliated company Genentech, Inc.; Fujirebio; GE Healthcare; IXICO Ltd.; Janssen Alzheimer Immunotherapy Research & Development, LLC.; Johnson & Johnson Pharmaceutical Research & Development LLC.; Lumosity; Lundbeck; Merck & Co., Inc.; Meso Scale Diagnostics, LLC.; NeuroRx Research; Neurotrack Technologies; Novartis Pharmaceuticals Corporation; Pfizer Inc.; Piramal Imaging; Servier; Takeda Pharmaceutical Company; and Transition Therapeutics. The Canadian Institutes of Health Research is providing funds to support ADNI clinical sites in Canada. Private sector contributions are facilitated by the Foundation for the National Institutes of Health (www.fnih.org). The grantee organization is the Northern California Institute for Research and Education, and the study is coordinated by the Alzheimer’s Therapeutic Research Institute at the University of Southern California. ADNI data are disseminated by the Laboratory for Neuro Imaging at the University of Southern California.
References
- 1. Wilson BS, Tucci DL, Merson MH, O’Donoghue GM. Global hearing health care: new findings and perspectives. Lancet. 2017; 390:2503–15. https://doi.org/10.1016/S0140-6736(17)31073-5 [PubMed]
- 2. Livingston G, Sommerlad A, Orgeta V, Costafreda SG, Huntley J, Ames D, Ballard C, Banerjee S, Burns A, Cohen-Mansfield J, Cooper C, Fox N, Gitlin LN, et al. Dementia prevention, intervention, and care. Lancet. 2017; 390:2673–734. https://doi.org/10.1016/S0140-6736(17)31363-6 [PubMed]
- 3. Loughrey DG, Kelly ME, Kelley GA, Brennan S, Lawlor BA. Association of Age-Related Hearing Loss With Cognitive Function, Cognitive Impairment, and Dementia: A Systematic Review and Meta-analysis. JAMA Otolaryngol Head Neck Surg. 2018; 144:115–26. https://doi.org/10.1001/jamaoto.2017.2513 [PubMed]
- 4. Uhlmann RF, Larson EB, Rees TS, Koepsell TD, Duckert LG. Relationship of hearing impairment to dementia and cognitive dysfunction in older adults. JAMA. 1989; 261:1916–19. https://doi.org/10.1001/jama.1989.03420130084028 [PubMed]
- 5. Ray J, Popli G, Fell G. Association of Cognition and Age-Related Hearing Impairment in the English Longitudinal Study of Ageing. JAMA Otolaryngol Head Neck Surg. 2018; 144:876–82. https://doi.org/10.1001/jamaoto.2018.1656 [PubMed]
- 6. Granick S, Kleban MH, Weiss AD. Relationships between hearing loss and cognition in normally hearing aged persons. J Gerontol. 1976; 31:434–40. https://doi.org/10.1093/geronj/31.4.434 [PubMed]
- 7. McKhann GM, Knopman DS, Chertkow H, Hyman BT, Jack CR
Jr , Kawas CH, Klunk WE, Koroshetz WJ, Manly JJ, Mayeux R, Mohs RC, Morris JC, Rossor MN, et al. The diagnosis of dementia due to Alzheimer’s disease: recommendations from the National Institute on Aging-Alzheimer’s Association workgroups on diagnostic guidelines for Alzheimer’s disease. Alzheimers Dement. 2011; 7:263–69. https://doi.org/10.1016/j.jalz.2011.03.005 [PubMed] - 8. Jack CR
Jr , Bennett DA, Blennow K, Carrillo MC, Feldman HH, Frisoni GB, Hampel H, Jagust WJ, Johnson KA, Knopman DS, Petersen RC, Scheltens P, Sperling RA, Dubois B. A/T/N: An unbiased descriptive classification scheme for Alzheimer disease biomarkers. Neurology. 2016; 87:539–47. https://doi.org/10.1212/WNL.0000000000002923 [PubMed] - 9. Lim YY, Kalinowski P, Pietrzak RH, Laws SM, Burnham SC, Ames D, Villemagne VL, Fowler CJ, Rainey-Smith SR, Martins RN, Rowe CC, Masters CL, Maruff PT. Association of β-Amyloid and Apolipoprotein E ε4 With Memory Decline in Preclinical Alzheimer Disease. JAMA Neurol. 2018; 75:488–94. https://doi.org/10.1001/jamaneurol.2017.4325 [PubMed]
- 10. Donohue MC, Sperling RA, Petersen R, Sun CK, Weiner MW, Aisen PS, and Alzheimer’s Disease Neuroimaging Initiative. Association Between Elevated Brain Amyloid and Subsequent Cognitive Decline Among Cognitively Normal Persons. JAMA. 2017; 317:2305–16. https://doi.org/10.1001/jama.2017.6669 [PubMed]
- 11. Xiong C, Jasielec MS, Weng H, Fagan AM, Benzinger TL, Head D, Hassenstab J, Grant E, Sutphen CL, Buckles V, Moulder KL, Morris JC. Longitudinal relationships among biomarkers for Alzheimer disease in the Adult Children Study. Neurology. 2016; 86:1499–506. https://doi.org/10.1212/WNL.0000000000002593 [PubMed]
- 12. Soldan A, Pettigrew C, Cai Q, Wang MC, Moghekar AR, O’Brien RJ, Selnes OA, Albert MS, Team BR, and BIOCARD Research Team. Hypothetical Preclinical Alzheimer Disease Groups and Longitudinal Cognitive Change. JAMA Neurol. 2016; 73:698–705. https://doi.org/10.1001/jamaneurol.2016.0194 [PubMed]
- 13. Snider BJ, Fagan AM, Roe C, Shah AR, Grant EA, Xiong C, Morris JC, Holtzman DM. Cerebrospinal fluid biomarkers and rate of cognitive decline in very mild dementia of the Alzheimer type. Arch Neurol. 2009; 66:638–45. https://doi.org/10.1001/archneurol.2009.55 [PubMed]
- 14. Fagan AM, Roe CM, Xiong C, Mintun MA, Morris JC, Holtzman DM. Cerebrospinal fluid tau/beta-amyloid(42) ratio as a prediction of cognitive decline in nondemented older adults. Arch Neurol. 2007; 64:343–49. https://doi.org/10.1001/archneur.64.3.noc60123 [PubMed]
- 15. Harari O, Cruchaga C, Kauwe JS, Ainscough BJ, Bales K, Pickering EH, Bertelsen S, Fagan AM, Holtzman DM, Morris JC, Goate AM, and Alzheimer’s Disease Neuroimaging Initiative. Phosphorylated tau-Aβ42 ratio as a continuous trait for biomarker discovery for early-stage Alzheimer’s disease in multiplex immunoassay panels of cerebrospinal fluid. Biol Psychiatry. 2014; 75:723–31. https://doi.org/10.1016/j.biopsych.2013.11.032 [PubMed]
- 16. de Jong D, Jansen RW, Kremer BP, Verbeek MM. Cerebrospinal fluid amyloid beta42/phosphorylated tau ratio discriminates between Alzheimer’s disease and vascular dementia. J Gerontol A Biol Sci Med Sci. 2006; 61:755–58. https://doi.org/10.1093/gerona/61.7.755 [PubMed]
- 17. Sinha UK, Hollen KM, Rodriguez R, Miller CA. Auditory system degeneration in Alzheimer’s disease. Neurology. 1993; 43:779–85. https://doi.org/10.1212/WNL.43.4.779 [PubMed]
- 18. Qian ZJ, Chang PD, Moonis G, Lalwani AK. A novel method of quantifying brain atrophy associated with age-related hearing loss. Neuroimage Clin. 2017; 16:205–09. https://doi.org/10.1016/j.nicl.2017.07.021 [PubMed]
- 19. Park SY, Kim MJ, Kim HL, Kim DK, Yeo SW, Park SN. Cognitive decline and increased hippocampal p-tau expression in mice with hearing loss. Behav Brain Res. 2018; 342:19–26. https://doi.org/10.1016/j.bbr.2018.01.003 [PubMed]
- 20. Di J, Cohen LS, Corbo CP, Phillips GR, El Idrissi A, Alonso AD. Abnormal tau induces cognitive impairment through two different mechanisms: synaptic dysfunction and neuronal loss. Sci Rep. 2016; 6:20833. https://doi.org/10.1038/srep20833 [PubMed]
- 21. Bejanin A, Schonhaut DR, La Joie R, Kramer JH, Baker SL, Sosa N, Ayakta N, Cantwell A, Janabi M, Lauriola M, O’Neil JP, Gorno-Tempini ML, Miller ZA, et al. Tau pathology and neurodegeneration contribute to cognitive impairment in Alzheimer’s disease. Brain. 2017; 140:3286–300. https://doi.org/10.1093/brain/awx243 [PubMed]
- 22. Shen Y, Ye B, Chen P, Wang Q, Fan C, Shu Y, Xiang M. Cognitive Decline, Dementia, Alzheimer’s Disease and Presbycusis: Examination of the Possible Molecular Mechanism. Front Neurosci. 2018; 12:394. https://doi.org/10.3389/fnins.2018.00394 [PubMed]
- 23. Fellinger J, Holzinger D, Gerich J, Goldberg D. Mental distress and quality of life in the hard of hearing. Acta Psychiatr Scand. 2007; 115:243–45. https://doi.org/10.1111/j.1600-0447.2006.00976.x [PubMed]
- 24. Jack CR
Jr , Bernstein MA, Borowski BJ, Gunter JL, Fox NC, Thompson PM, Schuff N, Krueger G, Killiany RJ, Decarli CS, Dale AM, Carmichael OW, Tosun D, Weiner MW, and Alzheimer’s Disease Neuroimaging Initiative. Update on the magnetic resonance imaging core of the Alzheimer’s disease neuroimaging initiative. Alzheimers Dement. 2010; 6:212–20. https://doi.org/10.1016/j.jalz.2010.03.004 [PubMed] - 25. Jagust WJ, Bandy D, Chen K, Foster NL, Landau SM, Mathis CA, Price JC, Reiman EM, Skovronsky D, Koeppe RA, and Alzheimer’s Disease Neuroimaging Initiative. The Alzheimer’s Disease Neuroimaging Initiative positron emission tomography core. Alzheimers Dement. 2010; 6:221–29. https://doi.org/10.1016/j.jalz.2010.03.003 [PubMed]
- 26. Petersen RC, Aisen PS, Beckett LA, Donohue MC, Gamst AC, Harvey DJ, Jack CR
Jr , Jagust WJ, Shaw LM, Toga AW, Trojanowski JQ, Weiner MW. Alzheimer’s Disease Neuroimaging Initiative (ADNI): clinical characterization. Neurology. 2010; 74:201–09. https://doi.org/10.1212/WNL.0b013e3181cb3e25 [PubMed] - 27. Saykin AJ, Shen L, Foroud TM, Potkin SG, Swaminathan S, Kim S, Risacher SL, Nho K, Huentelman MJ, Craig DW, Thompson PM, Stein JL, Moore JH, et al, and Alzheimer’s Disease Neuroimaging Initiative. Alzheimer’s Disease Neuroimaging Initiative biomarkers as quantitative phenotypes: genetics core aims, progress, and plans. Alzheimers Dement. 2010; 6:265–73. https://doi.org/10.1016/j.jalz.2010.03.013 [PubMed]
- 28. Trojanowski JQ, Vandeerstichele H, Korecka M, Clark CM, Aisen PS, Petersen RC, Blennow K, Soares H, Simon A, Lewczuk P, Dean R, Siemers E, Potter WZ, et al, and Alzheimer’s Disease Neuroimaging Initiative. Update on the biomarker core of the Alzheimer’s Disease Neuroimaging Initiative subjects. Alzheimers Dement. 2010; 6:230–38. https://doi.org/10.1016/j.jalz.2010.03.008 [PubMed]
- 29. Weiner MW, Aisen PS, Jack CR
Jr , Jagust WJ, Trojanowski JQ, Shaw L, Saykin AJ, Morris JC, Cairns N, Beckett LA, Toga A, Green R, Walter S, et al. The Alzheimer's disease neuroimaging initiative: progress report and future plans. Alzheimers Dement. 2010; 6:202–11.e7. https://doi.org/10.1016/j.jalz.2010.03.007 [PubMed] - 30. Shaw LM, Vanderstichele H, Knapik-Czajka M, Clark CM, Aisen PS, Petersen RC, Blennow K, Soares H, Simon A, Lewczuk P, Dean R, Siemers E, Potter W, et al, and Alzheimer’s Disease Neuroimaging Initiative. Cerebrospinal fluid biomarker signature in Alzheimer’s disease neuroimaging initiative subjects. Ann Neurol. 2009; 65:403–13. https://doi.org/10.1002/ana.21610 [PubMed]
- 31. Apostolova LG, Hwang KS, Andrawis JP, Green AE, Babakchanian S, Morra JH, Cummings JL, Toga AW, Trojanowski JQ, Shaw LM, Jack CR
Jr , Petersen RC, Aisen PS, et al, and Alzheimer’s Disease Neuroimaging Initiative. 3D PIB and CSF biomarker associations with hippocampal atrophy in ADNI subjects. Neurobiol Aging. 2010; 31:1284–303. https://doi.org/10.1016/j.neurobiolaging.2010.05.003 [PubMed] - 32. Jack CR
Jr , Bernstein MA, Fox NC, Thompson P, Alexander G, Harvey D, Borowski B, Britson PJ, L Whitwell J, Ward C, Dale AM, Felmlee JP, Gunter JL, et al. The Alzheimer’s Disease Neuroimaging Initiative (ADNI): MRI methods. J Magn Reson Imaging. 2008; 27:685–91. https://doi.org/10.1002/jmri.21049 [PubMed] - 33. Risacher SL, Saykin AJ, West JD, Shen L, Firpi HA, McDonald BC, and Alzheimer’s Disease Neuroimaging Initiative (ADNI). Baseline MRI predictors of conversion from MCI to probable AD in the ADNI cohort. Curr Alzheimer Res. 2009; 6:347–61. https://doi.org/10.2174/156720509788929273 [PubMed]
- 34. Simmons A, Westman E, Muehlboeck S, Mecocci P, Vellas B, Tsolaki M, Kłoszewska I, Wahlund LO, Soininen H, Lovestone S, Evans A, Spenger C, and AddNeuroMed Consortium. MRI measures of Alzheimer’s disease and the AddNeuroMed study. Ann N Y Acad Sci. 2009; 1180:47–55. https://doi.org/10.1111/j.1749-6632.2009.05063.x [PubMed]
- 35. Kesslak JP, Nalcioglu O, Cotman CW. Quantification of magnetic resonance scans for hippocampal and parahippocampal atrophy in Alzheimer’s disease. Neurology. 1991; 41:51–54. https://doi.org/10.1212/WNL.41.1.51 [PubMed]
- 36. Jack CR
Jr , Petersen RC, Xu Y, O’Brien PC, Smith GE, Ivnik RJ, Tangalos EG, Kokmen E. Rate of medial temporal lobe atrophy in typical aging and Alzheimer’s disease. Neurology. 1998; 51:993–99. https://doi.org/10.1212/WNL.51.4.993 [PubMed] - 37. Velayudhan L, Proitsi P, Westman E, Muehlboeck JS, Mecocci P, Vellas B, Tsolaki M, Kłoszewska I, Soininen H, Spenger C, Hodges A, Powell J, Lovestone S, Simmons A, and dNeuroMed Consortium. Entorhinal cortex thickness predicts cognitive decline in Alzheimer’s disease. J Alzheimers Dis. 2013; 33:755–66. https://doi.org/10.3233/JAD-2012-121408 [PubMed]
- 38. Bailly M, Destrieux C, Hommet C, Mondon K, Cottier JP, Beaufils E, Vierron E, Vercouillie J, Ibazizene M, Voisin T, Payoux P, Barré L, Camus V, et al. Precuneus and Cingulate Cortex Atrophy and Hypometabolism in Patients with Alzheimer’s Disease and Mild Cognitive Impairment: MRI and (18)F-FDG PET Quantitative Analysis Using FreeSurfer. Biomed Res Int. 2015; 2015:583931. https://doi.org/10.1155/2015/583931 [PubMed]