


Introduction
Cancer is a major public health problem worldwide and is the second leading cause of death in the United States [1]. In China, gastric cancer (GC) has high incidence and mortality rates, and the 5-year survival rate of advanced GC is <30% [2]. Previously, endothelium-dependent vessels were considered to be the sole blood source for gastric cancer tumors. The emergence of a vascular endothelial growth factor receptor (VEGFR)-2 antagonist monoclonal antibody holds potential as a therapy for patients with advanced GC, particularly patients for whom chemotherapy is not beneficial [3]. However, the therapeutic effect of the VEGFR-2 antagonist currently remains unsatisfactory [4], which may be due to nonendothelial vasculogenic mimicry (VM). Nonendothelial vasculature is comprised of highly aggressive and metastatic tumor cells, includes an internal basement membrane and a lack of endothelial cells in the internal lining. VM has been identified in multiple malignant tumors, including osteosarcoma [5], bladder cancer [6], breast cancer [7], prostate cancer [8], Glioma [9], ovarian Cancer [10], pancreatic cancer [11] and gastric adenocarcinoma [12]. Many studies have reported VM in a variety of poorly differentiated malignancies [7, 8, 12]. It has been reported that in the case of GC, VM not only provides a tumor blood supply, but also facilitates tumor metastases and VM of primary GC tissue. It is also an indicator of poor prognosis for GC patients after gastrectomy [13].
Galectins are a lectin family of 15 members that bind to carbohydrates, and contain one or multiple carbohydrate recognition domains. Recent studies have found that Galectin-1 (GAL-1) is highly expressed in a variety of malignant tumors, and that it is involved in various malignant functions, including tumorigenesis, development, invasion and metastasis, angiogenesis and immune escape [14]. However, its roles in VM remain largely uncharacterised. Our previous work demonstrated that GAL-1 can promote VM formation in GC by upregulating epithelial-mesenchymal transition (EMT) signaling [15], and that GAL-1 can induce EMT through upregulation of Hedgehog (Hh) signaling via Glioma-associated oncogene-1 (GLI1) in GC [16, 17]. The present study is based on the hypothesis that GAL-1 may also promote VM formation via GLI1 by activating the Hh signaling pathway in GC. In this study, we explored whether the GAL-1-Hh/ GLI signaling pathway was the underlying mechanism of VM in GC.
Results
GLI1 is overexpressed in GC tissues
In order to understand the role of Hh signaling in VM in GC, we detected the expression of GLI1 in 127 GC tissues and matched non-tumor tissues. For the GC tissues, the median GLI1 IHC score was 65.08 (6.73-164.78), whereas that of the matched non-tumor tissues was 35.21 (3.16-98.12) (Figure 1A). A significant difference in GLI1 expression was observed between GC and non-tumor tissues (P < 0.01; Figure 1B). The receiver operating curve statistic was used to distinguish positive and negative expression of GLI1 in 127 GC samples in accordance with the cutoff point for IHC scores. Scores ≥ 78.38 were considered to indicate positive expression (Figure 1C). This indicated a rate of positive GLI1 expression in GC tissues of 39.4% (50/127), and 8.66% (11/127) in the matched non-tumor tissues, which is a significant difference (χ2 = 32.81; P < 0.01).
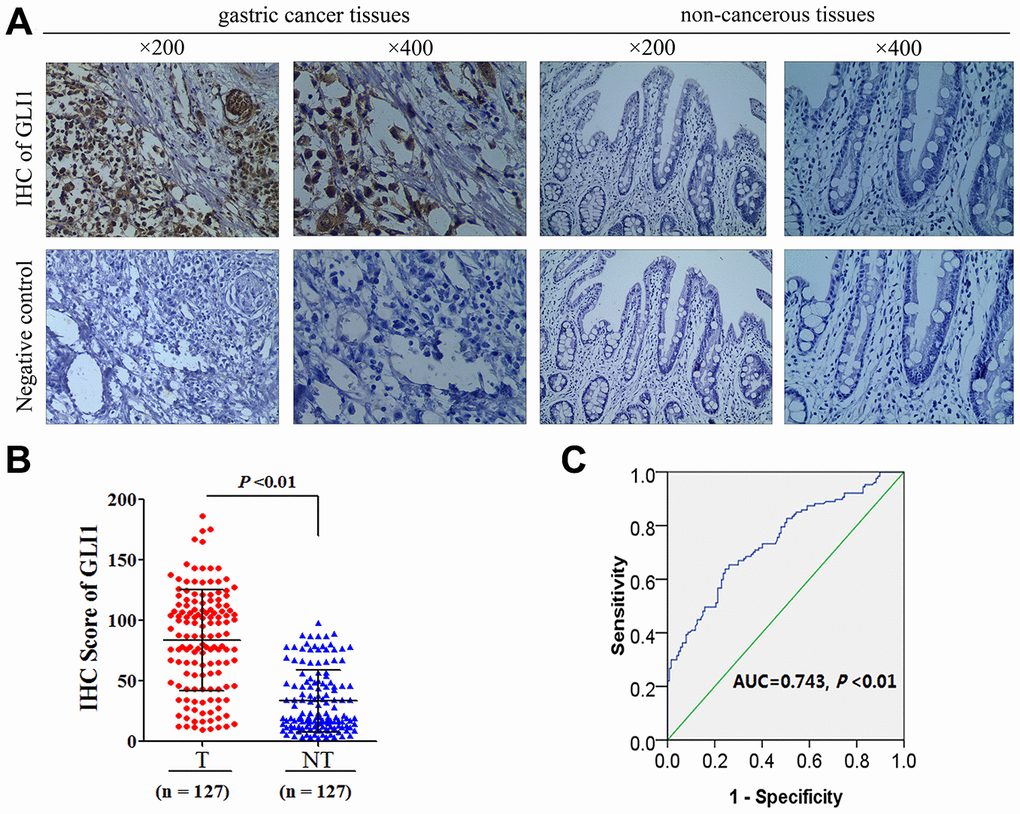
Figure 1. GLI1 is overexpressed in GC tissues (A) Representative images of IHC for GLI1 protein expression in GC tissues and matched non-tumor tissues. (B) GLI1 IHC scoring compared between tumor and matched non-tumor tissues. (C) ROC statistics were employed to estimate the cut-off points of GLI1 IHC scoring in human GC tissue.
GAL-1 expression is correlated with GLI1, and GLI1 expression is correlated with VM
To determine whether GAL-1 can activate Hh signaling and induce VM in GC tissue, we examined GAL-1 in GC tissue using IHC and examined VM using CD34/PAS double-staining. The median IHC score for GAL-1was 78.29 (9.51-186.24) in GC tissues. The GAL-1 IHC scores in GLI1-positive GC tissues were significantly higher than the GAL-1 IHC scores in GLI1-negative GC tissues (P <0.01; Figure 2A, 2B). GAL-1 IHC scores positively correlate with GLI1 IHC scores in GC tissues (r = 0.958; P < 0.01; Figure 2C). As shown in Figure 2D, one GC specimen exhibited endogenous cell-dependent vessels and VM. Red blood cells are indicated by the red arrow in VM and endogenous cell-dependent vessels. CD34/PAS double staining indicated VM in 29/127 cases (22.8%). GC tissues with GLI1 high expression were more likely to exhibit VM. The GLI1 IHC scores of GC tissues with VM were significantly higher than those without VM (P < 0.01; Figure 2E). These results suggested that GAL-1 may contribute to VM formation in GC through activating Hh signaling and promoting GLI1 expression.
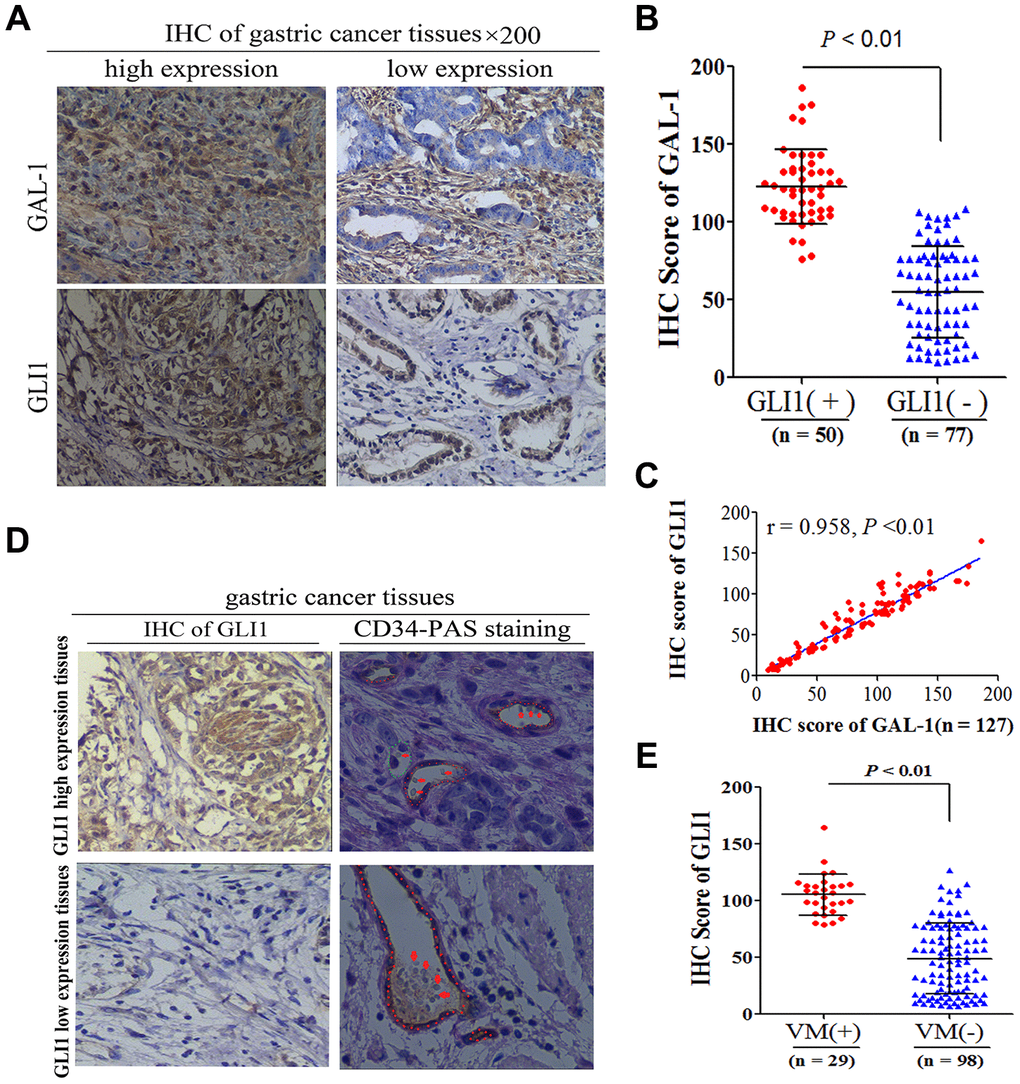
Figure 2. GAL-1 expression is correlated with GLI1, and GLI1 expression is correlated with VM. (A) Representative images of IHC indicating GLI1 and GAL-1 protein expression in GC tissues (×200 magnification). (B) The GAL-1 IHC scores in GLI1-positive GC tissues were significantly higher than the GAL-1 IHC scores in GLI1-negative GC tissues(P < 0.01) (C) GAL-1 IHC scores were positively correlated with GLI1 IHC scores in GC tissues (r = 0.958; P < 0.01). (D) GC tissues exhibiting high GLI1 expression were more likely to form VM (endogenous cell-dependent vessels are indicated by the red dotted line, VM is indicated by the green dotted line, and red blood cells are indicated by red arrows in VM and endogenous cell-dependent vessels; ×400 magnification). (E) The GLI1 IHC scores in GC tissues with VM were significantly higher than those without VM (P < 0.01).
GAL-1 promotes GLI1 expression both in vitro and in vivo
To confirm whether GAL-1 activation of Hh signaling promotes GLI1 expression in GC, LGALS1 was overexpressed and silencing in MGC-803 and AGS cells, confirmed by western blotting (Figure 3A–3D) and qRT-PCR (Figure 3E–3H). According to these results, shGal1#3 and LV-LGALS1-OE were selected for silencing and overexpression of GAL-1 in subsequent experiments, respectively. Western blotting indicated that LGALS1-overexpressing (OE-LGALS1) MGC-803 cells efficiently induced GLI1 protein expression compared with untransduced MGC-803 cells (wild-type control (WC) or negative control-transfected (OE-CON) cells) (Figure 4A). LGALS1- silencing (sh-LGALS1) MGC-803 cells efficiently inhibited GLI1 protein expression compared with WC or sh-CON MGC-803 cells (Figure 4B). We next performed qRT-PCR to evaluate LGALS1 and GLI1 mRNA expression in all cell lines, the results of which were consistent with those of western blotting (Figure 4E and 4F).
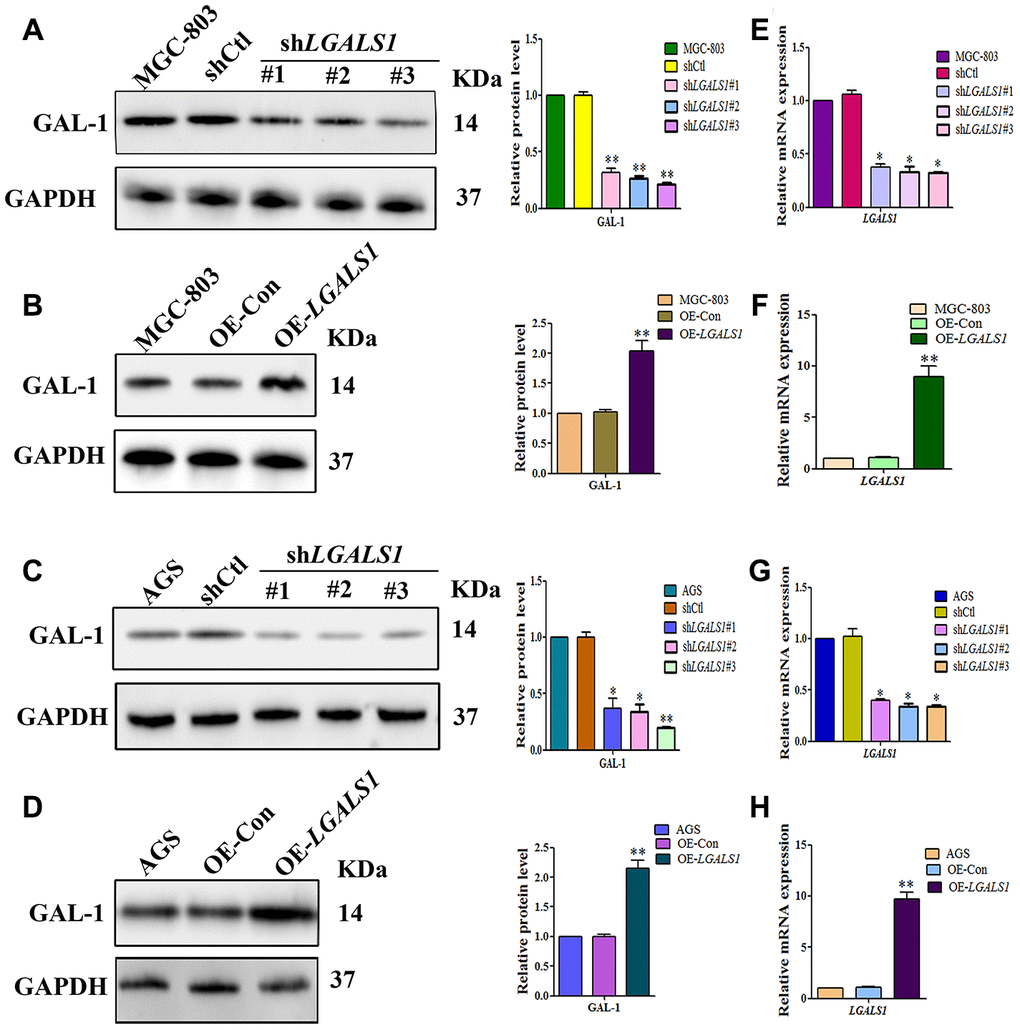
Figure 3. Lentiviral vectors were used to overexpress or silencing LGALS1 using 3 shRNAs. Western blot analysis showing decreased GAL-1 protein expression in (A) MGC-803 cells, and (C) AGS cells transfected with LGALS1 shRNAs, compared with cells transfected with control shRNA (shCtl). Western blot showing GAL-1 protein expression following overexpression of LGALS1 (OE-LGALS1) compared to the empty vector (OE-Con) in (B) MGC-803 cells, and (D) AGS cells. Reduced expression levels of LGALS1 mRNA in (E) MGC-803 cells, and (G) AGS cells transfected with LGALS1 shRNAs. Increased expression levels of LGALS1 with OE-LGALS1 in (F) MGC-803 cells, and (H) AGS cells transfected with OE-LGALS1. GAPDH was used as a loading control. (All n = 3, *P < 0.05, **P < 0.01).
To confirm that GAL-1 promotes GLI1 expression in vitro, we repeated these experiments in AGS cells. OE-LGALS1 AGS cells efficiently induced GLI1 protein expression (Figure 4C) and sh-LGALS1 AGS cells efficiently inhibited GLI1 protein expression (Figure 4D). These results were confirmed at the mRNA level by qRT-PCR (Figure 4G and 4H).
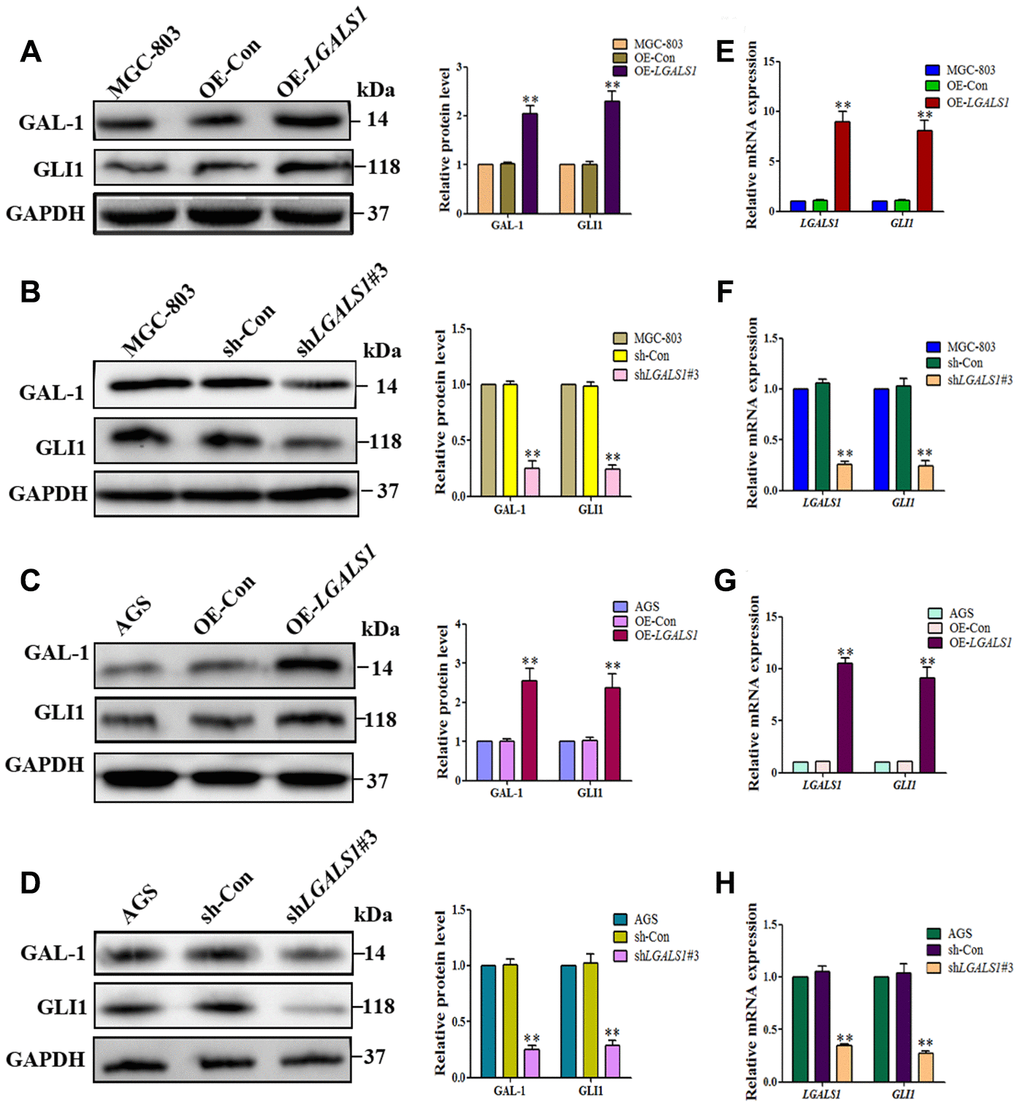
Figure 4. LGALS1 promotes GLI1 expression
IHC scores of GC tissues from the subcutaneous GC mice indicated that GLI1 expression was positively correlated with that of GAL-1 in all groups (P < 0.05; Figure 5A). Compared with the WC and OE-CON groups, GLI1 expression was elevated in the OE-LGALS1 group (P < 0.01; Figure 5B) and reduced in the sh-LGALS1 group (P < 0.01; Figure 5C). LGALS1 and GLI1 mRNA expression was consistent with the IHC results (Figure 5D and 5E).
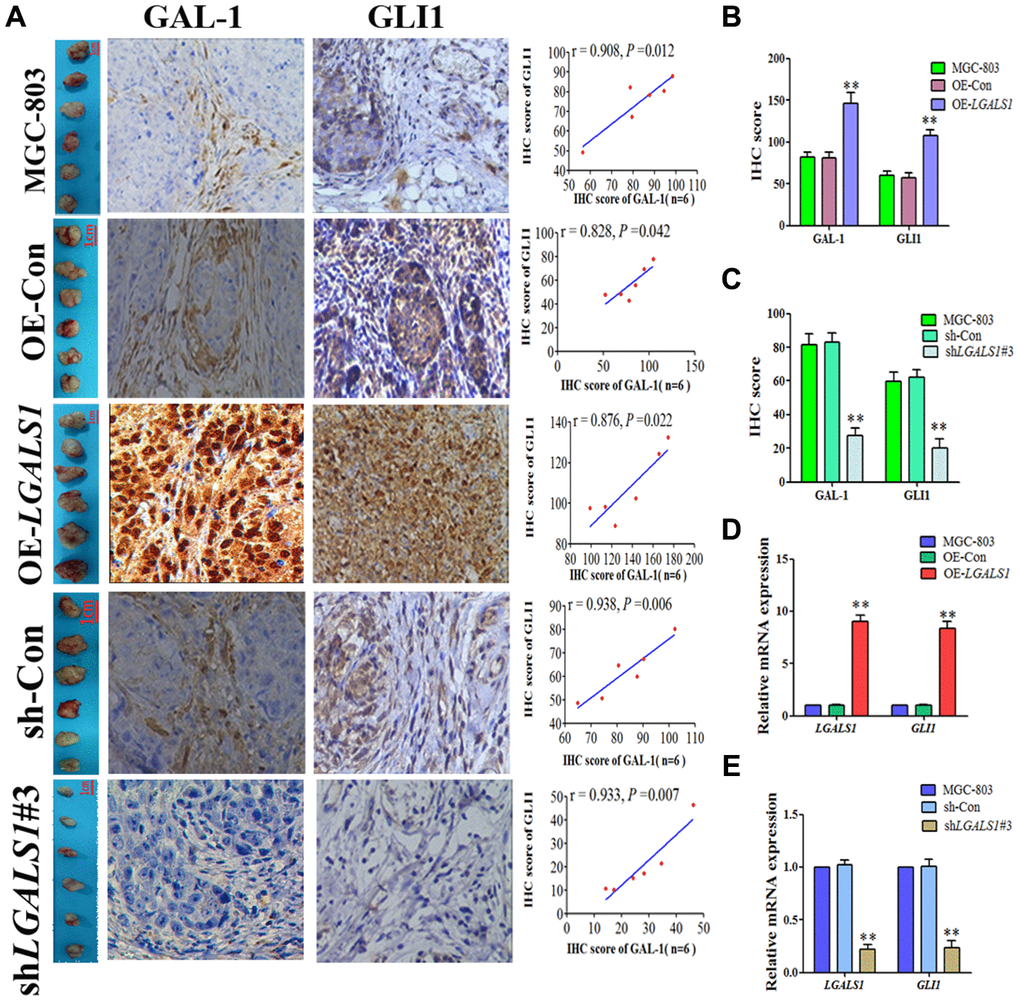
Figure 5. LGALS1 enhances GLI1 expression in vivo. (A) GLI1 and GAL-1 IHC scores were positively correlated in subcutaneous GC tissues from all groups (P < 0.05; ×200 magnification). (B) IHC scores indicating that GLI1 expression was elevated in the OE-LGALS1 group (P < 0.01). (C) IHC scores indicating that GLI1 expression was abrogated in the shLGALS1#3 group (P < 0.01). LGALS1 and GLI1 mRNA expression levels in (D) OE LGALS1-transduced and untransduced cells, and (E) shLGALS1#3-transduced and untransduced cells.
GLI1 promotes VM in vivo and in vitro
To confirm whether GLI1 promotes VM in vivo and in vitro, lentiviral vectors were used to silencing or overexpress GLI1 in MGC-803 and AGS cells. GLI1 silencing and overexpression was confirmed by western blotting (Figure 6A–6D) and qRT-PCR (Figure 6E–6H). According to these results, shGLI1#3 (for GLI1 silencing) and LV-GLI1-OE (for GLI1 overexpression) were selected for subsequent experiments in vivo and in vitro.
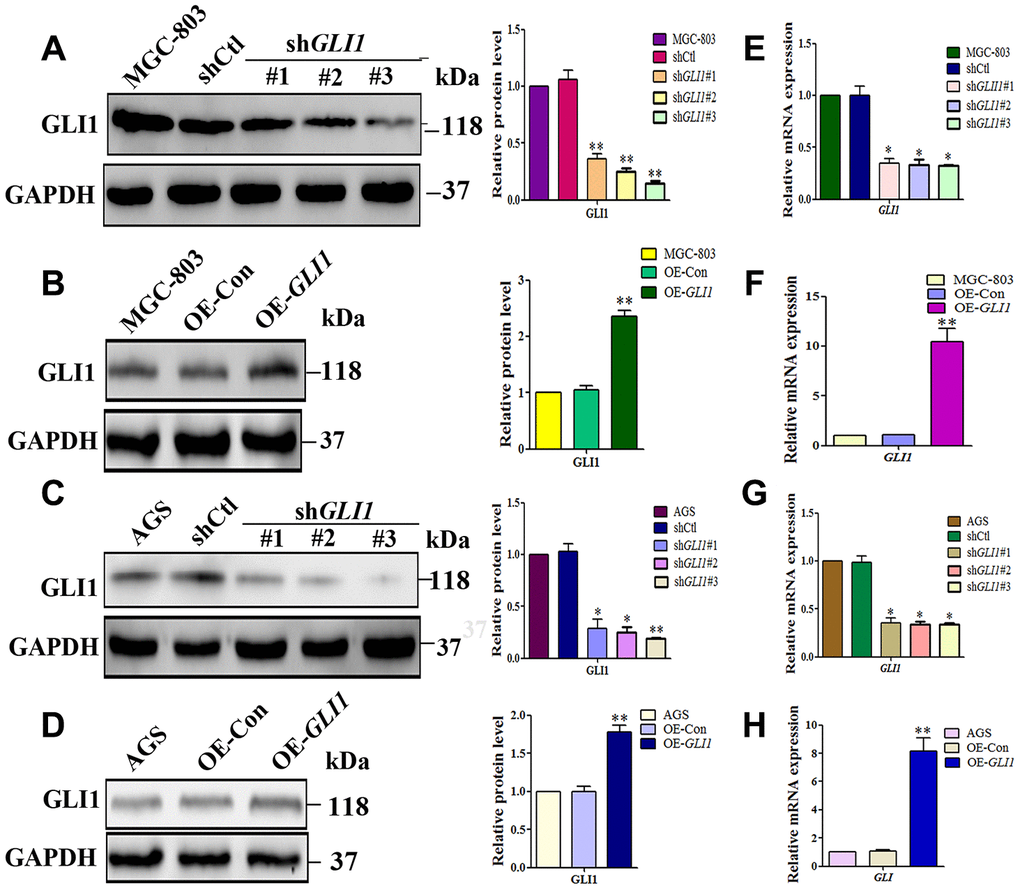
Figure 6. Lentiviral vectors were used to overexpress or silencing GLI1. Western blot analysis of GLI1 protein expression in (A) MGC-803 cells, and (C) AGS cells transfected with control shRNA (shCtl) or different GLI1 targeting sequences (shGLI1#1, shGLI1#2, shGLI1#3). Western blot showing GLI1 protein expression following overexpression of GLI1 (OE-GLI1) or the empty vector (OE-CON) transfection in (B) MGC-803 cells, and (D) AGS cells. Expression levels of GLI1 mRNA in (E and G) shGLI1 transduced and untransduced cells, and (F and H) OE-GLI1 transduced and untransduced cells. GAPDH served as a loading control. (n = 3, *P < 0.05, **P < 0.01).
Matrigel three-dimensional culture showed that OE-GLI1 transduction efficiently increased the capacity for tube-formation compared with WC or OE-CON MGC-803 and AGS cells. Meanwhile, sh-GLI1 transduction reduced the ability to form tube-like structures compared with WC or sh-CON MGC-803 and AGS cells (Figure 7A). Following subcutaneous GC implantation, the expression of GLI1 and the formation of VM structures in the OE-GLI1 and sh-GLI1 groups were detected by IHC and CD34/PAS double staining. CD34/PAS staining indicated that VM was significantly increased in the OE-GLI1 group and was not observed in the tumor tissues from the sh-GLI1 group (Figure 7B).
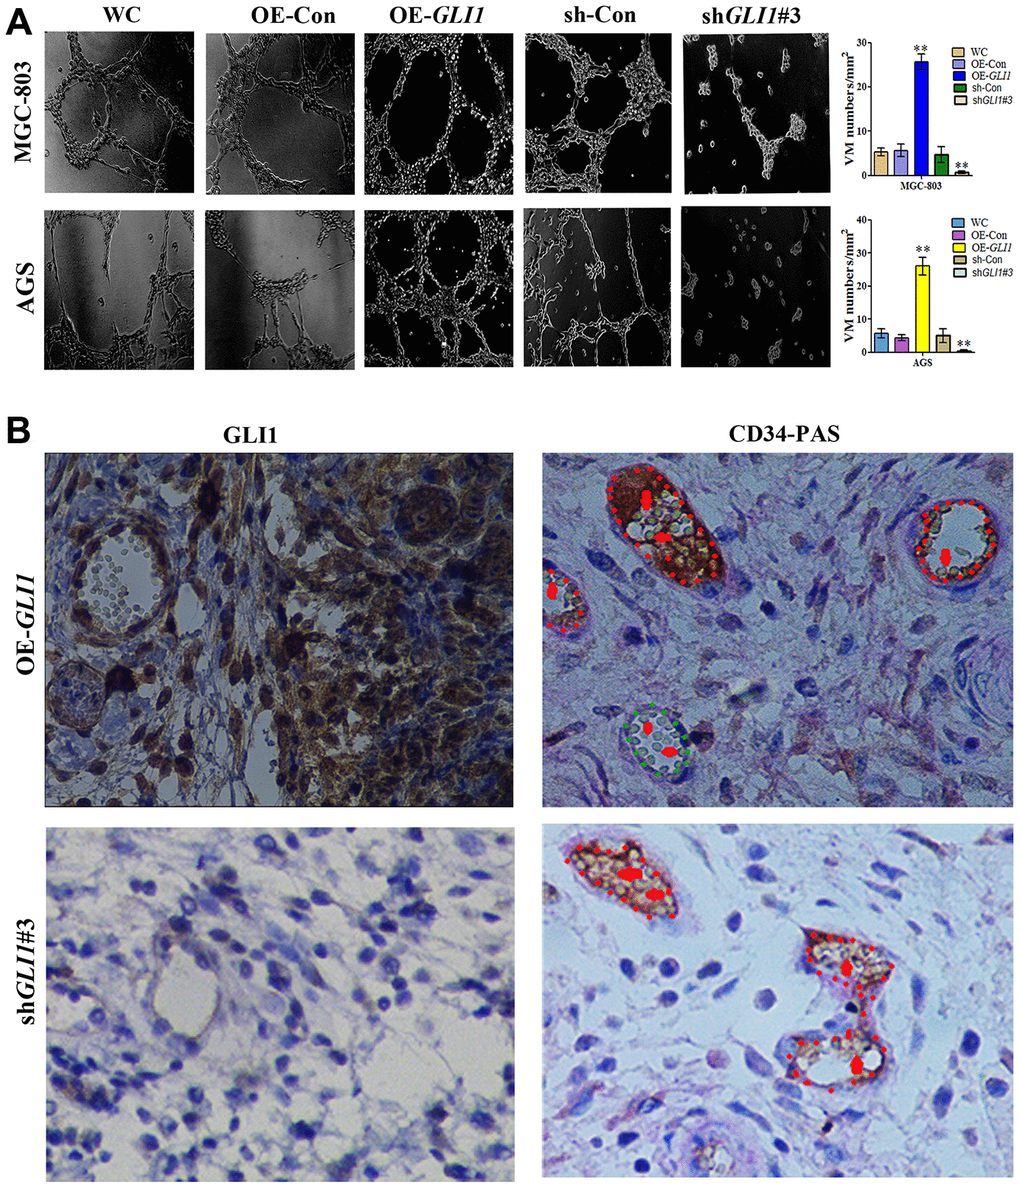
Figure 7. GLI1 promotes VM in vivo and in vitro. (A) Matrigel three-dimensional culture showing that GLI1 overexpression enhanced tube formation in MGC-803 and AGS cells, while silencing of GLI1 in MGC-803 and AGS cells inhibited their ability to form tube-like structures (×40 magnification; n = 3). (B) Expression of GLI1 and the formation of VM structures in the OE-GLI1 and sh-GLI1 subcutaneous GC mouse groups detected by IHC and CD34/PAS double staining. VM was significantly increased in the OE-GLI1 group, and was absent in the shGLI1#3 group (endogenous cell-dependent vessels are indicated by the red dotted line, VM is indicated by the green dotted line, and red blood cells are indicated by red arrows in VM and endogenous cell-dependent vessels; ×400 magnification).
GAL-1 promotes VM via the Hh signaling pathway
To investigate whether GAL-1 promotes VM in GC through activation of the Hh pathway, the GLI1-specific antagonist, GANT61, was used to explore the relationship between GAL-1-induced VM in GC and Hh pathway activation. An MTT assay indicated that 10 μM GANT61 did not affect cell number at 24 h. However, Matrigel three-dimensional culture demonstrated that OE-LGALS1 efficiently increased tube-formation capacity in MGC-803 cells and AGS cells, and that GANT61 can significantly inhibit this effect (Figure 8A). Meanwhile, sh-LGALS1 reduced formation of tube-like structures in MGC-803 cells and AGS cells. However, simultaneous silencing of LGALS1 and overexpression of GLI1 in MGC-803 cells and AGS cells rescued this reduction in tube-formation capacity (Figure 8B). These results suggest that GLI1 affects VM formation independent of GAL-1.
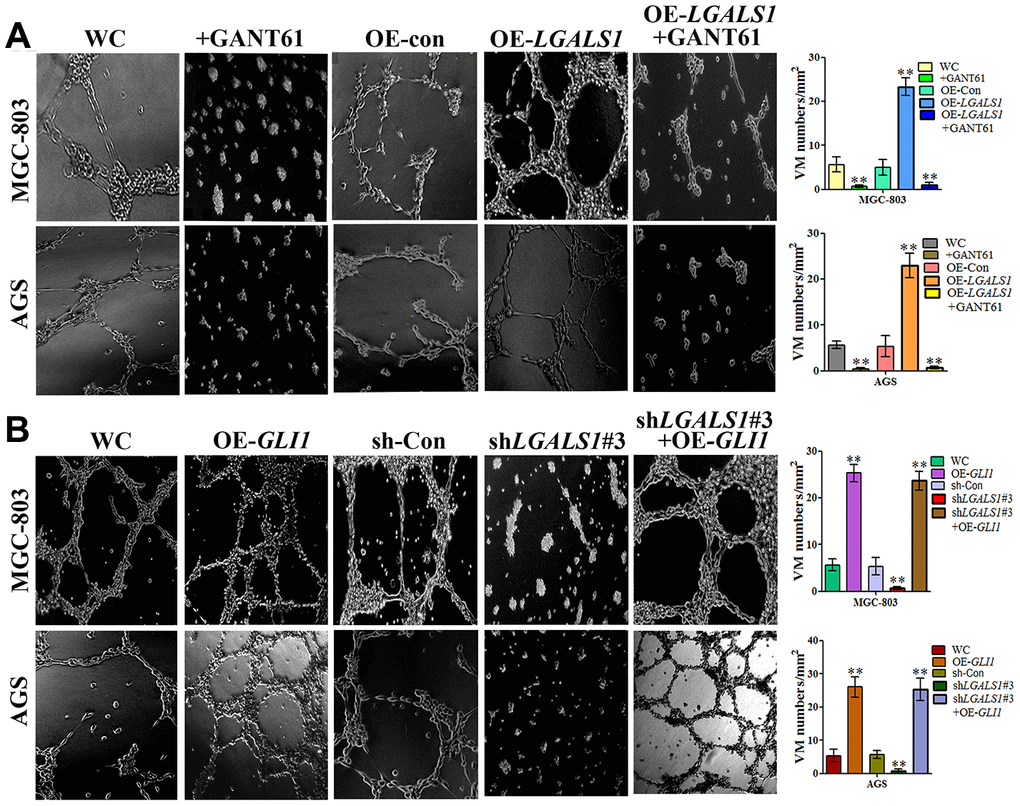
Figure 8. GAL-1 increases VM through the Hh signaling pathway. (A) Matrigel three-dimensional culture indicating that OE-LGALS1 efficiently increased tube-formation by MGC-803 cells and AGS cells, and the inhibition of this effect by GANT61. (B) sh-LGALS1 reduces the ability of MGC-803 cells and AGS cells to form tube-like structures. Simultaneous silencing of LGALS1 and overexpression of GLI1 rescued this reduction in tube-formation capacity. (×40 magnification; n=3).
To further investigate regulation of VM by GLI1, the expression of VM-related molecules was measured by qRT-PCR and western blotting in OE-GLI1 and sh-GLI1 MGC-803 and AGS cells, including MMP14, MMP2 and Ln5γ2 (LAMC2). We found that the mRNA expression of MMP2 (P < 0.05), MMP-14 (P < 0.05) and LAMC2 (P < 0.05) was significantly lower in sh-GLI1 cells than in the WC and negative control groups. The mRNA expression of MMP14 (P < 0.01), MMP2 (P < 0.01) and LAMC2 (P < 0.01) was significantly higher in OE-GLI1 cells than the WC and negative control groups (Figure 9A and 9B). Western blotting confirmed that protein expression was consistent with that of the mRNAs (Figure 9C and 9D).
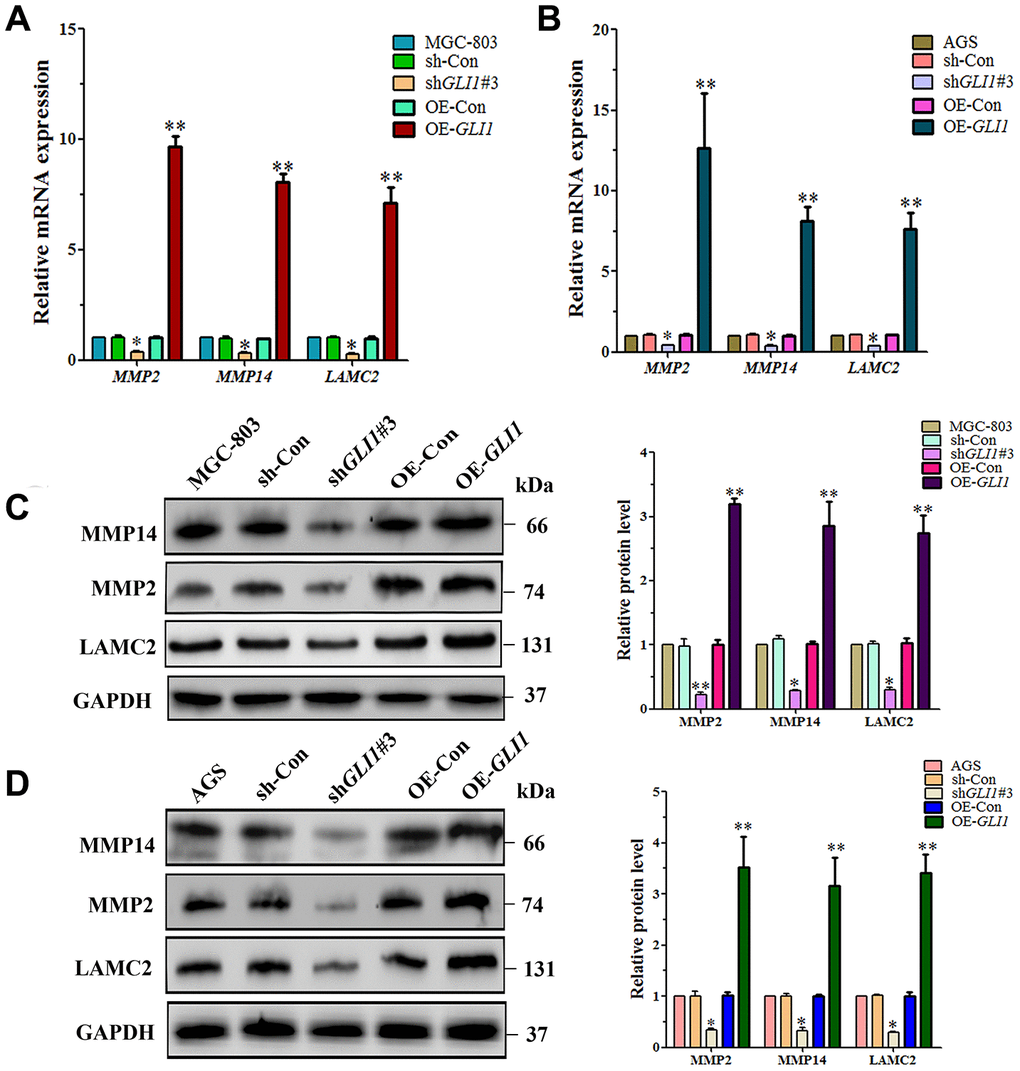
Figure 9. GLI1 affects expression of VM markers - in MGC-803 cells and AGS cells. qRT-PCR analysis of MMP14, MMP2 and LAMC2 mRNA expression in (A) MGC-803 cells, and (B) AGS cells. Western blot analysis of MMP14, MMP2, and LAMC2 protein expression in (C) MGC-803 cells, and (D) AGS cells. (All n=3, *P < 0.05, **P < 0.01).
Discussion
VM occurs when highly malignant tumor cells interact with the extracellular matrix to form a vascular system that can transport blood, reshape the tumor microcirculation and connect with host blood vessels to obtain blood supply to tumors. In 1999, Maniotis et al. [18] discovered and defined VM in melanoma; since, such channels containing red blood cells but no endothelial cells, have been identified in a variety of malignant tumors [5, 8, 12, 19–21]. In recent years, it has been demonstrated that VM also exists in GC tissues, that it is closely associated with invasion and metastasis, and that VM is indicative of poor prognosis for GC patients [13, 22, 23]. At present, antiangiogenic targeted drug therapy is widely regarded as a rescue treatment for advanced GC [24–26]. However, the inhibitory effect on mimetic vessels independent of vascular endothelial cells is poor [22, 27]. Therefore, VM should be considered as a target for anti-GC therapy. In a previous study [13, 15], we observed that VM formation was positively associated with the expression of GAL-1 in primary GC tissue, and that GAL-1 can promote VM formation in GC through upregulating EMT signaling. However, the mechanism by which GAL-1 promotes VM via EMT in GC remain unknown. Numerous signaling pathways participate in the regulation of EMT through cooperation and antagonism, such as Ras-MAPK, Rho, Src-FAK, ERK1/2, PI3K/AKT and Hh [28–31]. GAL-1 can activate the Hh signaling pathway and promotes EMT in GC cells [32]. However, whether GAL-1 induces VM through Hh-GLI signaling activation via EMT in GC requires further exploration.
The Hh/GLI signal pathway was first identified in Drosophila [33] and is controlled by two receptors on the target cell membrane: patched (Ptc) and smoothened (Smo). Ptc is composed of 12 transmembrane domains, that can bind directly to the ligand and negatively regulate Hh signaling. Smo is a G-protein coupled transmembrane protein and is an essential receptor for Hh signal transmission. The nuclear factors involved in Hh signal transduction include transcription factor Ci/GLI, protein kinase A (PKA), etc. In standard conditions, Ptc inhibits the activity of Smo protein, thereby inhibiting the downstream pathway. Canonical Hh signaling involves Ptc binding of Hh, relieving inhibition of Smo and prompting GLI proteins to enter the nucleus and activate transcription of downstream target genes [34].
During embryogenesis, Hh/GLI signaling is activated and regulates cell proliferation and differentiation, whereas it is silent in adults [35]. However, Hh/GLI hyperactivation is associated with carcinogenesis in a variety of human malignancies including GC [17, 35–37]. We used IHC to detect the GLI1 protein, a marker of Hh signaling in 127 cases of GC and matched non-tumor tissues. We found that GLI1 expression in GC tissues was significantly higher than that in matched non-cancerous tissues. This result is similar to that of a study in non-small cell lung cancer [38]. We also found that the GAL-1 IHC scores of GLI1-positive GC tissues were significantly higher than those of GLI1-negative GC tissues (GAL-1 IHC scores positively correlate with GLI1 IHC scores in GC tissues). Clearly, these results indicate that GAL-1 is closely associated with GLI1 in GC.
Hh/GLI1 signaling is a promising target for cancer therapies, as the pathway controls major biological hallmarks of cancer, including proliferation, metastasis, survival, self-renewal and angiogenesis [39, 40]. Our previous study demonstrated that GAL-1 can induce EMT through upregulation of the Hh signaling pathway via GLI1 in GC [16]. We have also previously verified that cancer-associated fibroblasts induce EMT through β1 integrin-mediated upregulation of GLI1 in GC [17]. The present study demonstrates a positive correlation between GAL-1 and GLI1 expression in GC tissues, and further work in vitro and in vivo confirms that GAL-1/LGALS1 promotes the expression of GLI1. These findings suggest that GAL-1 may activate the Hh/GLI1 signaling pathway in GC. Intracellular GAL-1 acts as a scaffold protein for intracellular signaling pathways in a carbohydrate-independent manner. Intracellular GAL-1 is a major regulator of H-Ras nanoclusters [41–43], and Ras signaling is known to induce or enhance Sonic Hedgehog (SHh) expression [44]. We speculate that GAL-1/LGALS1 activates the Hh/GLI1 signaling pathway via Ras/SHh.
Although numerous studies have confirmed that the Hh/GLI1 pathway promotes tumor invasion and metastasis, the role of Hh/GLI signaling in VM has not been previously studied. The findings of the present study suggest that GAL-1/LGALS1 may activate the Hh/GLI1 signaling pathway in GC tissues. Three-dimensional culture showed that overexpression of GLI1 promotes VM in vitro. In vivo study also revealed that overexpression of GLI1 can significantly promote VM and that GLI1-silencing can inhibit VM in subcutaneously implanted GC. To confirmed that GAL-1/LGALS1 promotes the formation of VM in GC through promoting the expression of GLI1, we used GANT61, a GLI1-specific antagonist, to investigate whether GAL-1/LGALS1 promotes VM in GC through activation of the Hh pathway. GANT61 effectively inhibited the formation of VM structures by MGC-803 and AGS cells. Our previous study found that silencing of LGALS1 inhibit the VM structure formation ability of MGC-803 cells [15]. Interestingly, simultaneous silencing of LGALS1 and overexpression of GLI1 in MGC-803 cells and AGS cells rescued this inhibition in tube-formation capacity. This indicates that GLI1 effects on VM formation independent of LGALS1.
It has been reported that MMPs-Ln5γ2 is the final step of the VM signaling pathway [45]. In this study, we confirmed that GLI1 promotes the expression of MMP14, MMP2 and LAMC2 mRNA and protein in MGC-803 and AGS cells. These results support the hypothesis that GAL-1 promotes the initiation of VM through Hh/GLI signaling in GC.
Conclusions
Taken together, the results of this study suggest that Hh/GLI signaling pathway components are activated in GC by GAL-1/LGALS1, and that GLI1 controls initiation of VM in GC. These findings provide evidence that the GAL-1/Hh/GLI1 pathway plays a role in VM in GC. This provides novel insight into the mechanisms underlying VM, and may contribute towards the identification of a therapeutic target for GC. However, further study is required to understand the mechanism of GAL-1/LGALS1 activation of GLI1, GLI1 transcriptional modification and the mechanism of VM initiation. Inhibition of these mechanisms may have the potential to overcome VM in GC and improve therapeutic outcomes for patients with refractory GC.
Materials and Methods
Tumor tissue samples
We enrolled 127 patients with gastric adenocarcinoma. No patients had received preoperative neoadjuvant chemotherapy or radiotherapy, but all patients underwent radical gastrectomy and D2 lymphadenectomy at the Gastrointestinal Surgery Department, Taizhou People’s Hospital of Jiangsu province. GC tissue and matching adjacent non-tumor tissue for immunohistochemistry (IHC) and histochemical staining were formalin-fixed and paraffin-embedded. GC tissue and matching adjacent non-tumor tissue was collected from 15 patients for molecular analysis. Our study was approved by the Clinical Research Ethics Committee of Taizhou People’s Hospital (TZRY-EC-12-068).
Animal models
Five-week-old male athymic mice were purchased from the Comparative Medicine Centre of Yangzhou University (Yang Zhou, JiangSu, China), and used to establish subcutaneous GC implantation. These experiments were approved by the Ethics Committee of Yang Zhou University (YZU-EC-JS2352). The mice were bred in a laminar flow cabinet under pathogen-free conditions. LGALS1-overexpressing (OE-LGALS1) MGC-803 cells, LGALS1- silencing (sh-LGALS1) MGC-803 cells, GLI1-overexpressing (OE-GLI1) MGC-803 cells, silencing GLI1 MGC-803 cells (sh-GLI1), wild-type control MGC-803 cells or vector control MGC-803 cells were inoculated into the right flank (2x10⁶ cells/mouse; n = 6). Mice were sacrificed on day 21 and the subcutaneous GC tumors were harvested. Subcutaneous GC tumors were examined by hematoxylin and eosin (H&E) staining and CD34-PAS dual staining.
Reagents and antibodies
GANT61 was purchased from Sigma Biotechnology (St. Louis, MO, USA). The anti- GAL-1 antibody was purchased from Cell Signaling Technology (13888S and 12936S, Danvers, MA, USA), the anti-GLI1 was purchased from Abcam (ab217326, Cambridge, UK) and Bioss (bs-1206R, Beijing, China), anti-MMP14 (ab78738), anti-MMP2(ab92536), anti-LAMC2 (ab210959 and ab274376) and anti-CD34(ab81289) antibodies were purchased from Abcam (Cambridge, UK), and the anti-GAPDH antibody(sc-47724), horseradish peroxidase (HRP)-conjugated goat anti-mouse IgG(sc-516102) and goat anti-rabbit IgG(sc-2357) were provided by Santa Cruz Biotechnology (Santa Cruz, CA, USA). The PAS staining kit was provided by Leagene Biotechnology Co, Ltd (Beijing, People’s Republic of China). The MTT assay kit and dimethyl sulfoxide (DMSO) were provided by Sigma Biotechnology (St. Louis, MO, USA).
Cell line and cell culture
The human gastric adenocarcinoma cell line, MGC-803, was provided by The Type Culture Collection of the Chinese Academy of Sciences (Shanghai, China). Cells were cultured in RPMI (Thermo Fisher Scientific, Waltham, MA, USA) supplemented with 10% (V/V) fetal bovine serum (FBS; Thermo Fisher Scientific), 100 U/ml penicillin and 100 mg/ml streptomycin (Gibco, Grand Island, Waltham, MA, USA). Cells were maintained at 37°C in a humidified atmosphere containing 5% (V/V) CO2 [15], and passaged via trypsinization when 80% confluence was reached.
RNA extraction and qRT-PCR
Total RNA was extracted using an RNeasy Mini Kit (Invitrogen, Waltham, MA, USA), and cDNA was synthesized using a Reverse transcription kit (Takara, Shiga, Japan), according to manufacturer’s instructions. qRT-PCR was performed with SYBR Green dye (Roche Diagnostics, Mannheim, Germany) and analyzed using an iQ5 Multicolor Real-Time PCR Detection System (Bio-Rad, Hercules, CA, USA). The thermocycling conditions were as follows: 95°C for 30 s, then by 40 cycles of 95°C for 5 s, 60°C for 30 s and 72°C for 30 s. Glyceraldehyde phosphate dehydrogenase (GAPDH) was used as the reference control gene. The primers sequences used are listed in Table 2.
Table 2. Primer sequences used for quantitative RT-PCR.
| Gene | Primer sequence (5’ to 3’) |
| GLI1 | F: GGGATGATCCCACATCCTCAGTC |
| R: CTGGAGCAGCCCCCCCAGT | |
| LGALS1 | F: GCTGAACCTGGGCAAAGACAG |
| R: GTTGAGGCGGTTGGGGAACTT | |
| MMP-14 | F: CTGCGTCCATCAACACTGCCTA |
| R: GCCCAGCTCCTTAATGTGCTTG | |
| MMP-2 | F: GGCGGTCACAGCTACTTCTTC |
| R: GCAGCCTAGCCAGTCGGATT | |
| LAMC2 | F: TCGGGAGCCATGTCATGTGAGTG |
| R: CCCAGCATCAGGAAGCAAGGAGT | |
| GAPDH | F: TGACTTCAACAGCGACACCCA |
| R: CACCCTGTTGCTGTAGCCAAA |
Western blotting
Extraction kit (Beyotime, Shanghai, China) was used to isolate total-cell extracts and nuclear extracts. For all samples, 20 μg cell lysate was separated by 12% sodium dodecyl sulfate-polyacrylamide gel electrophoresis (SDS-PAGE) and the separated proteins were transferred into a nitrocellulose membrane (GE Healthcare Life Sciences, Pittsburgh, PA, USA). Blots were probed with anti-GLI1, anti-GAL-1, anti-MMP14, anti-MMP2, anti-LAMC2 or anti-GAPDH primary antibody at a dilution of 1:2,000. The secondary HRP antibody was also used at a dilution of 1:2,000. Protein bands were visualized using West Picochemiluminescent Substrate (Pierce, Carlsbad, CA, USA) and quantified using densitometric image analysis software (Image Master VDS; Pharmacia Biotech). GAPDH was used as a loading control. All western blotting analysis assays were performed in triplicate.
Cell viability assay
The 3-(4-5-dimethylthiazol-2-yl)-2, 5-diphenyltetrazoliumbromide dye reduction assay (MTT assay) was used to determine cell viability. Cells were seeded into a 96-well flat bottom plate at 5×10³ cells/well. The cells were cultured at 37°C with 5% CO2 in a humidified atmosphere. After an overnight incubation, the cells were treated with various concentrations of GANT61 (5μM, 10 μM, 15 μM and 20 μM). After GANT61 treatment for 24 h, 20 μL MTT was added to each well and incubated for 4 h. Following the subsequent removal of the supernatant, 150 μL dimethyl sulfoxide (DMSO) was added to dissolve the formazan crystals. Absorbance was measured at 490 nm with an Enzyme-linked Immunosorbent Detector (Model 550; Bio-Rad, Hercules, CA, USA).
IHC
IHC was performed for human GC tissues, matching adjacent non-tumor tissue and murine subcutaneous GC tumor tissue. GAL-1 (dilution, 1:200), GLI1 (dilution, 1:200) or CD34 (dilution, 1:100) primary antibodies were incubated with the slides overnight at 4°C, the following steps were performed as per our previous report [13]. GAL-1 and GLI1 staining was imaged digitally using the same light exposure and evaluated using Image Pro Plus (IPP), a digitalized IHC scoring program (Media Cybernetics, San Diego, CA). The immunostaining results are expressed as the percentage of positively stained cells multiplied by staining intensity score (0, 1, 2 or 3) to yield scores of 0-300.
Three-dimensional culture
Coating of 24-well plates with 200 μl growth factor-reduced Matrigel (BD Biosciences, San Diego, CA, USA) was carried out, and incubated at 37°C for 1 h for polymerization. A total of 1x10⁵ cells in 600 μl of medium were plated onto the polymerized gel and incubated cells at 37°C for 24 h. The cells were imaged under an inverted microscope (OLYMPUS-U-HGLGPS-IX73). All experiments were performed in triplicate.
CD34-PAS dual staining and VM evaluation
All specimens were formalin-fixed and paraffin-embedded. After CD34 IHC described above, PAS staining was performed, according to the kit manufacturer’s protocol. After the DAB reaction, sections were treated with 0.5% periodic acid solution for 10 min. Prior to staining with Schiff solution for 20 min at room temperature, sections were washed with distilled water 3 times. Sections were then counterstained with hematoxylin, dehydrated, cleared and mounted. VM was analyzed at x200 magnification in 10 randomly selected fields of view. Channel-like structures stained positively for PAS and negatively for CD34, and containing red cells were considered to have a VM-positive status.
Statistical analysis
Statistical analysis was conducted using SPSS software (version 16; Chicago, IL, USA). Categorical variables were compared using the Chi-squared test. Continuous variables are presented as the mean ± standard error of the mean, Student’s t-test was used to compare between groups based on the normal distribution of the data. Pearson or Spearman’s correlation coefficient were used to determine the relationship between two variables. P < 0.05 was considered to indicate a statistically significant difference.
Ethical approval
This clinical study was approved by the Clinical Research Ethics Committee of Taizhou People’s Hospital (TZRY-EC-12-068), all patients consented to participate in our study. The animal experiments were approved by the Ethics Committee of Yang Zhou University (YZU-EC-JS2352).
Abbreviations
DMSO: Dimethyl sulfoxide; FBS: Fetal bovine serum; GAL-1: Galectin-1; GC: Gastric cancer; H&E: Hematoxylin and eosin; HRP: Horseradish peroxidase; IHC: Immunohistochemical;; OE: Overexpressing; PAS: Periodic acid-Schiff; PKA: Protein kinase A; qRT-PCR: Quantitative reverse transcription-PCR; Smo: Smoothened; SDS-PAGE: Sodium dodecyl sulfate-polyacrylamide gel electrophoresis; SHh: Sonic Hedgehog; VEGFR: Vascular endothelial growth factor receptor; VM: Vasculogenic mimicry; WC: Wild-type control.
Author Contributions
XLY conceived and designed the experiments. JW, YJW and QHL performed the experiments. ZYC, XJZ, GYL and JCH analyzed the data. XLY, YZ and JWD helped with sample collection. XLY and CC wrote the paper. DHC supervised all experimental work. All authors read and approved the final manuscript.
Acknowledgments
We would like to thank the native English-speaking scientists of Elixigen Company (Huntington Beach, CA, USA) for editing our manuscript.
Conflicts of Interest
The authors declare that they have no conflicts of interest.
Funding
This work was supported in part by the China Postdoctoral Science Foundation [grant numbers 2018M632400], Natural Science Foundation of Jiangsu province [grant numbers BK20181232], Science and Technology Support Program (Social Development) Project of Taizhou City: [grant numbers TS202012], Taizhou fifth phase 311 talent training project [grant numbers RCPY202022].
References
- 1. Siegel RL, Miller KD, Jemal A. Cancer statistics, 2020. CA Cancer J Clin. 2020; 70:7–30. https://doi.org/10.3322/caac.21590 [PubMed]
- 2. Wang FH, Shen L, Li J, Zhou ZW, Liang H, Zhang XT, Tang L, Xin Y, Jin J, Zhang YJ, Yuan XL, Liu TS, Li GX, et al. The Chinese society of clinical oncology (CSCO): clinical guidelines for the diagnosis and treatment of gastric cancer. Cancer Commun (Lond). 2019; 39:10. https://doi.org/10.1186/s40880-019-0349-9 [PubMed]
- 3. Mawalla B, Yuan X, Luo X, Chalya PL. Treatment outcome of anti-angiogenesis through VEGF-pathway in the management of gastric cancer: a systematic review of phase II and III clinical trials. BMC Res Notes. 2018; 11:21. https://doi.org/10.1186/s13104-018-3137-8 [PubMed]
- 4. Smyth EC, Verheij M, Allum W, Cunningham D, Cervantes A, Arnold D, and ESMO Guidelines Committee. Gastric cancer: ESMO clinical practice guidelines for diagnosis, treatment and follow-up. Ann Oncol. 2016; 27:v38–49. https://doi.org/10.1093/annonc/mdw350 [PubMed]
- 5. Yao N, Ren K, Gu XJ, Wu SJ, Shi X, Chang Q, Li YG, Gao ZX, Jin QM, Zhang J, Wang C, Zhou J. Identification of potential crucial genes associated with vasculogenic mimicry in human osteosarcoma based on gene expression profile. Neoplasma. 2020; 67:286–295. https://doi.org/10.4149/neo_2019_190414N329 [PubMed]
- 6. Yang Z, Chen J, Xie H, Liu T, Chen Y, Ma Z, Pei X, Yang W, Li L. Androgen receptor suppresses prostate cancer metastasis but promotes bladder cancer metastasis via differentially altering miRNA525-5p/SLPI-mediated vasculogenic mimicry formation. Cancer Lett. 2020; 473:118–29. https://doi.org/10.1016/j.canlet.2019.12.018 [PubMed]
- 7. Mitra D, Bhattacharyya S, Alam N, Sen S, Mitra S, Mandal S, Vignesh S, Majumder B, Murmu N. Phosphorylation of EphA2 receptor and vasculogenic mimicry is an indicator of poor prognosis in invasive carcinoma of the breast. Breast Cancer Res Treat. 2020; 179:359–70. https://doi.org/10.1007/s10549-019-05482-8 [PubMed]
- 8. Da J, Xu M, Wang Y, Li W, Lu M, Wang Z. Kaempferol promotes apoptosis while inhibiting cell proliferation via androgen-dependent pathway and suppressing vasculogenic mimicry and invasion in prostate cancer. Anal Cell Pathol (Amst). 2019; 2019:1907698. https://doi.org/10.1155/2019/1907698 [PubMed]
- 9. Cai HP, Wang J, Xi SY, Ni XR, Chen YS, Yu YJ, Cen ZW, Yu ZH, Chen FR, Guo CC, Zhang J, Ke C, Wang J, Chen ZP. Tenascin-cmediated vasculogenic mimicry formation via regulation of MMP2/MMP9 in glioma. Cell Death Dis. 2019; 10:879. https://doi.org/10.1038/s41419-019-2102-3 [PubMed]
- 10. Ayala-Domínguez L, Olmedo-Nieva L, Muñoz-Bello JO, Contreras-Paredes A, Manzo-Merino J, Martínez-Ramírez I, Lizano M. Mechanisms of vasculogenic mimicry in ovarian cancer. Front Oncol. 2019; 9:998. https://doi.org/10.3389/fonc.2019.00998 [PubMed]
- 11. Yang J, Zhu DM, Zhou XG, Yin N, Zhang Y, Zhang ZX, Li DC, Zhou J. HIF-2α promotes the formation of vasculogenic mimicry in pancreatic cancer by regulating the binding of Twist1 to the VE-cadherin promoter. Oncotarget. 2017; 8:47801–15. https://doi.org/10.18632/oncotarget.17999 [PubMed]
- 12. Kim HS, Won YJ, Shim JH, Kim HJ, Kim J, Hong HN, Kim BS. Morphological characteristics of vasculogenic mimicry and its correlation with EphA2 expression in gastric adenocarcinoma. Sci Rep. 2019; 9:3414. https://doi.org/10.1038/s41598-019-40265-7 [PubMed]
- 13. You X, Wang Y, Wu J, Liu Q, Chen D, Tang D, Wang D. Prognostic significance of galectin-1 and vasculogenic mimicry in patients with gastric cancer. Onco Targets Ther. 2018; 11:3237–44. https://doi.org/10.2147/OTT.S165899 [PubMed]
- 14. You X, Wang Y, Wu J, Liu Q, Chen D, Tang D, Wang D. Galectin-1 promotes metastasis in gastric cancer through a sphingosine-1-phosphate receptor 1-dependent mechanism. Cell Physiol Biochem. 2018; 51:11–30. https://doi.org/10.1159/000495157 [PubMed]
- 15. You X, Liu Q, Wu J, Wang Y, Dai J, Chen D, Zhou Y, Lian Y. Galectin-1 promotes vasculogenic mimicry in gastric cancer by upregulating EMT signaling. J Cancer. 2019; 10:6286–97. https://doi.org/10.7150/jca.33765 [PubMed]
- 16. Chong Y, Tang D, Gao J, Jiang X, Xu C, Xiong Q, Huang Y, Wang J, Zhou H, Shi Y, Wang D. Galectin-1 induces invasion and the epithelial-mesenchymal transition in human gastric cancer cells via non-canonical activation of the hedgehog signaling pathway. Oncotarget. 2016; 7:83611–26. https://doi.org/10.18632/oncotarget.13201 [PubMed]
- 17. Chong Y, Tang D, Xiong Q, Jiang X, Xu C, Huang Y, Wang J, Zhou H, Shi Y, Wu X, Wang D. Galectin-1 from cancer-associated fibroblasts induces epithelial-mesenchymal transition through β1 integrin-mediated upregulation of Gli1 in gastric cancer. J Exp Clin Cancer Res. 2016; 35:175. https://doi.org/10.1186/s13046-016-0449-1 [PubMed]
- 18. Maniotis AJ, Folberg R, Hess A, Seftor EA, Gardner LM, Pe’er J, Trent JM, Meltzer PS, Hendrix MJ. Vascular channel formation by human melanoma cells in vivo and in vitro: vasculogenic mimicry. Am J Pathol. 1999; 155:739–52. https://doi.org/10.1016/S0002-9440(10)65173-5 [PubMed]
- 19. Zhang JG, Zhang DD, Liu Y, Hu JN, Zhang X, Li L, Mu W, Zhu GH, Li Q, Liu GL. RhoC/ROCK2 promotes vasculogenic mimicry formation primarily through ERK/MMPs in hepatocellular carcinoma. Biochim Biophys Acta Mol Basis Dis. 2019; 1865:1113–25. https://doi.org/10.1016/j.bbadis.2018.12.007 [PubMed]
- 20. Bissanum R, Lirdprapamongkol K, Svasti J, Navakanitworakul R, Kanokwiroon K. The role of WT1 isoforms in vasculogenic mimicry and metastatic potential of human triple negative breast cancer cells. Biochem Biophys Res Commun. 2017; 494:256–62. https://doi.org/10.1016/j.bbrc.2017.10.043 [PubMed]
- 21. Ci H, Xu Z, Xu J, Wang Y, Wu S. Expressions of KAI1 and e-cadherin in nonsmall cell lung cancer and their correlation with vasculogenic mimicry. Medicine (Baltimore). 2018; 97:e12293. https://doi.org/10.1097/MD.0000000000012293 [PubMed]
- 22. Guo Q, Yuan Y, Jin Z, Xu T, Gao Y, Wei H, Li C, Hou W, Hua B. Association between tumor vasculogenic mimicry and the poor prognosis of gastric cancer in China: an updated systematic review and meta-analysis. Biomed Res Int. 2016; 2016:2408645. https://doi.org/10.1155/2016/2408645 [PubMed]
- 23. Cao Z, Bao M, Miele L, Sarkar FH, Wang Z, Zhou Q. Tumour vasculogenic mimicry is associated with poor prognosis of human cancer patients: a systemic review and meta-analysis. Eur J Cancer. 2013; 49:3914–23. https://doi.org/10.1016/j.ejca.2013.07.148 [PubMed]
- 24. Wöll E, Thaler J, Keil F, Gruenberger B, Hejna M, Eisterer W, Fridrik MA, Ulmer H, Trommet V, Huemer F, Weiss L, Greil R. Oxaliplatin/irinotecan/bevacizumab followed by docetaxel/bevacizumab in inoperable locally advanced or metastatic gastric cancer patients – AGMT_GASTRIC-3. Anticancer Res. 2017; 37:5553–58. https://doi.org/10.21873/anticanres.11987 [PubMed]
- 25. Han K, Claret L, Piao Y, Hegde P, Joshi A, Powell JR, Jin J, Bruno R. Simulations to Predict Clinical Trial Outcome of Bevacizumab Plus Chemotherapy vs. Chemotherapy Alone in Patients With First-Line Gastric Cancer and Elevated Plasma VEGF-A. CPT Pharmacometrics Syst Pharmacol. 2016; 5:352–8. https://doi.org/10.1002/psp4.12064 [PubMed]
- 26. Han K, Jin J, Maia M, Lowe J, Sersch MA, Allison DE. Lower exposure and faster clearance of bevacizumab in gastric cancer and the impact of patient variables: analysis of individual data from AVAGAST phase III trial. AAPS J. 2014; 16:1056–63. https://doi.org/10.1208/s12248-014-9631-6 [PubMed]
- 27. Qiao L, Liang N, Zhang J, Xie J, Liu F, Xu D, Yu X, Tian Y. Advanced research on vasculogenic mimicry in cancer. J Cell Mol Med. 2015; 19:315–26. https://doi.org/10.1111/jcmm.12496 [PubMed]
- 28. Wei Y, Zhang F, Zhang T, Zhang Y, Chen H, Wang F, Li Y. LDLRAD2 overexpression predicts poor prognosis and promotes metastasis by activating Wnt/β-catenin/EMT signaling cascade in gastric cancer. Aging (Albany NY). 2019; 11:8951–68. https://doi.org/10.18632/aging.102359 [PubMed]
- 29. Okada T, Sinha S, Esposito I, Schiavon G, López-Lago MA, Su W, Pratilas CA, Abele C, Hernandez JM, Ohara M, Okada M, Viale A, Heguy A, et al. The rho GTPase Rnd1 suppresses mammary tumorigenesis and EMT by restraining ras-MAPK signalling. Nat Cell Biol. 2015; 17:81–94. https://doi.org/10.1038/ncb3082 [PubMed]
- 30. Wu J, Long Z, Cai H, Yu S, Liu X. Homeobox B7 accelerates the cancer progression of gastric carcinoma cells by promoting epithelial-mesenchymal transition (EMT) and activating Src-FAK pathway. Onco Targets Ther. 2019; 12:3743–51. https://doi.org/10.2147/OTT.S198115 [PubMed]
- 31. Li SL, Chen X, Wu T, Zhang XW, Li H, Zhang Y, Ji ZZ. Knockdown of TMPRSS3 inhibits gastric cancer cell proliferation, invasion and EMT via regulation of the ERK1/2 and PI3K/Akt pathways. Biomed Pharmacother. 2018; 107:841–48. https://doi.org/10.1016/j.biopha.2018.08.023 [PubMed]
- 32. Yoo YA, Kang MH, Lee HJ, Kim BH, Park JK, Kim HK, Kim JS, Oh SC. Sonic hedgehog pathway promotes metastasis and lymphangiogenesis via activation of Akt, EMT, and MMP-9 pathway in gastric cancer. Cancer Res. 2011; 71:7061–70. https://doi.org/10.1158/0008-5472.CAN-11-1338 [PubMed]
- 33. Nüsslein-Volhard C, Wieschaus E. Mutations affecting segment number and polarity in drosophila. Nature. 1980; 287:795–801. https://doi.org/10.1038/287795a0 [PubMed]
- 34. Teperino R, Aberger F, Esterbauer H, Riobo N, Pospisilik JA. Canonical and non-canonical hedgehog signalling and the control of metabolism. Semin Cell Dev Biol. 2014; 33:81–92. https://doi.org/10.1016/j.semcdb.2014.05.007 [PubMed]
- 35. Hu Q, Hou YC, Huang J, Fang JY, Xiong H. Itraconazole induces apoptosis and cell cycle arrest via inhibiting hedgehog signaling in gastric cancer cells. J Exp Clin Cancer Res. 2017; 36:50. https://doi.org/10.1186/s13046-017-0526-0 [PubMed]
- 36. Ma S, Liu D, Tan W, Du B, Liu W, Li W, Jiao Y. Interference with SMO increases chemotherapy drug sensitivity of A2780/DDP cells by inhibiting the hh/gli signaling pathway. J Cell Biochem. 2020; 121:3256–65. https://doi.org/10.1002/jcb.29593 [PubMed]
- 37. Masetti R, Bertuccio SN, Astolfi A, Chiarini F, Lonetti A, Indio V, De Luca M, Bandini J, Serravalle S, Franzoni M, Pigazzi M, Martelli AM, Basso G, et al. Hh/Gli antagonist in acute myeloid leukemia with CBFA2T3-GLIS2 fusion gene. J Hematol Oncol. 2017; 10:26. https://doi.org/10.1186/s13045-017-0396-0 [PubMed]
- 38. Gialmanidis IP, Bravou V, Amanetopoulou SG, Varakis J, Kourea H, Papadaki H. Overexpression of hedgehog pathway molecules and FOXM1 in non-small cell lung carcinomas. Lung Cancer. 2009; 66:64–74. https://doi.org/10.1016/j.lungcan.2009.01.007 [PubMed]
- 39. Basset-Seguin N, Sharpe HJ, de Sauvage FJ. Efficacy of hedgehog pathway inhibitors in basal cell carcinoma. Mol Cancer Ther. 2015; 14:633–41. https://doi.org/10.1158/1535-7163.MCT-14-0703 [PubMed]
- 40. Atwood SX, Chang AL, Oro AE. Hedgehog pathway inhibition and the race against tumor evolution. J Cell Biol. 2012; 199:193–97. https://doi.org/10.1083/jcb.201207140 [PubMed]
- 41. Brinãs RP, Sundgren A, Sahoo P, Morey S, Rittenhouse-Olson K, Wilding GE, Deng W, Barchi JJ
Jr . Design and synthesis of multifunctional gold nanoparticles bearing tumor-associated glycopeptide antigens as potential cancer vaccines. Bioconjug Chem. 2012; 23:1513–23. https://doi.org/10.1021/bc200606s [PubMed] - 42. Rabinovich GA. Galectin-1 as a potential cancer target. Br J Cancer. 2005; 92:1188–92. https://doi.org/10.1038/sj.bjc.6602493 [PubMed]
- 43. Thiemann S, Baum LG. Galectins and immune responses-just how do they do those things they do? Annu Rev Immunol. 2016; 34:243–64. https://doi.org/10.1146/annurev-immunol-041015-055402 [PubMed]
- 44. Barondes SH, Castronovo V, Cooper DN, Cummings RD, Drickamer K, Feizi T, Gitt MA, Hirabayashi J, Hughes C, Kasai K. Galectins: a family of animal beta-galactoside-binding lectins. Cell. 1994; 76:597–98. https://doi.org/10.1016/0092-8674(94)90498-7 [PubMed]
- 45. Liu X, Wang JH, Li S, Li LL, Huang M, Zhang YH, Liu Y, Yang YT, Ding R, Ke YQ. Histone deacetylase 3 expression correlates with vasculogenic mimicry through the phosphoinositide3-kinase / ERK-MMP-laminin5γ2 signaling pathway. Cancer Sci. 2015; 106:857–66. https://doi.org/10.1111/cas.12684 [PubMed]