


Introduction
Hepatocellular carcinoma (HCC) is a highly aggressive malignant neoplasm and is the fifth leading cause of cancer-related death worldwide [1]. Hepatitis, liver cirrhosis and tumor occurrence are common indications during the development of HCC [2]. Therapeutic strategies used to treat HCC entail both interdisciplinary and multidisciplinary approaches, including surgical resection, liver transplantation, radiofrequency ablation, chemotherapy, targeted medicine and immunological therapy [3]. Nevertheless, the prognosis for HCC remains very poor, with a five-year survival rate that is below 12% [4]. The molecular mechanisms underlying HCC development and progression remain unclear. Consequently, there is an urgent need to identify specific biomarkers of HCC that will enable diagnosis early enough to improve prognosis.
Ubiquitin is covalently attached to substrate proteins through a cascade involving three enzymes: ubiquitin-activating enzyme (E1), ubiquitin-conjugating enzyme (E2) and ubiquitin-ligating enzyme (E3) [5]. The human genome encodes nearly 600 E3 ligases, including seven Cullin proteins (CUL1, CUL2, CUL3, CUL4A, CUL4B, CUL5, CUL7), which mediate nucleation events leading to the formation of a multi-subunit ubiquitin ligase [6]. DDB1 and CUL4 associated factor 15 (DCAF15) is a core component of the Cullin-RING E3 ligases-DCAF15 E3 ubiquitin ligase complex. This complex is composed of CUL4, DCAF15, DDB1 and DDA1 [7]. The Cullin 4 RING ligase (CRL4) contains two homogenous scaffolds, CUL4A and CUL4B, which bind DDB1 and the catalytic subunit RING-finger protein through its N-terminus and C-terminus, respectively [8]. The majority of CUL4A resides in the cytoplasm and regulates substrate ubiquitination; however, low levels of CUL4A are found in the nucleus, where it targets the nuclear proteins HOXA9 and p27 [9, 10]. DDB1 acts as a bridging factor between the Cullin scaffold and its substrate recognition subunit [11]. Earlier reports demonstrated that DDA1 directly binds to amino acids 390-460 of DCAF15 [12] and that DCAF proteins prompt E3 ubiquitin ligase complexes to ubiquitinate and target for degrading key substrates, including ZFP9, IKZF1, IKZF3 and RBM39 [7, 13, 14]. In addition, three aryl sulfonamides, E7820, indisulam and tasisulam, have been shown to induce degradation of RBM39 through recruitment of the CUL4-DDB1-DDA1-DCAF15 E3 ligase complex [15].
ZEB1 is a transcriptional regulator of epithelial-mesenchymal transition (EMT) [16]. To better understand the mechanism by which ZEB1 is degraded through the ubiquitin proteasome pathway, in the present study we surveyed a protein-protein interaction database to determine whether ZEB1 interacts with DCAF family proteins and assess its impact on the proliferation and invasiveness of HCC cells and the EMT process. Our findings provide a model for understanding the role of a DCAF15-ZEB1-EMT axis during the development of HCC.
Results
DCAF15 forms a complex with ZEB1 in cells
To identify the molecular partners interacting with ZEB1, we surveyed a large-scale protein-protein interaction database (https://thebiogrid.org/124705/summary/homo-sapiens/dcaf15.html) and noted that ZEB1 (red frame) is a potential interactor of DCAF15(Figure 1). We then co-expressed Flag-DCAF15 and Myc-ZEB1 in 293T cells, after which the cells were harvested for co-immunoprecipitation (Co-IP) assays. The results indicated that Myc-ZEB1 was immunoprecipitated by Flag-DCAF15 (Figure 2A). Similarly, reciprocal Co-IP assays performed after co-transfecting cells with Flag-ZEB1 and Myc-DCAF15 showed that Myc-DCAF15 was immunoprecipitated by Flag-ZEB1 (Figure 2B), indicating exogenous interaction between these two proteins. We also observed that endogenous DCAF15 was efficiently immunoprecipitated by ZEB1 (Figure 2C) and that endogenous ZEB1 was efficiently immunoprecipitated by DCAF15 (Figure 2D), suggesting there is also endogenous interaction between ZEB1 and DCAF15.
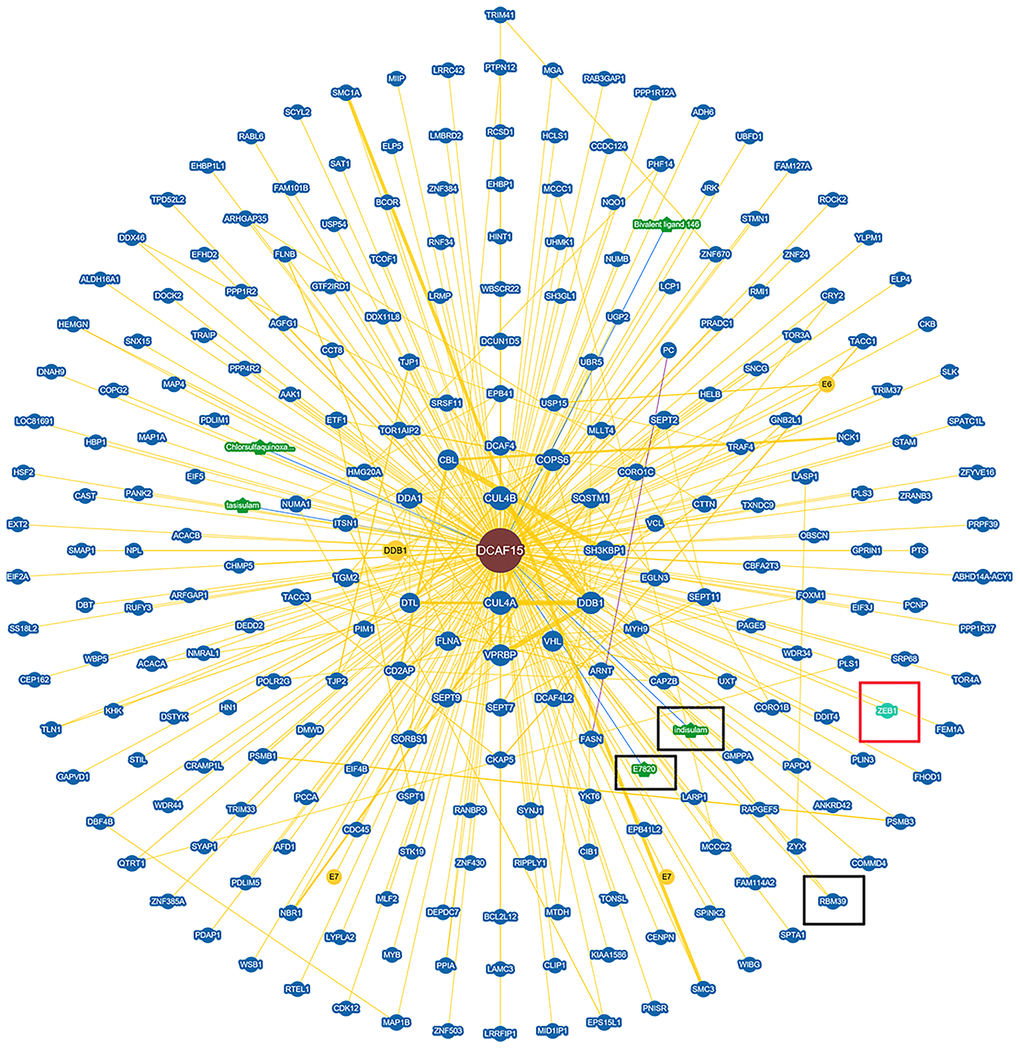
Figure 1. Protein network diagram shows potential interaction of DCAF15. Black frame indicates the interactors of DCAF15 reported. Red frame indicates ZEB1 is a potential interactor of DCAF15.
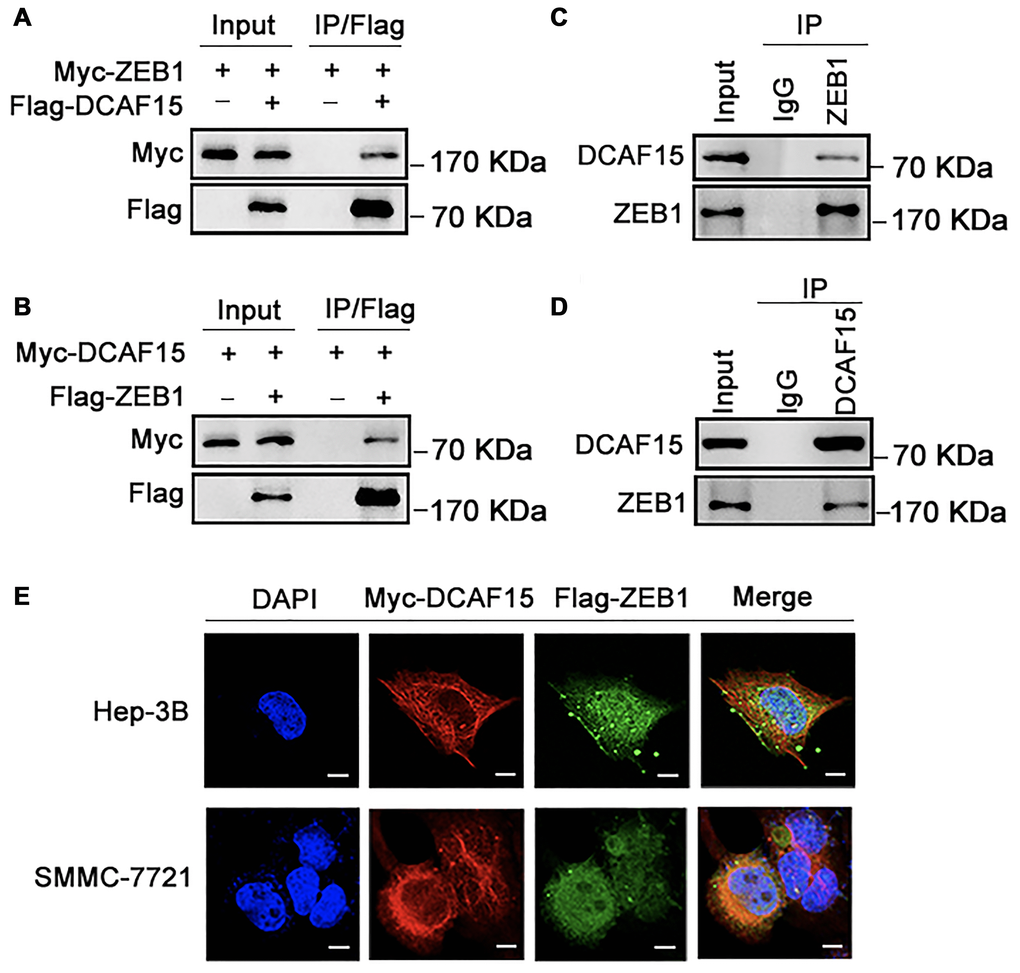
Figure 2. DCAF15 binds with ZEB1 protein. (A–B) Ectopically expressed DCAF15 and ZEB1 can bind with each other. (A) Flag-DCAF15 and Myc-ZEB1 were co-expressed in HEK293T cells, and immunoprecipitated with FLAG-M2 agarose beads. (B) Similar Co-IP assay was performed between Flag-ZEB1 and Myc-DCAF15. (C–D) Endogenous interaction between DCAF15 and ZEB1. (C) SMMC-7721 cells were treated with 10μM MG132 for 6h. Cell lysates were precipitated using anti-ZEB1 antibody or with IgG (mock IP) and coprecipitated DCAF15 was detected by western blotting. (D) SMMC-7721 cells were treated with 10 μM MG132 for 6h. Cell lysates were precipitated using anti-DCAF15 antibody or with IgG (mock IP) and coprecipitated ZEB1 was detected by western blotting. (E) Flag-DCAF15 and Myc-ZEB1 were co-expressed in Hep3B and SMMC-7721 cells respectively and visualized by fluorescence microscopy. Scale bars, 30 μm.
To further investigate the intracellular interaction between ZEB1 and DCAF15, we examined their subcellular localization in two HCC cell lines (Hep-3B and SMMC-7721). After transfecting the cells with Flag-ZEB1 and Myc-DCAF15, they were immunofluorescence-stained with anti-Flag or anti-Myc antibodies. Upon visualization under a microscope, we observed that the exogenous ZEB1 and DCAF15 colocalized in the cytoplasm (Figure 2E). Taken together, these results strongly suggest that DCAF15 forms a complex with ZEB1 within the cytoplasm of HCC cells.
DCAF15 ubiquitinates and degrades ZEB1 protein
We next investigated whether DCAF15 promotes the ubiquitination and subsequent degradation of ZEB1 protein. Consistent with that idea, levels of Flag-ZEB1 were dose-dependently decreased by expression of Myc-DCAF15, and that effect was absent when cells were treated with a proteasomal inhibitor (MG132, Bortezomib or chloroquine). That all three inhibitors tested rescued ZEB1 from DCAF15-mediated degradation indicates that DCAF15 downregulates ZEB1 levels via the proteasomal degradation pathway (Figure 3A). To identify which ZEB1 domain interacts with DCAF15, we generated five ZEB1 deletion mutants: ZEB1-Δ1 (amino acids 1-340), ZEB1-Δ2 (amino acids 1-781), ZEB1-Δ3 (amino acids 341-781), ZEB1-Δ4 (amino acids 341-1,124) and ZEB1-Δ5 (amino acids 782-1124) [17]. Subsequent Co-IP experiments revealed that the N-terminal zinc finger domain mediated interaction between ZEB1 and DCAF15, but not the Smad-binding domain, homeodomain, CtBP interaction domain, or C-terminal zinc finger domain (Figure 3B). In addition, knocking down endogenous DCAF15 using two targeted siRNAs increased endogenous ZEB1 levels (Figure 3C) and markedly prolonged the half-life of endogenous ZEB1 in SMMC-7721 cells (Figure 3D and 3E).
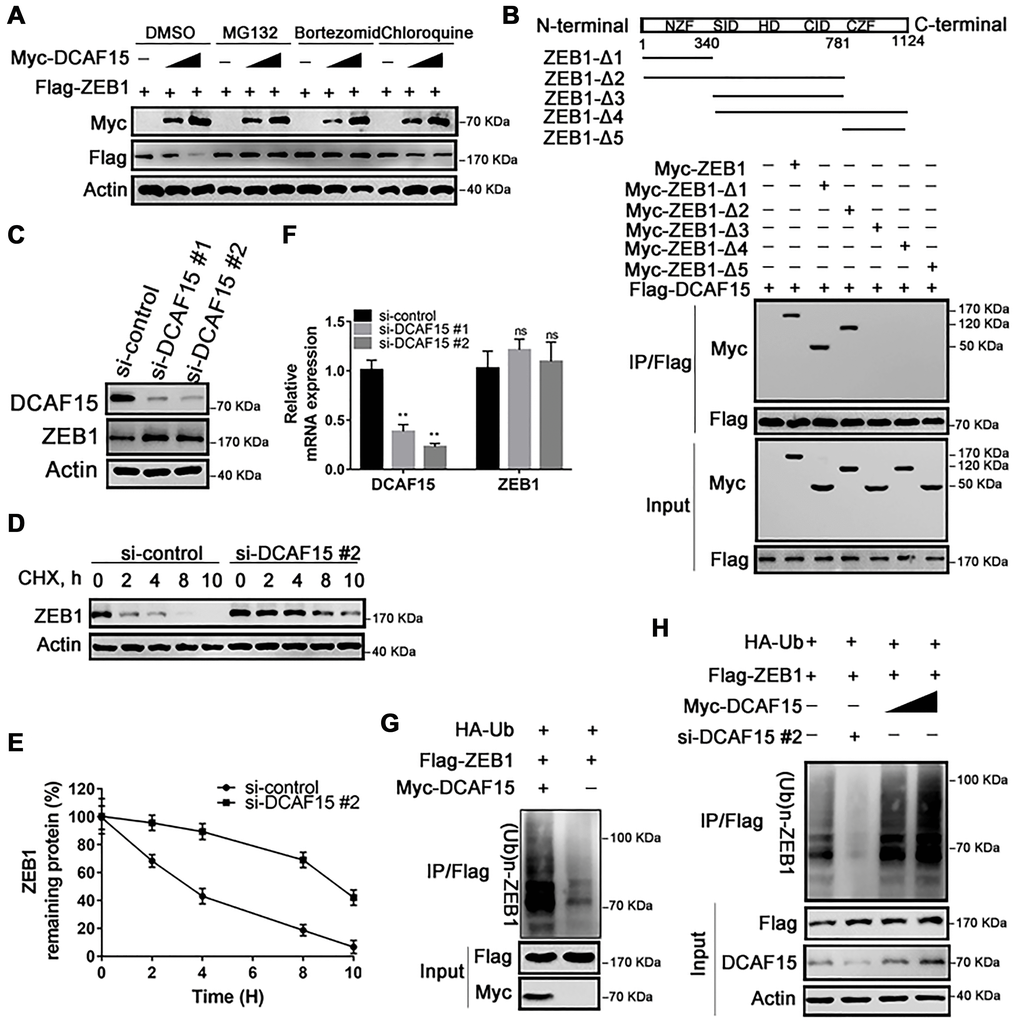
Figure 3. DCAF15 ubiquitinates and degrades ZEB1 protein. (A) DCAF15 regulates protein level of ZEB1 through the proteasome pathway. HEK293T cells were co-transfected with Flag-ZEB1 and increasing amounts of Myc-DCAF15. After 24h, cells were treated with DMSO, MG132, bortezomib or chloroquine respectively and detected by western blot. (B) HEK293T cells were transfected with Flag-DCAF15 and Myc-full-length or truncated ZEB1. After 24 h, cell lysates were immunoprecipitated using FLAG-M2 agarose beads. Immune complexes were analyzed by immunoblotting with the indicated antibodies (lower panel). Schematic diagram illustrating ZEB1 deletion mutants (upper panel). (C) SMMC-7721 cells were transfected with the control or two independent DCAF15 siRNAs, respectively. Cell lysates were analyzed via immunoblotting with the indicated antibodies. (D) SMMC-7721 cells were transfected with the control or DCAF15 siRNAs. After 24 h, cells were treated with cycloheximide (CHX) for indicated time-periods. Cell lysates were analyzed via immunoblotting with the indicated antibodies. (E) The relative intensities of ZEB1 protein were first normalized to the intensities of actin and then normalized to the value of the 0 h point. (F) qPCR validation of relative DCAF15 and ZEB1 mRNA levels in DCAF15 control and knockdown cells. GAPDH was used for normalization. (G) HEK293T cells were co-transfected with Flag-ZEB1, Myc-DCAF15 and HA-Ub. After 24 h, cells were treated with 10μM MG132 for 6 h. Cell lysates were immunoprecipitated using FLAG-M2 agarose beads and analyzed by immunoblotting with the indicated antibodies. (H) DCAF15 promotes ZEB1 ubiquitination. HEK293T cells were co-transfected with Flag-ZEB1, HA-Ub, si-DCAF15 #2 and increasing amounts of Myc-DCAF15. After 24h, cells were treated with MG132. The ZEB1 protein was immunoprecipitated using FLAG-M2 agarose beads. The ubiquitinated ZEB1 was analyzed by Western blotting.
To address the possibility that the elevated ZEB1 expression was mediated at the transcriptional level, we measured levels of DCAF15 and ZEB1 mRNA in SMMC-7721 cells after transiently treating them with DCAF15 siRNAs. We found that levels of DCAF15 mRNA were significantly decreased, while levels of ZEB1 mRNA were little changed from control, indicating that the degradative effect of DCAF15 on ZEB1 is not mediated at the transcriptional level (Figure 3F). Instead, co-expression of HA-ubiquitin, Flag-ZEB1 and Myc-DCAF15 in HEK293T cells revealed that ZEB1 was robustly and dose-dependently poly-ubiquitinated (Figure 3G and 3H). These results suggest that DCAF15 triggers the ubiquitin-dependent proteasomal degradation pathway through recognition of the N-terminal zinc finger domain of ZEB1 protein.
Ubiquitin is conjugated to its substrates by Cullin RING ligases (CRLs), which are multi-subunit ubiquitin ligases. CRLs are modular complexes that contain a common catalytic core but assemble with a diverse set of receptors that recruit specific substrates to the CRL’s catalytic complex [6]. Within CRL4 (CUL4A and CUL4B), DDB1 and DDA1 are adaptors, while DCAF15 is a substrate-specific receptor [7]. We first tested whether CUL4A binds ZEB1 within cells. As shown in Figure 4A, ZEB1 was not immunoprecipitated by Flag-CUL4A, indicating no binding between ZEB1 and CUL4A (Figure 4A). Likewise, exogenous CUL4B did not bind ZEB1, nor did DDA1 or DDB1 (Figure 4B–4D). We only detected an interaction between endogenous ZEB1 and exogenous Flag-DCAF15 (Figure 2D). Moreover, when we knocked down endogenous CUL1, CUL2, CUL3, CUL4A, CUL4B or CUL5 using corresponding siRNAs in SMMC-7721 cells and then measured the levels of ZEB1 and Cullin family members, we found that when cells were transfected with siCUL4A, ZEB1 levels were significantly higher than control (Figure 4E). By contrast, transfection of siRNAs targeting other Cullin family proteins had no effect on ZEB1 levels. Thus, only CUL4A appears to affect the stability of ZEB1 protein.
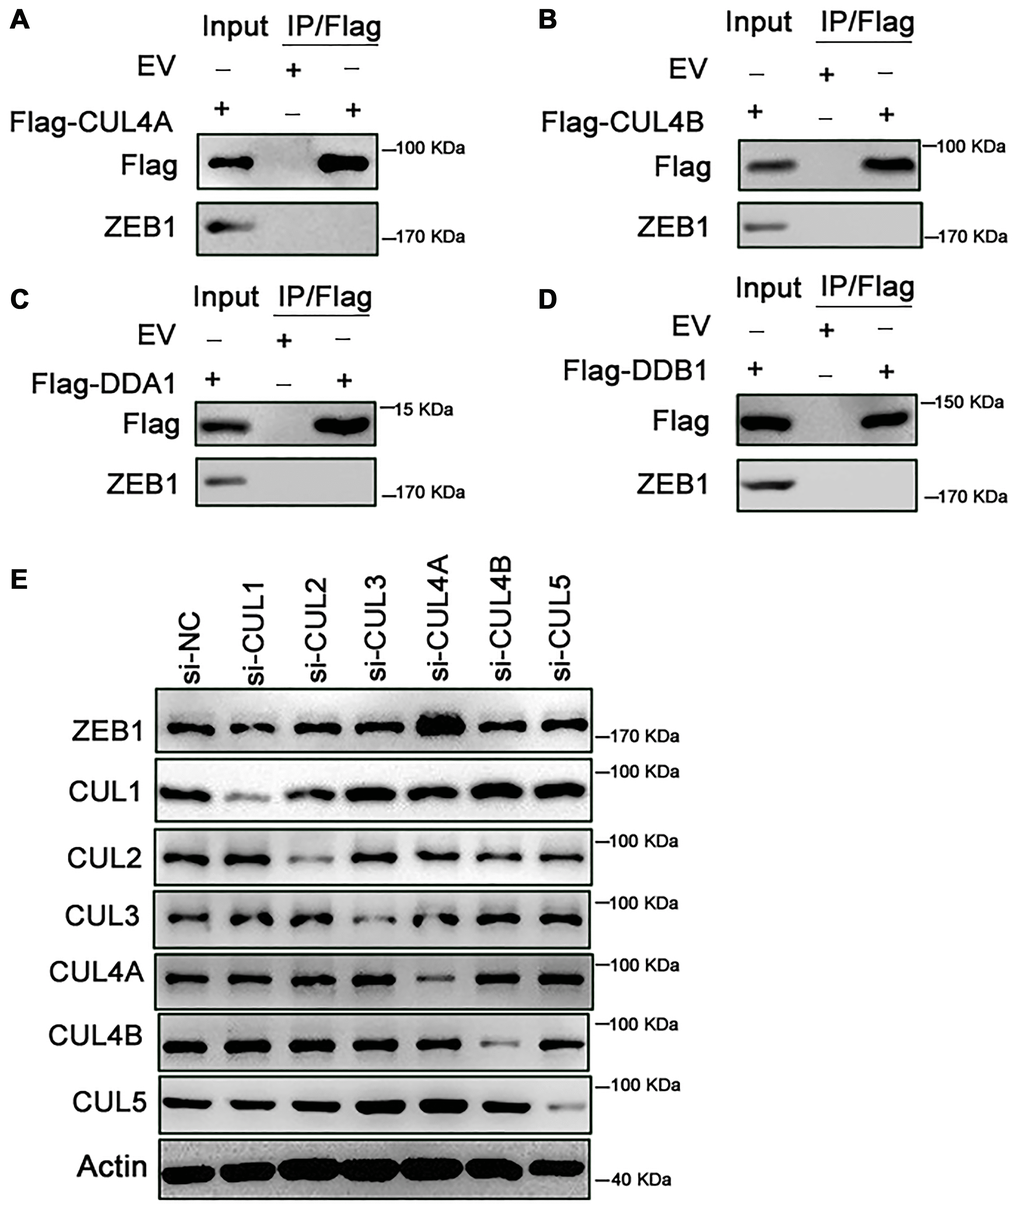
Figure 4. Knockdown of CUL4A promotes the stability of ZEB1. (A–D) HEK293T cells were transfected with Flag-CUL4A, Flag-CUL4B, Flag-DDA1 and Flag-DDB1 respectively. After 24h, cells were treated with 10 μM MG132 for 6h. Cell lysates were immunoprecipitated using FLAG-M2 agarose beads and analyzed by immunoblotting with the indicated antibodies. (A) Ectopically expressed CUL4A didn’t bind with endogenous ZEB1. (B) Ectopically expressed CUL4B didn’t bind with endogenous ZEB1. (C) Ectopically expressed DDA1 didn’t bind with endogenous ZEB1. (D) Ectopically expressed DDB1 didn’t bind with endogenous ZEB1. (E) SMMC-7721 cells were transfected with the control or si-CUL1, si-CUL2, si-CUL3, si-CUL4B and si-CUL5 respectively. Cell lysates were analyzed by immunoblotting with the indicated antibodies. Expression of si-CUL1, si-CUL2, si-CUL3, si-CUL4B and si-CUL5 had no effect on ZEB1 degradation, in contrast, si-CUL4A promoted the ZEB1 protein expression.
DCAF15 inhibits cell proliferation, migration and invasion by HCC cells
To explore the biological function of the DCAF15-ZEB1 axis in HCC, siRNAs targeting DCAF15 and ZEB1 were transiently transfected into SMMC-7721 cells (Figure 5A), after which CCK8 and colony formation assays were performed. The results showed that cell proliferation was inhibited by ZEB1 knockdown but promoted by DCAF15 knockdown. Moreover, the enhanced cell proliferation caused by DCAF15 knockdown could be reversed by ZEB1 co-knockdown (Figure 5B–5C). This suggests DCAF15 inhibits HCC cell proliferation.
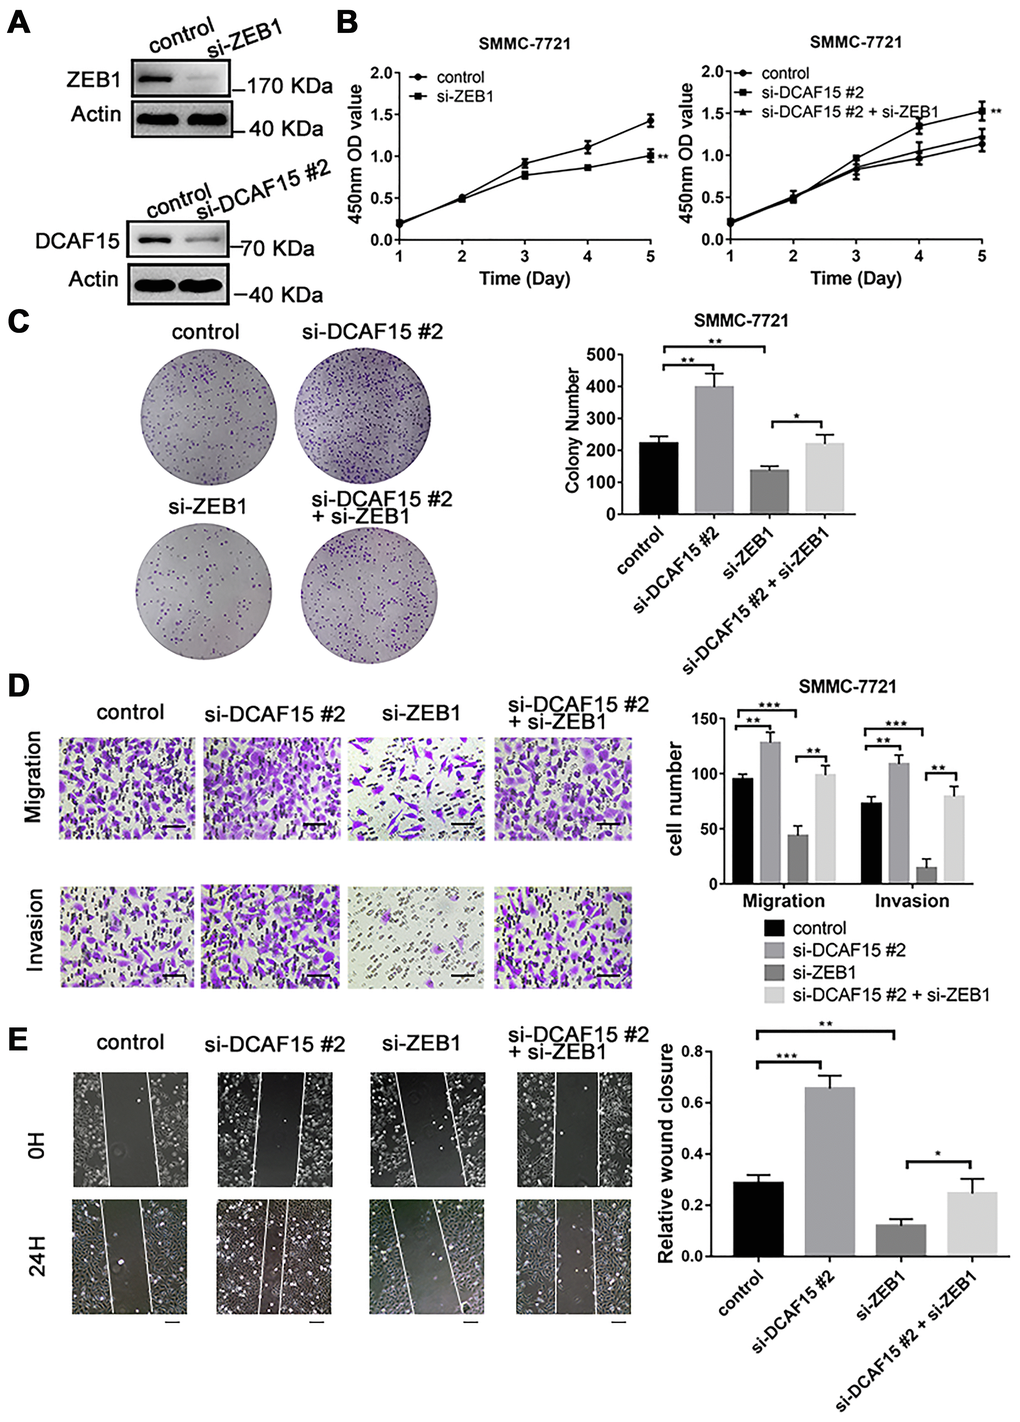
Figure 5. DCAF15 inhibits proliferation, migration, and invasion of HCC cells. (A) DCAF15 and ZEB1 was knocked down in SMMC-7721 cells by expressing siRNAs. Immunoblotting analyses were performed with the indicated antibodies. (B) CCK-8 assay was performed for cell proliferation of control, ZEB1-knockdown, DCAF15-knockdown and ZEB1-& DCAF15-knockdown SMMC-7721 cells. (C) The cells of (B) were plated and cultured on 6-well plates. Colony numbers were quantified. (D) The migration and invasion ability of the cells of (B) in were examined using the Transwell migration and invasion assay respectively. Cell numbers were quantified. Data are presented as mean ± SD (n = 3). **P < 0.01, ***P < 0.001. Scale bars, 50 μm. (E) The cells of (B) were plated and cultured on 6-well plates. The cell layer was scratched with a 10 μl pipette tip. For each sample, at least three scratched fields were photographed immediately (0 h) or 24 h after scratching. Photographs of representative images were taken at ×100 magnification.
We next performed transwell and wound healing assays to assess the impact of DCAF15 and ZEB1 on cell migration and invasion. We found that ZEB1 knockdown suppressed both migration and invasion by HCC cells, whereas DCAF15 knockdown had the opposite effect. Moreover, the enhanced migration and invasion caused by DCAF15 knockdown was reversed by ZEB1 co-knockdown (Figure 5D–5E), again demonstrating the functional interconnection of these two proteins.
DCAF15 inhibits EMT in HCC cells
Numerous studies have reported that EMT is necessary for cancer metastasis [18, 19]. To become highly mobile, epithelial cells are known to lose their polarity, which helps them acquire migratory and invasive capabilities. Upon DCAF15 overexpression, E-cadherin was upregulated while several mesenchymal markers, including N-cadherin, β-catenin, slug and vimentin, were all downregulated (Figure 6A–6B, 6E and 6G). Conversely, E-cadherin was downregulated when DCAF15 expression was suppressed, and the mesenchymal signals were correspondingly upregulated (Figure 6C–6D, 6F and 6H).
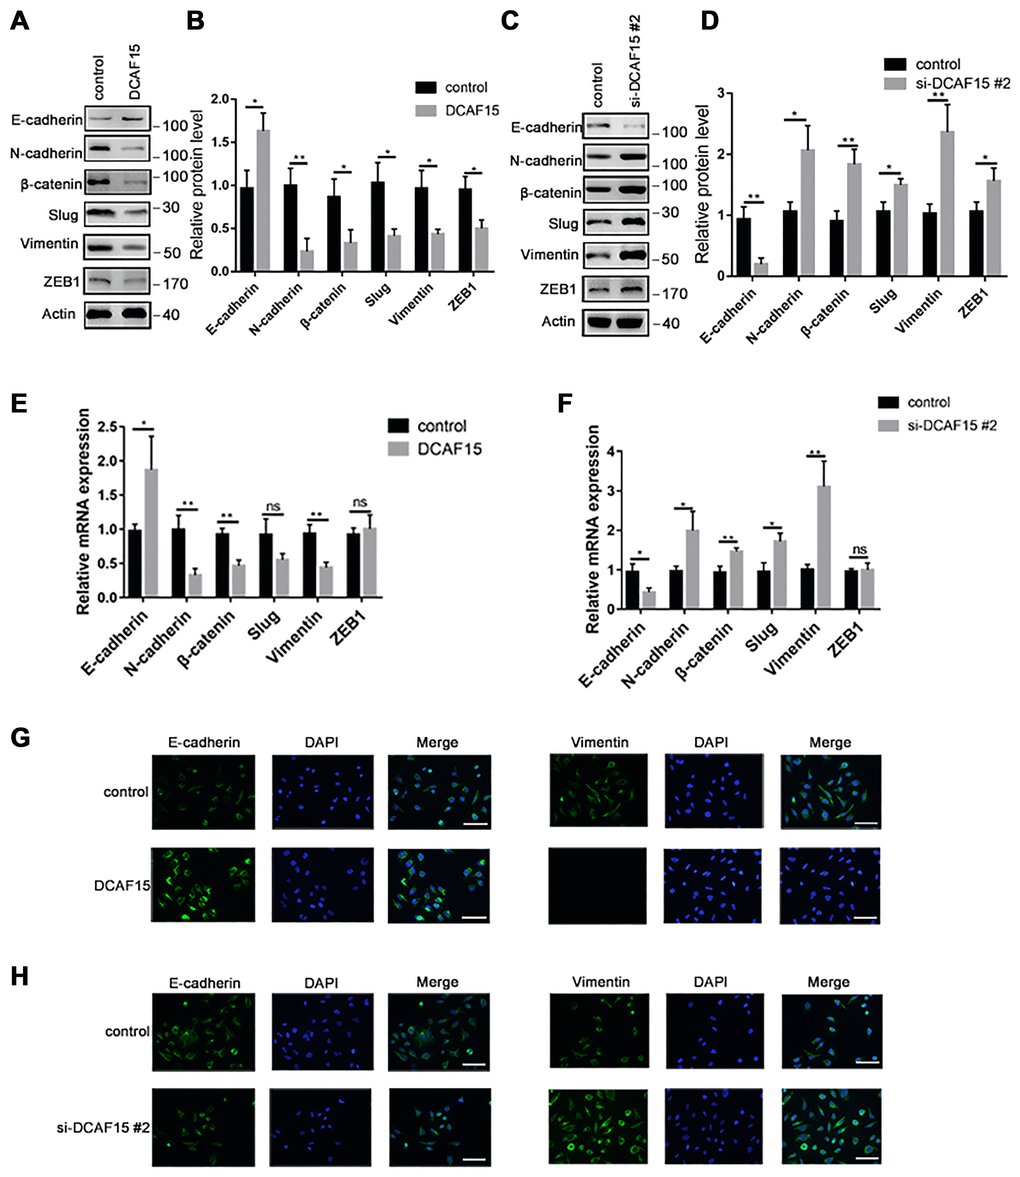
Figure 6. DCAF15 inhibits epithelial-mesenchymal transition (EMT) of HCC cells. (A–B) Western blot analysis showed the protein level of EMT markers after transfecting with control or DCAF15 overexpression plasmids in HCC cells. (C–D) Western blot analysis showed the protein level of EMT markers after transfecting with control or DCAF15 siRNA in HCC cells. (E) qRCR analysis showed relative mRNA level of EMT markers after transfecting with control or DCAF15 overexpression plasmids in HCC cells. (F) qRCR analysis showed relative mRNA level of EMT markers after transfecting with control or DCAF15 siRNA in HCC cells. (G) Protein level of E-cadherin and vimentin after transfecting with control or DCAF15 overexpression plasmids in HCC cells was visualized by fluorescence microscopy. Scale bars, 100 μm. (H) Protein level of E-cadherin and vimentin after transfecting with control or DCAF15 siRNA in HCC cells was visualized by fluorescence microscopy. Scale bars, 100 μm.
DCAF15 and ZEB1 are negatively correlated in HCC
Finally, we assessed DCAF15 and ZEB1 expression in tissue specimens from 40 HCC patients. As shown in Figure 7A–7B, DCAF15 levels were lower in HCC than in paired normal liver tissues. In addition, DCAF15 and ZEB1 levels were negatively correlated in HCC tissues (r = −0.46, p = 0.006) (Figure 7C and 7D). We also used The Cancer Genome Atlas (TCGA) database to analyze the clinical prognostic significance of DCAF15 or ZEB1 mRNA expression. Kaplan-Meier analyses revealed that overall survival (OS) among HCC patients exhibiting low DCAF15 mRNA expression was poorer than among those exhibiting high DCAF15 mRNA expression, and that low DCAF15 or high ZEB1 mRNA expression was predictive of unfavorable OS in HCC patients (Supplementary Figure 1).
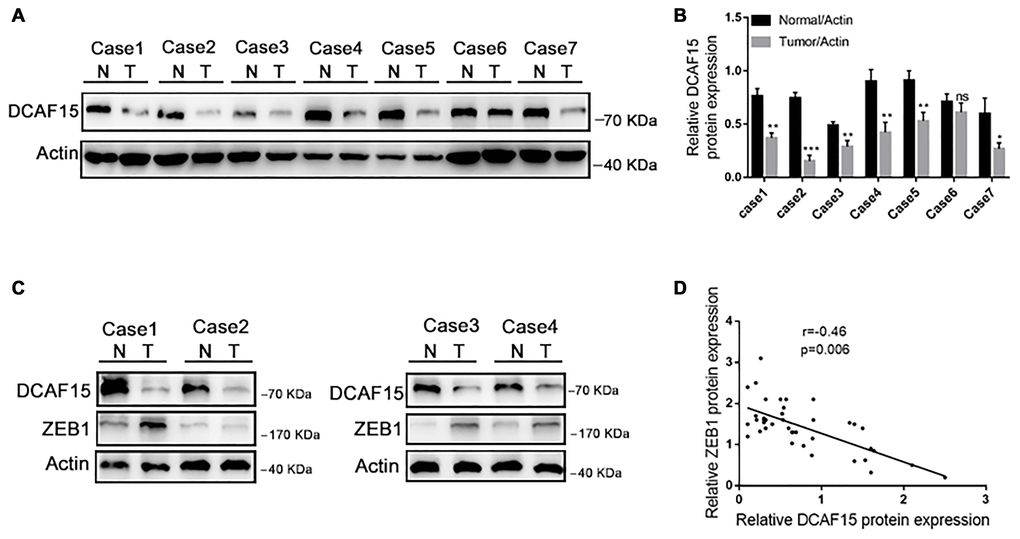
Figure 7. DCAF15 and ZEB1 protein levels negatively correlate in HCC patient specimens. (A–B) In random 7 HCC patient specimens. protein level of DCAF15 in tumor tissues is lower than in normal tissues. (C) Representative western blotting figures show protein expression of DCAF15 and ZEB1 in 40 HCC patient specimens. (D) Correlation analysis of the expression levels of DCAF15 and ZEB1 protein in 40 HCC patient specimens (r = −0.46, p = 0.006).
Discussion
In this study, we showed that the DCAF15-CUL4 E3 ligase complex functions as a tumor suppressor that promotes ZEB1 ubiquitination and degradation, which suppresses malignant phenotypes such as cell proliferation, migration and invasion as well as EMT in HCC cells (Figure 8).
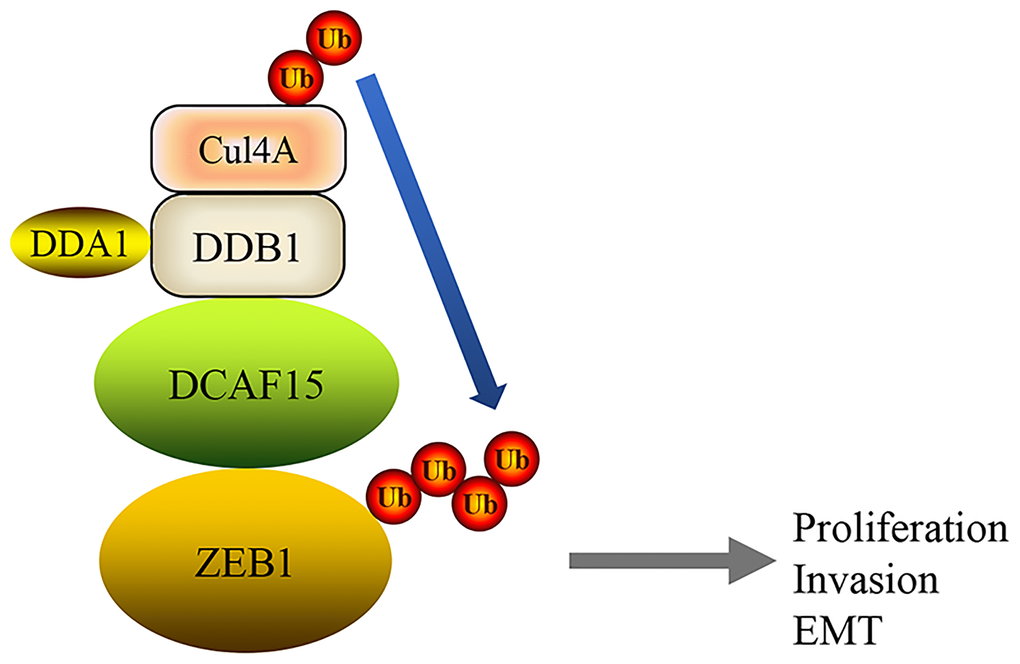
Figure 8. A mechanism of DCAF15 function as a tumor suppressor through ubiquitination and degradation of ZEB1 leads to proliferation, invasion and EMT of HCC.
ZEB1 is a key transcriptional regulator in EMT, which consists of two zinc finger clusters and a centrally-located homeodomain capable of DNA binding [20, 21]. Previous studies have shown that ZEB1 is highly expressed in HCC and that its overexpression promotes tumor cell migration, invasion and metastasis through EMT [22–26]. CUL4A, a member of the Cullin family and a component of the E3 ubiquitin ligase complex, is necessary for the ubiquitination and degradation of proteins [27]. Numerous studies have elaborated on Cullin family proteins and their associated CRLs E3 ligases [28–31]. Among them, CUL4 related E3 ubiquitin ligases comprise a Cullin 4 scaffold and the triple β-propeller DDB1 adaptor. However, few substrate receptors have been identified [32]. DCAF15 was first detected as a vital ubiquitin ligase contributing to the cytotoxicity of indisulam (a carbonic anhydrase inhibitor) -induced RBM39 degradation [7, 15]. A subsequent kinetic analysis found that aryl sulfonamide and RBM39 bind to DCAF15 in a synergistic manner [33], and it was later demonstrated that E7070, an aryl sulfonamide drug, mediates ubiquitination and proteasomal degradation of PRPF39 by recruiting PRPF39 to the CUL4-DCAF15 E3 ubiquitin ligase [34]. A variety of substrate receptors have been described as targets of DCAF15; however, the biological and functional significance of this ubiquitination event requires further elucidation. To our knowledge, this is the first report revealing the critical role of DCAF15-ZEB1 binding in HCC. Our findings suggest DCAF15 serves as a tumor suppressor gene in HCC and is negatively related to ZEB1 protein. These results provide a mechanistic explanation for the clinical observation that HCC patients have high levels of ZEB1 in their tissues.
In summary, our study demonstrates that ZEB1 is recognized by DCAF15 as a substrate in human HCC cells and offers new insight into the specific functions of DCAF15 in HCC and a unique DCAF15-ZEB1 axis in the E3 ubiquitin ligase system.
Materials and Methods
Cell culture
Human HCC cell lines (SMMC-7721 and Hep-3B) and HEK293T cells were obtained from the Type Culture Collection of the Chinese Academy of Sciences (Shanghai, China). They were cultured in high-glucose Dulbecco’s modified Eagle’s medium (DMEM) (Gibco) supplemented with 10% fetal bovine serum (FBS) (Gibco), 100 mg/ml penicillin and streptomycin (Gibco) at 37°C in a humidified atmosphere containing 5% CO2.
Plasmids Constructs
The DCAF15 and ZEB1 cDNAs were purchased from Genechem and subcloned into pCMV-Flag or pCMV-Myc expression vectors, respectively. ZEB1 deletion mutants were generated by PCR, and subcloned into pCMV-Myc expression vectors. All the constructs were confirmed by DNA sequencing.
RNA Interference
Human DCAF15 and Culling family siRNAs were purchased from GenePharma (Shanghai, China). siRNA transfection of cells was performed following the manufacturer’s instructions. The siRNA oligos sequences information is provided in Supplementary Table 1. The cells were transiently transfected with siRNAs using Lipofectamine 2000 (Invitrogen) according to the manufacturer’s instructions.
Western blotting analysis
Cells were washed three times with 1× phosphate buffer saline (PBS) for 5 min, and then lysed with ice-cold radioimmunoprecipitation buffer containing a protease inhibitor cocktail (Sigma-Aldrich) for 30 min. And the lysate containing protein was centrifuged, then analysis with Western blot. Cell lysates or immune-precipitates were resolved by SDS-PAGE and proteins were transferred onto polyvinylidene difluoride membranes. The membranes were then maintained in 5% non-fat milk blocking for 2 h, and incubated with primary antibody for 12 h and followed by secondary antibody for 1h at room temperature. The proteins bands were visualized using ECL chemiluminescence system (Santa Cruz). The following antibodies were used: DCAF15 (SAB1103260, Sigma), ZEB1 (4C4, Novus), Myc (M4439; Sigma), Flag (F3165, Sigma), HA (M180-7; MLB), CUL1 (ab75817, Abcam), CUL2 (10981-2-AP, Proteintech), CUL3 (11107-1-AP, Proteintech), CUL4A (2715-S, EPITOMICS), CUL4B (12916-1-AP, Proteintech), CUL5 (ab34840, Abcam), and Actin (AC028; ABclonal). E-cadherin, N-cadherin, vimentin, β-catenin, and Slug antibodies were from CST (9782).
Immuno-precipitation analysis
To immune-precipitate the ectopically expressed Flag-tagged proteins, transfected cells were lysed in NP40 buffer. The whole-cell lysates were immune-precipitated with anti-Flag antibody-conjugated M2 agarose beads (Sigma) at 4°C overnight. After three washes with Flag lysis buffer, followed by two washes with BC100 buffer, the bound proteins were eluted using Flag-Peptide (Sigma)/BC100 for 5 h at 4°C. To immune-precipitate the endogenous proteins, cells were lysed with RIPA buffer. The supernatant was precleared with protein A/G beads (Sigma) and incubated with indicated antibodies overnight. Thereafter, protein A/G beads were applied at 4°C overnight. After 2 h of incubation, pellets were washed five times with lysis buffer and resuspended in sample buffer. And analysis with Western blot.
Immunofluorescence and confocal microscopy
Transfected cells were plated in glass-bottomed culture dishes (NEST) for 24 h. They were fixed with 4% paraformaldehyde, and then washed with PBS. After that, cells were permeabilized with 0.1% Triton X-100 for 15 min, and then washed with PBS. After treating the cells with blocking buffer (Beyotime) for 30 min, they were incubated with anti-Flag, anti-Myc, E-cadherin and vimentin, at 4°C overnight. Then, fluorescence labelled secondary antibodies were applied, and following DAPI was counterstained for 1 h at room temperature. An anti-fluorescence quencher was added dropwise and fixed with a coverslip. Images were taken using a confocal microscope (LSM710, Zeiss).
Quantitative RT-PCR (qRT-PCR)
Total RNA was extracted from transfected cells using the TRIzol reagent (Invitrogen), and the concentration was measured by NanoDrop1000 Spectrophotometer (Agilent, USA). cDNA was reversed transcribed by the Superscript RT kit (TOYOBO), according to the manufacturer’s instructions. qRT-PCR amplification was performed using the SYBR Prime Script RT-qPCR kit (Takara, Japan). All quantization was normalized to the level of internal control GAPDH. The primer sequences for qRT-PCR were listed in Supplementary Table 1.
CCK-8 assay
1,000 cells were plated in 96-well plates in 100 μl of media. 10 μl Cell Counting Kit (CCK-8) (Yeasen) solution was added into medium for 30 min before measuring absorbance at a wavelength of 450 nm by a microplate reader (Thermo Scientific) daily for continuous 5 days.
Colony formation assay
Cells were seeded at 6-well plates with a density of 1 × 10³ cells per well and then cultured for in complete medium for 10 days. Then, the colonies were fixed using 4% methyl alcohol for 20 min and stained with 5% crystal violet solution. Clones were photographed and counted to evaluate cell proliferation ability.
Migration and invasion assays
Migration and invasion chambers precoated with or without Matrigel (Corning) were prepared and placed into 24-well plates. Cells were digested into single cell suspension in 100 μl serum-free medium and 1 ×10⁵ cells were seeded into the upper chamber. And 700 μl DMEM medium with 10% FBS was added into the lower chamber. After 24 h of incubation, cells that invaded through the filters were stained with using 4% methyl alcohol for 20 min and stained with 5% crystal violet solution. The non-invading cells were wiped out with a cotton swab. The membrane was randomly photographed by a microscope.
Wound healing assay
After transfected cells reaching 80% confluence, they were cultured with 1% fetal bovine serum for 12 h. The scratch was made by sterile pipette tips and mark the scratched point. The migration distance was photographed at 0 h and 24 h at the same location. The average migration distance was measured and analyzed.
Statistical analysis
Student’s t-test was used for the two-group test, and one-way ANOVA was used for three or more groups test. Survival analysis was conducted using the Kaplan-Meier method. All data are shown as mean values ± SEM for experiments performed with at least three replicates. SPSS 22.0 and GraphPad Prism 6.0 software were used for analyses. * represents p < 0.05; ** represents p < 0.01; *** represents p < 0.001.
Author Contributions
Xiao Dong designed the study; Yang han, Lin Zhong and Encheng Zhang conducted the experiments; Yuqi Wang analyzed the data; Pingzhao Zhang wrote the manuscript; Chenji Wang and Qi Li revised the manuscript. Xiao Dong and Yang han contributed equally to this study. All authors read and approved the final manuscript.
Acknowledgments
We thank Professor Lin Zhong for his work on HCC specimens.
Conflicts of Interest
The authors declare no conflicts of interest.
Funding
This study was completely supported by the National Natural Science Foundation of China (No. 82073214 and NO. 81572310) and Outstanding disciplines leaders of Shanghai Municipal Commission of Health and Family Planning (No. 2018BR39).
References
- 1. Siegel RL, Miller KD, Jemal A. Cancer statistics, 2019. CA Cancer J Clin. 2019; 69:7–34. https://doi.org/10.3322/caac.21551 [PubMed]
- 2. Wallace MC, Preen D, Jeffrey GP, Adams LA. The evolving epidemiology of hepatocellular carcinoma: a global perspective. Expert Rev Gastroenterol Hepatol. 2015; 9:765–79. https://doi.org/10.1586/17474124.2015.1028363 [PubMed]
- 3. Kirstein MM, Wirth TC. [Multimodal treatment of hepatocellular carcinoma]. Internist (Berl). 2020; 61:164–69. https://doi.org/10.1007/s00108-019-00722-x [PubMed]
- 4. Vande Lune P, Abdel Aal AK, Klimkowski S, Zarzour JG, Gunn AJ. Hepatocellular Carcinoma: Diagnosis, Treatment Algorithms, and Imaging Appearance after Transarterial Chemoembolization. J Clin Transl Hepatol. 2018; 6:175–88. https://doi.org/10.14218/jcth.2017.00045 [PubMed]
- 5. Nakayama KI, Nakayama K. Ubiquitin ligases: cell-cycle control and cancer. Nat Rev Cancer. 2006; 6:369–81. https://doi.org/10.1038/nrc1881 [PubMed]
- 6. Petroski MD, Deshaies RJ. Function and regulation of cullin-RING ubiquitin ligases. Nat Rev Mol Cell Biol. 2005; 6:9–20. https://doi.org/10.1038/nrm1547 [PubMed]
- 7. Han T, Goralski M, Gaskill N, Capota E, Kim J, Ting TC, Xie Y, Williams NS, Nijhawan D. Anticancer sulfonamides target splicing by inducing RBM39 degradation via recruitment to DCAF15. Science. 2017; 356:eaal3755. https://doi.org/10.1126/science.aal3755 [PubMed]
- 8. Jackson S, Xiong Y. CRL4s: the CUL4-RING E3 ubiquitin ligases. Trends Biochem Sci. 2009; 34:562–70. https://doi.org/10.1016/j.tibs.2009.07.002 [PubMed]
- 9. Zhang Y, Morrone G, Zhang J, Chen X, Lu X, Ma L, Moore M, Zhou P. CUL-4A stimulates ubiquitylation and degradation of the HOXA9 homeodomain protein. EMBO J. 2003; 22:6057–67. https://doi.org/10.1093/emboj/cdg577 [PubMed]
- 10. Li B, Jia N, Kapur R, Chun KT. Cul4A targets p27 for degradation and regulates proliferation, cell cycle exit, and differentiation during erythropoiesis. Blood. 2006; 107:4291–299. https://doi.org/10.1182/blood-2005-08-3349 [PubMed]
- 11. Hannah J, Zhou P. Distinct and overlapping functions of the cullin E3 ligase scaffolding proteins CUL4A and CUL4B. Gene. 2015; 573:33–45. https://doi.org/10.1016/j.gene.2015.08.064 [PubMed]
- 12. Ting TC, Goralski M, Klein K, Wang B, Kim J, Xie Y, Nijhawan D. Aryl Sulfonamides Degrade RBM39 and RBM23 by Recruitment to CRL4-DCAF15. Cell Rep. 2019; 29:1499–510.e1496. https://doi.org/10.1016/j.celrep.2019.09.079 [PubMed]
- 13. Lu G, Middleton RE, Sun H, Naniong M, Ott CJ, Mitsiades CS, Wong KK, Bradner JE, Kaelin WG
Jr . The myeloma drug lenalidomide promotes the cereblon-dependent destruction of Ikaros proteins. Science. 2014; 343:305–09. https://doi.org/10.1126/science.1244917 [PubMed] - 14. An J, Ponthier CM, Sack R, Seebacher J, Stadler MB, Donovan KA, Fischer ES. pSILAC mass spectrometry reveals ZFP91 as IMiD-dependent substrate of the CRL4(CRBN) ubiquitin ligase. Nat Commun. 2017; 8:15398. https://doi.org/10.1038/ncomms15398 [PubMed]
- 15. Uehara T, Minoshima Y, Sagane K, Sugi NH, Mitsuhashi KO, Yamamoto N, Kamiyama H, Takahashi K, Kotake Y, Uesugi M, Yokoi A, Inoue A, Yoshida T, et al. Selective degradation of splicing factor CAPERalpha by anticancer sulfonamides. Nat Chem Biol. 2017; 13:675–80. https://doi.org/10.1038/nchembio.2363 [PubMed]
- 16. Zhang P, Sun Y, Ma L. ZEB1: at the crossroads of epithelial-mesenchymal transition, metastasis and therapy resistance. Cell Cycle. 2015; 14:481–87. https://doi.org/10.1080/15384101.2015.1006048 [PubMed]
- 17. Lehmann W, Mossmann D, Kleemann J, Mock K, Meisinger C, Brummer T, Herr R, Brabletz S, Stemmler MP, Brabletz T. ZEB1 turns into a transcriptional activator by interacting with YAP1 in aggressive cancer types. Nat Commun. 2016; 7:10498. https://doi.org/10.1038/ncomms10498 [PubMed]
- 18. Giannelli G, Koudelkova P, Dituri F, Mikulits W. Role of epithelial to mesenchymal transition in hepatocellular carcinoma. J Hepatol. 2016; 65:798–808. https://doi.org/10.1016/j.jhep.2016.05.007 [PubMed]
- 19. Liu Z, Wang Y, Dou C, Xu M, Sun L, Wang L, Yao B, Li Q, Yang W, Tu K, Liu Q. Hypoxia-induced up-regulation of VASP promotes invasiveness and metastasis of hepatocellular carcinoma. Theranostics. 2018; 8:4649–63. https://doi.org/10.7150/thno.26789 [PubMed]
- 20. Onder TT, Gupta PB, Mani SA, Yang J, Lander ES, Weinberg RA. Loss of E-cadherin promotes metastasis via multiple downstream transcriptional pathways. Cancer Res. 2008; 68:3645–54. https://doi.org/10.1158/0008-5472.can-07-2938 [PubMed]
- 21. Han L, Chen W, Xia Y, Song Y, Zhao Z, Cheng H, Jiang T. MiR-101 inhibits the proliferation and metastasis of lung cancer by targeting zinc finger E-box binding homeobox 1. Am J Transl Res. 2018; 10:1172–83. [PubMed]
- 22. Li L, Zheng YL, Jiang C, Fang S, Zeng TT, Zhu YH, Li Y, Xie D, Guan XY. HN1L-mediated transcriptional axis AP-2gamma/METTL13/TCF3-ZEB1 drives tumor growth and metastasis in hepatocellular carcinoma. Cell Death Differ. 2019; 26:2268–83. https://doi.org/10.1038/s41418-019-0301-1 [PubMed]
- 23. Sreekumar R, Emaduddin M, Al-Saihati H, Moutasim K, Chan J, Spampinato M, Bhome R, Yuen HM, Mescoli C, Vitale A, Cillo U, Rugge M, Primrose J, et al. Protein kinase C inhibitors override ZEB1-induced chemoresistance in HCC. Cell Death Dis. 2019; 10:703. https://doi.org/10.1038/s41419-019-1885-6 [PubMed]
- 24. Han J, Xie C, Pei T, Wang J, Lan Y, Huang K, Cui Y, Wang F, Zhang J, Pan S, Liang Y, Zhen T, Song R, et al. Deregulated AJAP1/beta-catenin/ZEB1 signaling promotes hepatocellular carcinoma carcinogenesis and metastasis. Cell Death Dis. 2017; 8:e2736. https://doi.org/10.1038/cddis.2017.126 [PubMed]
- 25. Chen J, Zhang L, Ma S, Lu G, Wang D. The aberrant expressions of MACC1, ZEB1, and KLF4 in hepatocellular carcinoma and their clinical significance. Int J Clin Exp Pathol. 2019; 12:3653–61. [PubMed]
- 26. Chang L, Yuan Y, Li C, Guo T, Qi H, Xiao Y, Dong X, Liu Z, Liu Q. Upregulation of SNHG6 regulates ZEB1 expression by competitively binding miR-101-3p and interacting with UPF1 in hepatocellular carcinoma. Cancer Lett. 2016; 383:183–94. https://doi.org/10.1016/j.canlet.2016.09.034 [PubMed]
- 27. Gupta A, Yang LX, Chen L. Study of the G2/M cell cycle checkpoint in irradiated mammary epithelial cells overexpressing Cul-4A gene. Int J Radiat Oncol Biol Phys. 2002; 52:822–30. https://doi.org/10.1016/s0360-3016(01)02739-0 [PubMed]
- 28. Yang D, Zhao Y, Liu J, Sun Y, Jia L. Protective autophagy induced by RBX1/ROC1 knockdown or CRL inactivation via modulating the DEPTOR-MTOR axis. Autophagy. 2012; 8:1856–58. https://doi.org/10.4161/auto.22024 [PubMed]
- 29. Liu M, Jiang K, Lin G, Liu P, Yan Y, Ye T, Yao G, Barr MP, Liang D, Wang Y, Gong P, Meng S, Piao H. Ajuba inhibits hepatocellular carcinoma cell growth via targeting of beta-catenin and YAP signaling and is regulated by E3 ligase Hakai through neddylation. J Exp Clin Cancer Res. 2018; 37:165. https://doi.org/10.1186/s13046-018-0806-3 [PubMed]
- 30. Zhang L, Chen J, Ning D, Liu Q, Wang C, Zhang Z, Chu L, Yu C, Liang HF, Zhang B, Chen X. FBXO22 promotes the development of hepatocellular carcinoma by regulating the ubiquitination and degradation of p21. J Exp Clin Cancer Res. 2019; 38:101. https://doi.org/10.1186/s13046-019-1058-6 [PubMed]
- 31. Yin J, Zhu JM, Shen XZ. The role and therapeutic implications of RING-finger E3 ubiquitin ligases in hepatocellular carcinoma. Int J Cancer. 2015; 136:249–57. https://doi.org/10.1002/ijc.28717 [PubMed]
- 32. Jin J, Arias EE, Chen J, Harper JW, Walter JC. A family of diverse Cul4-Ddb1-interacting proteins includes Cdt2, which is required for S phase destruction of the replication factor Cdt1. Mol Cell. 2006; 23:709–21. https://doi.org/10.1016/j.molcel.2006.08.010 [PubMed]
- 33. Du X, Volkov OA, Czerwinski RM, Tan H, Huerta C, Morton ER, Rizzi JP, Wehn PM, Xu R, Nijhawan D, Wallace EM. Structural Basis and Kinetic Pathway of RBM39 Recruitment to DCAF15 by a Sulfonamide Molecular Glue E7820. Structure. 2019; 27:1625–33.e1623. https://doi.org/10.1016/j.str.2019.10.005 [PubMed]
- 34. Jia X, Pan L, Zhu M, Hu H, Zhai L, Liu J, Hu M, Liu B, Tan M. pSILAC method coupled with two complementary digestion approaches reveals PRPF39 as a new E7070-dependent DCAF15 substrate. J Proteomics. 2020; 210:103545. https://doi.org/10.1016/j.jprot.2019.103545 [PubMed]