Detection and characterization of “senolytic” activity during the screening of clinically-approved therapeutics
Here, we used a simplified screening assay to identify and repurpose clinically-approved therapeutics with “senolytic” activity for the treatment of aging and aging-associated disorders (Figure 1).
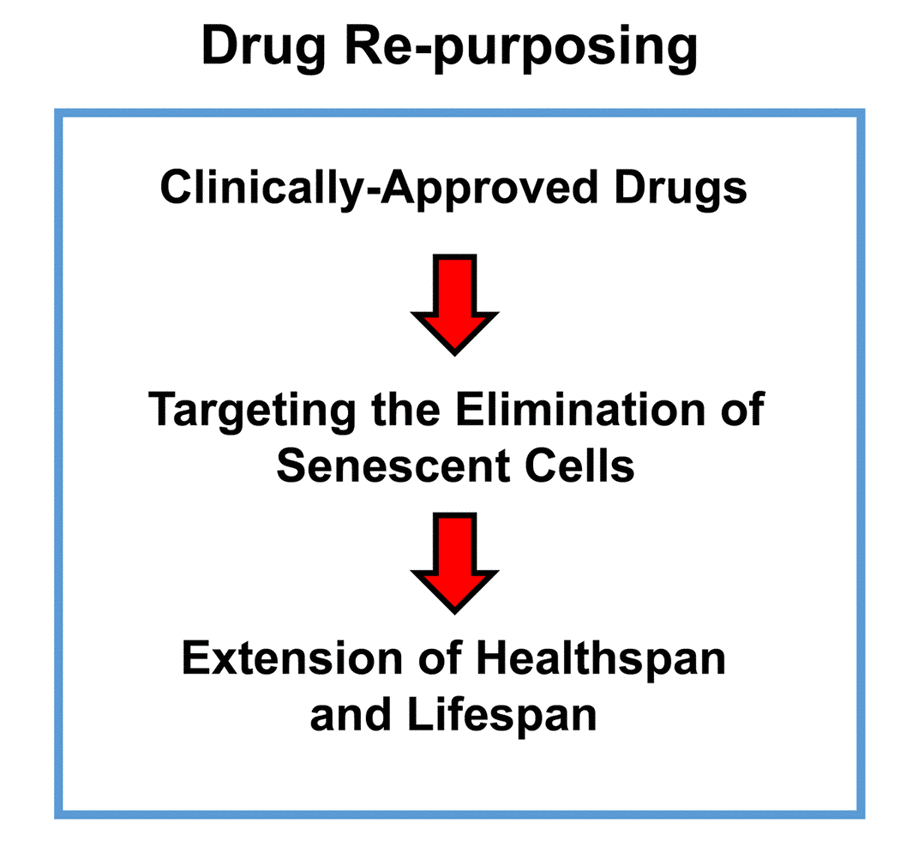
Figure 1. Targeting senescent cells with clinically-approved drugs. Here, we propose to use clinically-approved drugs, including antibiotics, to target and eliminate senescent cells, with the goal of increasing healthspan and lifespan.
More specifically, we employed two independent normal, non-immortalized, human fibroblast cell lines, namely i) MCR-5 for screening and ii) BJ for validation (Figure 2). Mechanistically, the responses of “normal” fibroblasts and “senescent” fibroblasts were directly compared, side-by-side. Drugs that preferentially killed senescent fibroblasts, but not normal fibroblasts, were considered as a positive hit. Using this approach, we identified two Erythromycin-family members, Azithromycin and Roxithromycin that preferentially targeted senescent fibroblasts (Table 1). However, Erythromycin itself did not show any senolytic activity.
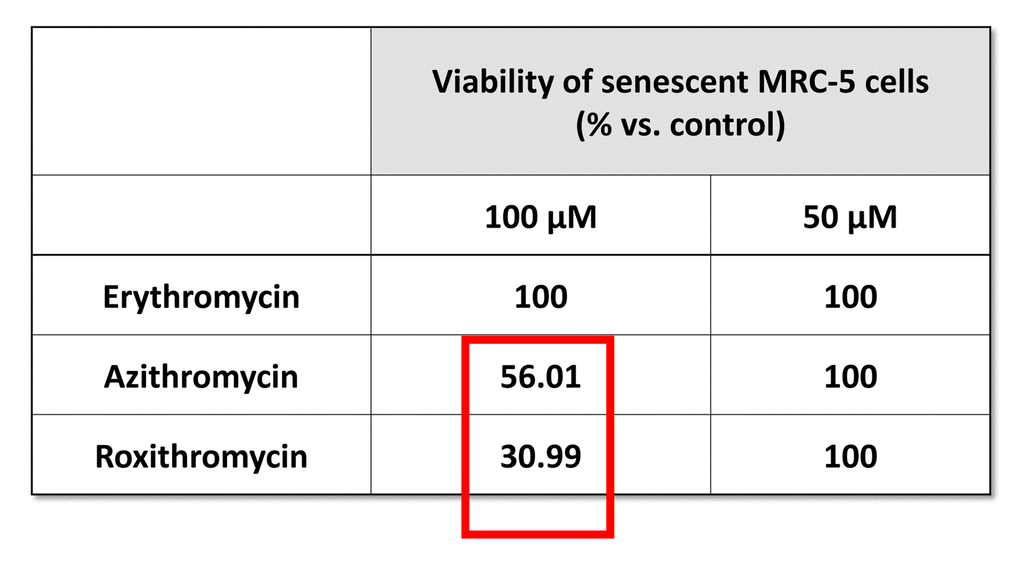
Table 1. The effects of macrolide antibiotics on BrdU-treated senescent MRC-5 fibroblasts. This table briefly summarizes the biological effects of three antibiotics, namely Erythromycin, Azithromycin and Roxithromycin, on cell viability. While Erythromycin was completely ineffective, Roxithromycin and Azithromycin selectively eliminated large numbers of senescent cells at 100 µM, but had no effect at a lower dose (50 µM). Azithromycin was found to be the most selective compound, as it eliminated senescent cells, without affecting control cells.
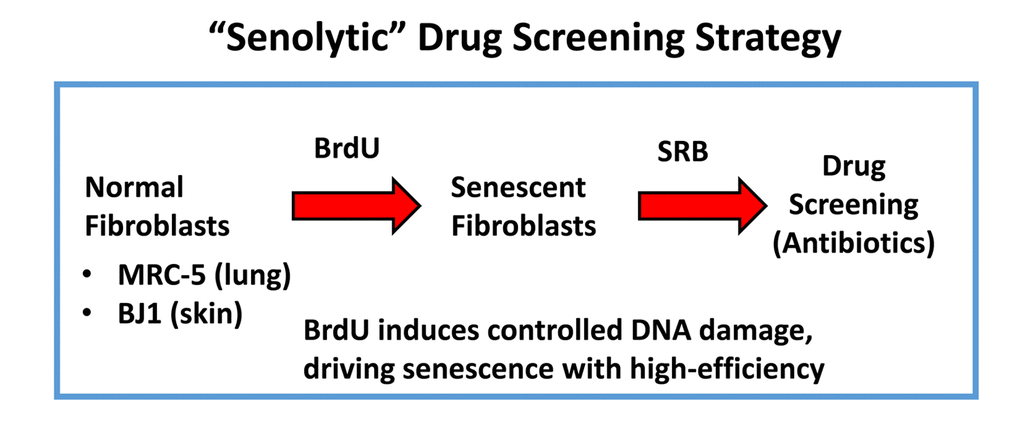
Figure 2. “Senolytic” drug screening strategy. Here, normal fibroblasts (MRC-5 and BJ), originally derived from human lung and skin tissues, were subjected to prolonged culture (8-days) in the presence of BrdU (100 μM) to induce controlled DNA-damage and senescence. Then, isogenically-matched cultures of normal and senescent fibroblasts were employed for drug screening to identify the potential senolytic activity of clinically-approved drugs, such as antibiotics (Erythromycin, Azithromycin and Roxithromycin, among others). Senolytic activity was detected using the SRB assay, which measures the amount of protein remaining attached to the tissue-culture dishes, which is a surrogate marker for cell viability.
Figure 3 shows a comparison of the precise chemical structures of the Erythromycin family members we tested. Note that the compounds are nearly identical, suggesting highly specific interactions must underpin the senolytic activity of Azithromycin and Roxithromycin.
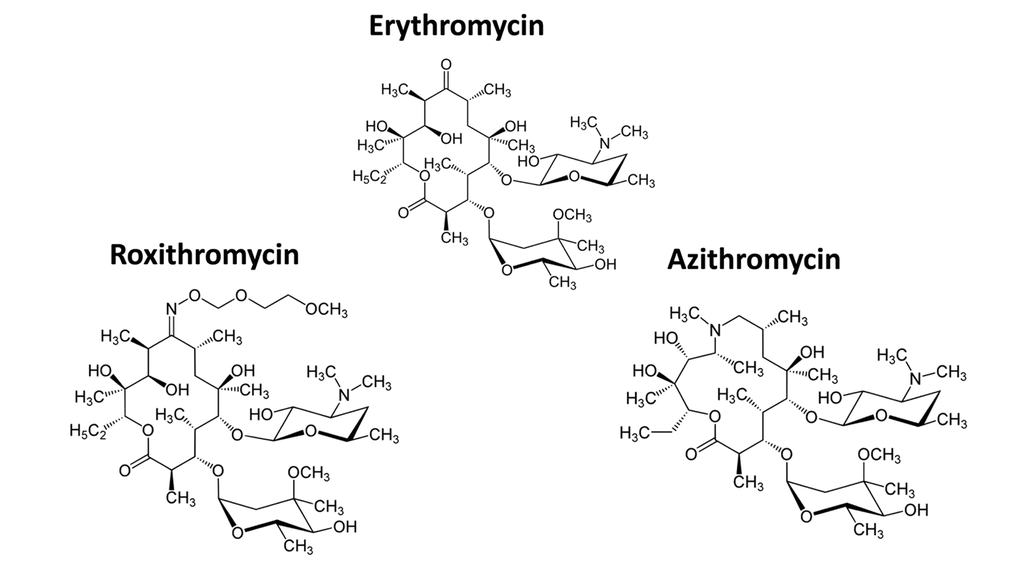
Figure 3. Chemical structures of Erythromycin and related compounds. Note that Erythromycin, Azithromycin and Roxithromycin all have very similar chemical structures, but differ mainly in their side groups. All three compounds are macrolide antibiotics and consist of a large core macrocyclic lactone ring, with two deoxy-sugars attached to it.
Furthermore, we validated previous findings that BrdU-induced DNA-damage is indeed sufficient to induce cellular senescence. Figure 4 shows that MRC-5 fibroblasts treated with BrdU underwent cell cycle arrest, as evidenced by i) a ~70% reduction in the number of cells in S-phase and ii) the induction of Beta-Galactosidase activity.
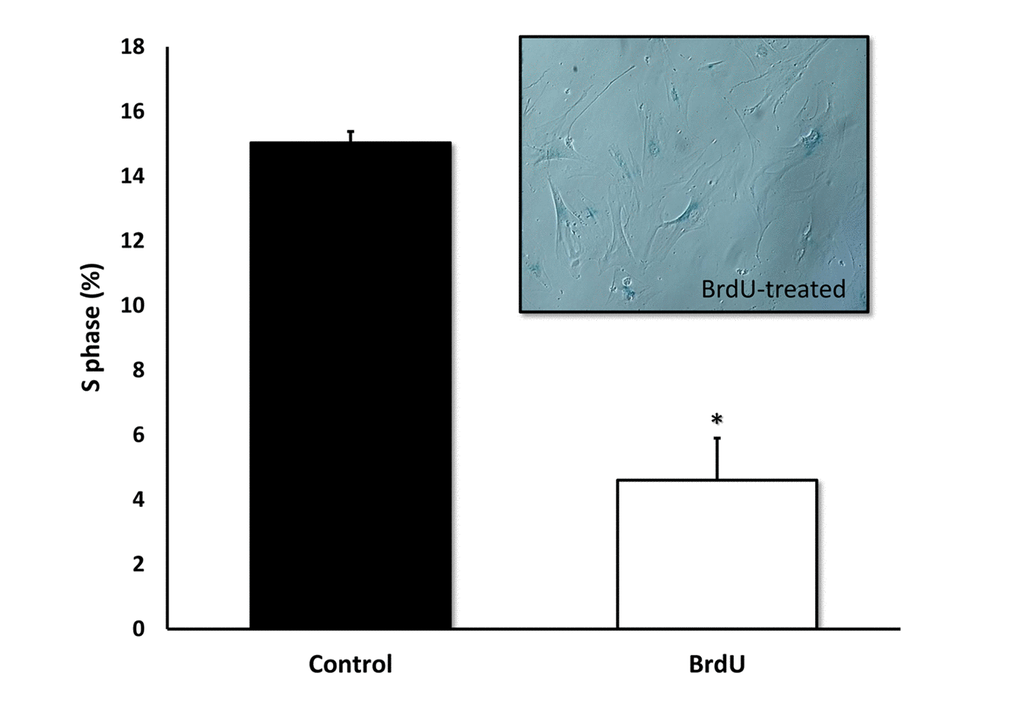
Figure 4. BrdU-treatment of MRC-5 cells effectively inhibits DNA-synthesis and induces Beta-Galactosidase. Two-day treatment with BrdU significantly reduced DNA synthesis in MRC-5 fibroblasts by ~70%, as measured with the Muse cell cycle kit. MRC-5 cells after 8 days of BrdU treatment were positively stained for Beta-Galactosidase. n=3; * p < 0.05.
Figures 5 directly shows that Azithromycin, at 100 μM, had no effect on the viability of normal MRC-5 lung fibroblasts, but selectively killed only senescent MCR-5 fibroblasts. In comparison, Roxithromycin, at the same concentration, more effectively killed senescent MCR-5 fibroblasts (~70%), but also had a small effect on the viability of normal MRC-5 fibroblasts (Figure 6). Neither drug showed any significant effects on viability at 50 μM, indicating that the effects we observed were concentration-dependent. As such, Azithromycin toxicity showed the highest specificity for selectively targeting the senescent cell phenotype.
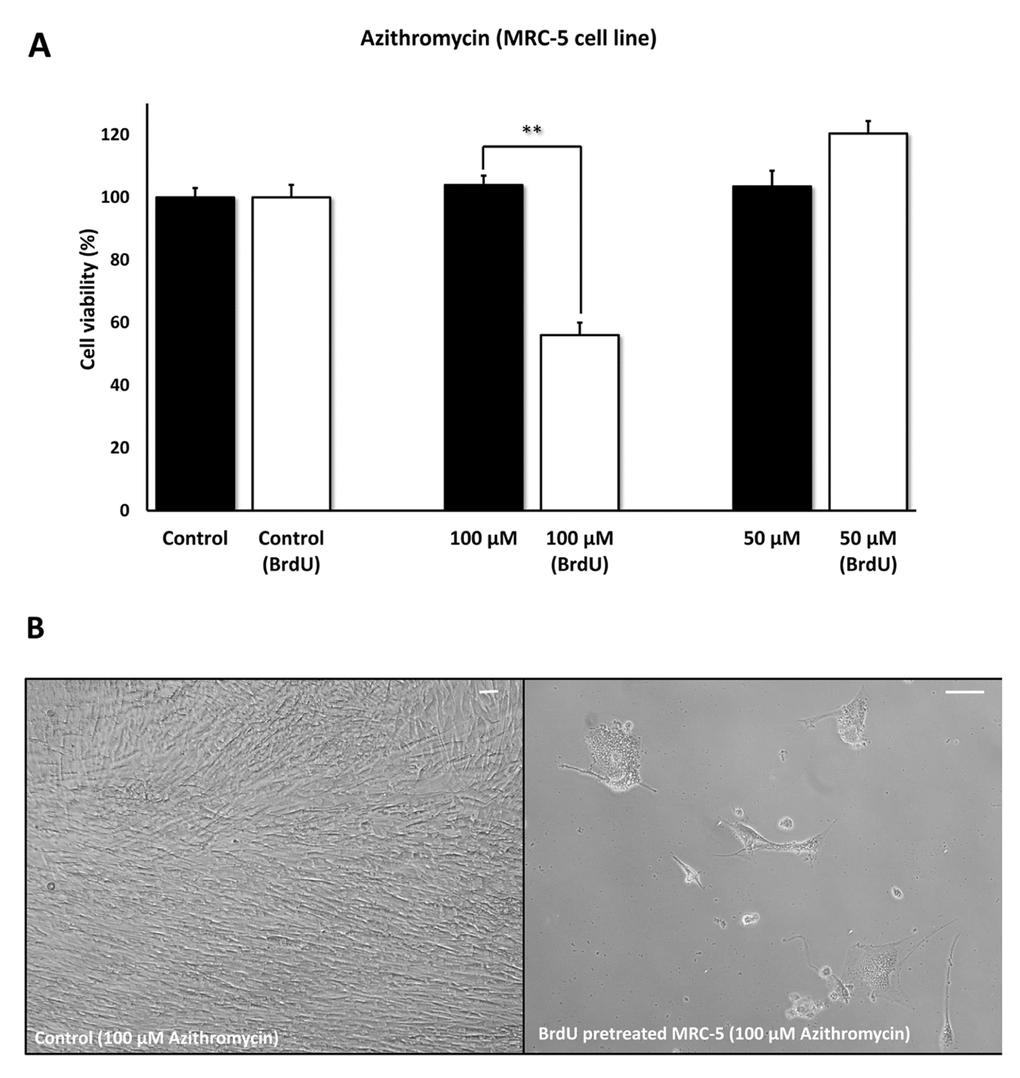
Figure 5. Azithromycin shows senolytic activity in senescent MRC-5 human lung fibroblasts. MRC-5 cells were pre-treated with BrdU for 8 days (to induce senescence), before they were exposed to Azithromycin for another 5 days. After that, the SRB assay was performed to determine the effects of the drug on cell viability. Azithromyin had a potent and selective effect on MRC-5, as it eliminated ~50% of senescent cells without affecting control cells after 5 days, at a concentration of 100 µM. However, Azithromycin had no effect at 50 µM. These experiments were repeated at least 3 times independently, with very similar results. Note that the scale bar represents 20 µm in the images. ** p < 0.01.

Figure 6. Roxithromycin shows senolytic activity in senescent MRC-5 human lung fibroblasts. MRC-5 cells were pre-treated with BrdU for 8 days (to induce senescence), before they were exposed to Roxithromycin for another 5 days. After that, the SRB assay was performed to determine the effects of the drug on cell viability. Roxithromycin had a potent and selective effect on MRC-5, as it eliminated more than 50% of senescent cells after 5 days, at a concentration of 100 µM. However, Roxithromycin had no effect at 50 µM. These experiments were repeated at least 3 times independently, with very similar results. * p < 0.05.
Phenotypic and metabolic effects of Azithromycin in MRC-5 human fibroblasts
To better mechanistically understand the phenotypic and metabolic effects of Azithromycin, we employed normal MRC-5 fibroblasts.
Figure 7 shows that Azithromycin is a powerful inducer of the autophagic phenotype. Autophagy was quantitatively measured by detection of autophagic LC3 proteins, using the Muse Autophagy LC3-antibody based kit. Note that Azithromycin treatment resulted in a > 3-fold elevation in autophagy in MRC-5 cells.
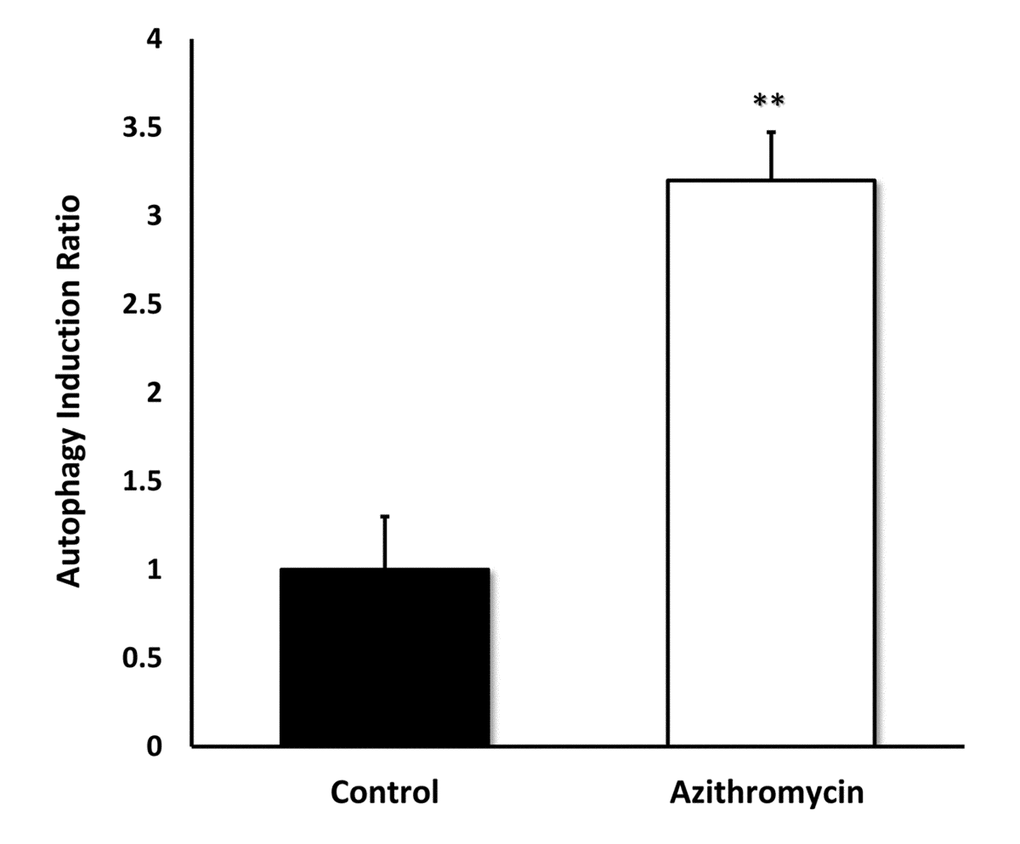
Figure 7. Azithromycin strongly induces autophagy in MRC-5 cells. MRC-5 cells were treated with Azithromycin at 50 µM for 72 hours. Then, autophagy was monitored by detection of autophagic LC3 proteins with the Muse Autophagy LC3-antibody based kit. Azithromycin treatment resulted in more than a 3-fold elevation in autophagy in MRC-5 cells.
We next measured the effects of Azithromycin on i) aerobic glycolysis and ii) mitochondrial metabolism, using the Seahorse XFe96 metabolic flux analyzer. Figure 8 shows that even low concentrations of Azithromycin (25 μM) effectively induced glycolytic flux in MRC-5 fibroblasts, in the presence of oxygen.
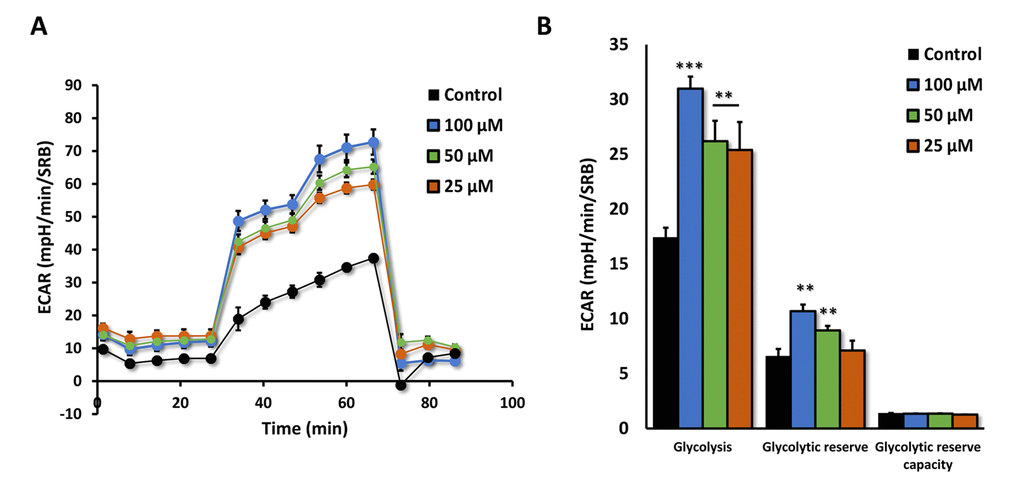
Figure 8. Azithromycin induces glycolytic activity in MRC-5 cells. After 72 hours of treatment with Azithromycin (25 to 100 µM), MRC-5 cells were subjected to metabolic flux analysis with the Seahorse XFe96, which measures ECAR (extracellular acidification rate). Note that all concentrations elevated glycolysis. n=3; ** p < 0.01,*** p < 0.001.
Moreover, the effects of Azithromycin on mitochondrial oxygen consumption rate (OCR) are highlighted in Figure 9A,B. Note that the mitochondrial effects of Azithromycin were concentration-dependent and bi-phasic. At 25 μM, Azithromycin did not show any effects on OCR. However, at 50 μM, the effects of Azithromycin clearly inhibited mitochondrial metabolism, especially effecting maximal respiration and spare respiratory capacity. In contrast, at 100 μM, Azithromycin actually stimulated maximal respiration and more than doubled spare respiratory capacity. This may represent a cellular compensatory response to Azithromycin treatment, to overcome its mitochondrial inhibitory effects.
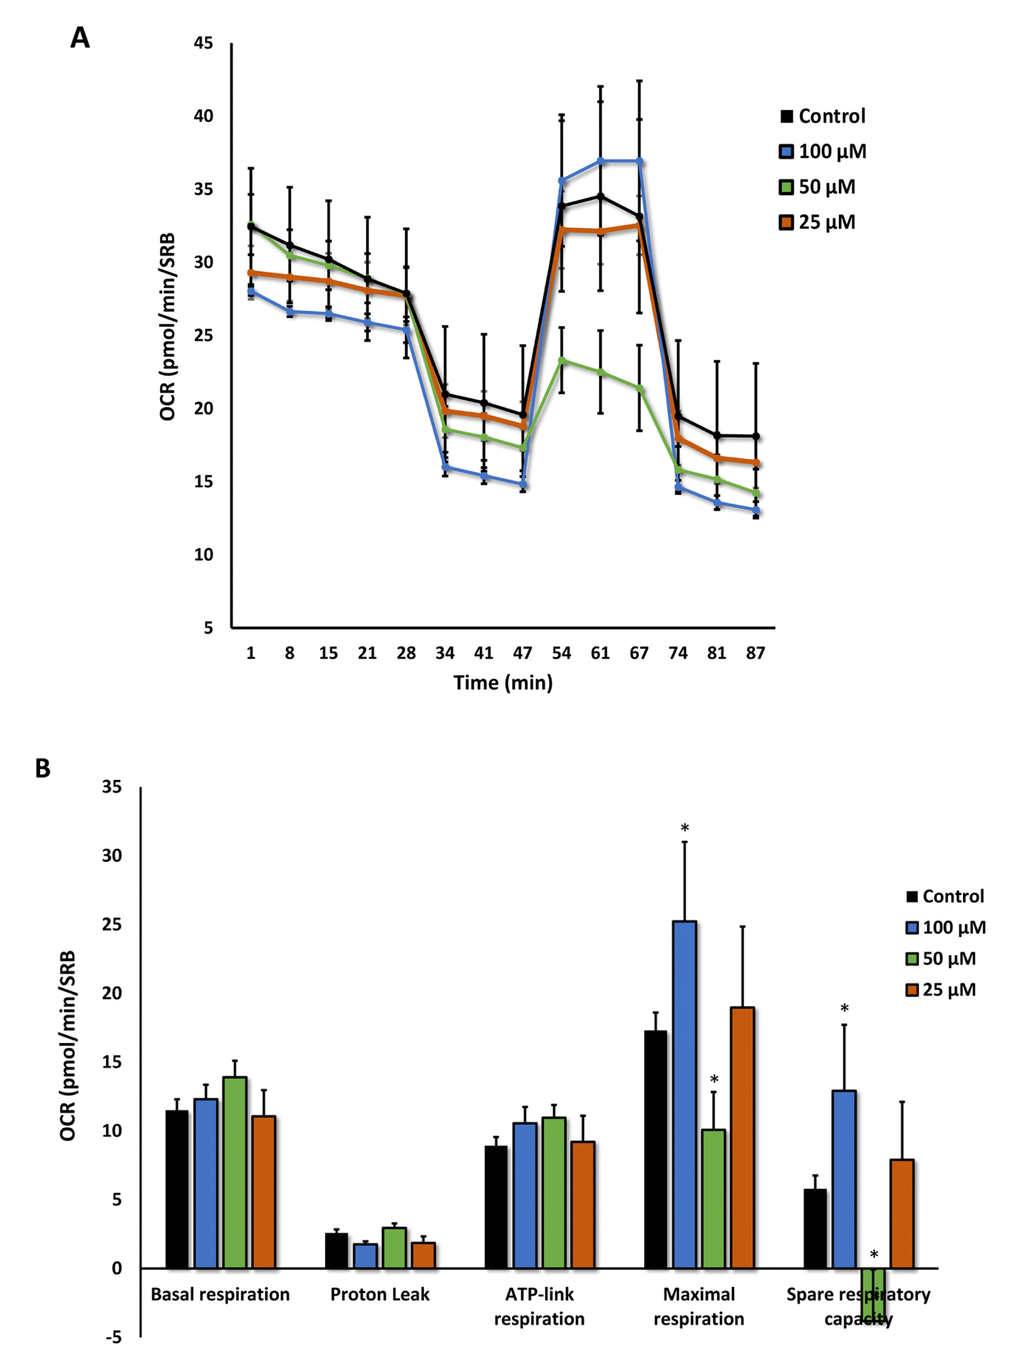
Figure 9. Azithromycin has biphasic effects on oxygen consumption in MRC-5 cells. After 72 hours of treatment with Azithromycin (25 to 100 µM), MRC-5 cells were subjected to metabolic flux analysis with the Seahorse XFe96, which measures OCR (the oxygen consumption rate). Note that the highest dose (100 µM) triggered increased mitochondrial respiration, while the lower concentrations (50 µM) significantly reduced it. However, 25 µM did not have any significant effects on OCR. n=3; * p < 0.05.
Validating the selectivity and potency of Azithromycin using BJ human fibroblasts
To further validate the senolytic activity of Azithromycin, we also assessed its selective effects by employing normal, non-immortalized, BJ human skin fibroblasts. Figure 10 shows that Azithromycin was more potent in BJ skin fibroblasts, showing significant “senolytic” activity at only 50 μM. Remarkably, Azithromycin also increased the viability of normal BJ skin fibroblasts, by > 25%. As such, Azithromycin shows comparable selectively and senolytic activity in human fibroblasts derived from two different anatomic sites (lung tissue and skin).
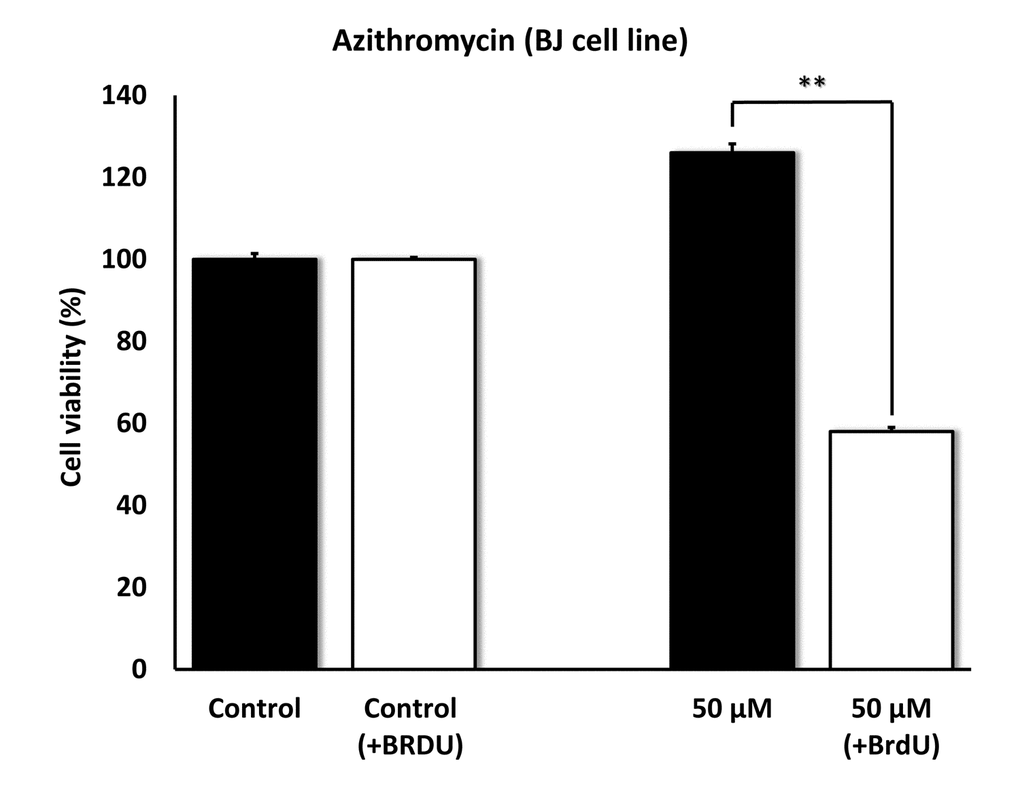
Figure 10. Azithromycin also shows senolytic activity in senescent BJ human skin fibroblasts. BJ cells were pretreated with BrdU for 8 days (to induce senescence), before they were exposed to Azithromycin for another 5 days. After that, SRB assay was performed to determine the effects of Azithromycin on cell viability. Azithromyin had a potent and selective effect on BJ cells, as it eliminated > 50% of senescent cells without reducing the viability of control cells after 5 days at 50 µM. These experiments were repeated at least 3 times independently, with very similar results. ** p<0.01.
Independent validation of the high selectivity of Azithromycin for targeting senescent cells using the xCELLigence system
Because senescent cells undergo the so-called senescence-associated secretory phenotype (SASP), which involves dramatic increases in the synthesis and secretion of proteins [1–7], we were concerned that our assay system – which measures protein – might be actually under-estimating the ability of Azithromycin to target senescent cells.
To address this issue directly, we used another independent assay system (called xCELLigence) that does not depend on proteins, but instead uses electrical impedance to continuously measure cell proliferation, in a real-time fashion. Using this approach, we see that Azithromycin preferentially targets senescent cells, removing approximately 97% of them with great efficiency (Figure 11). This represents a near 25-fold reduction in senescent cells (p < 0.001).
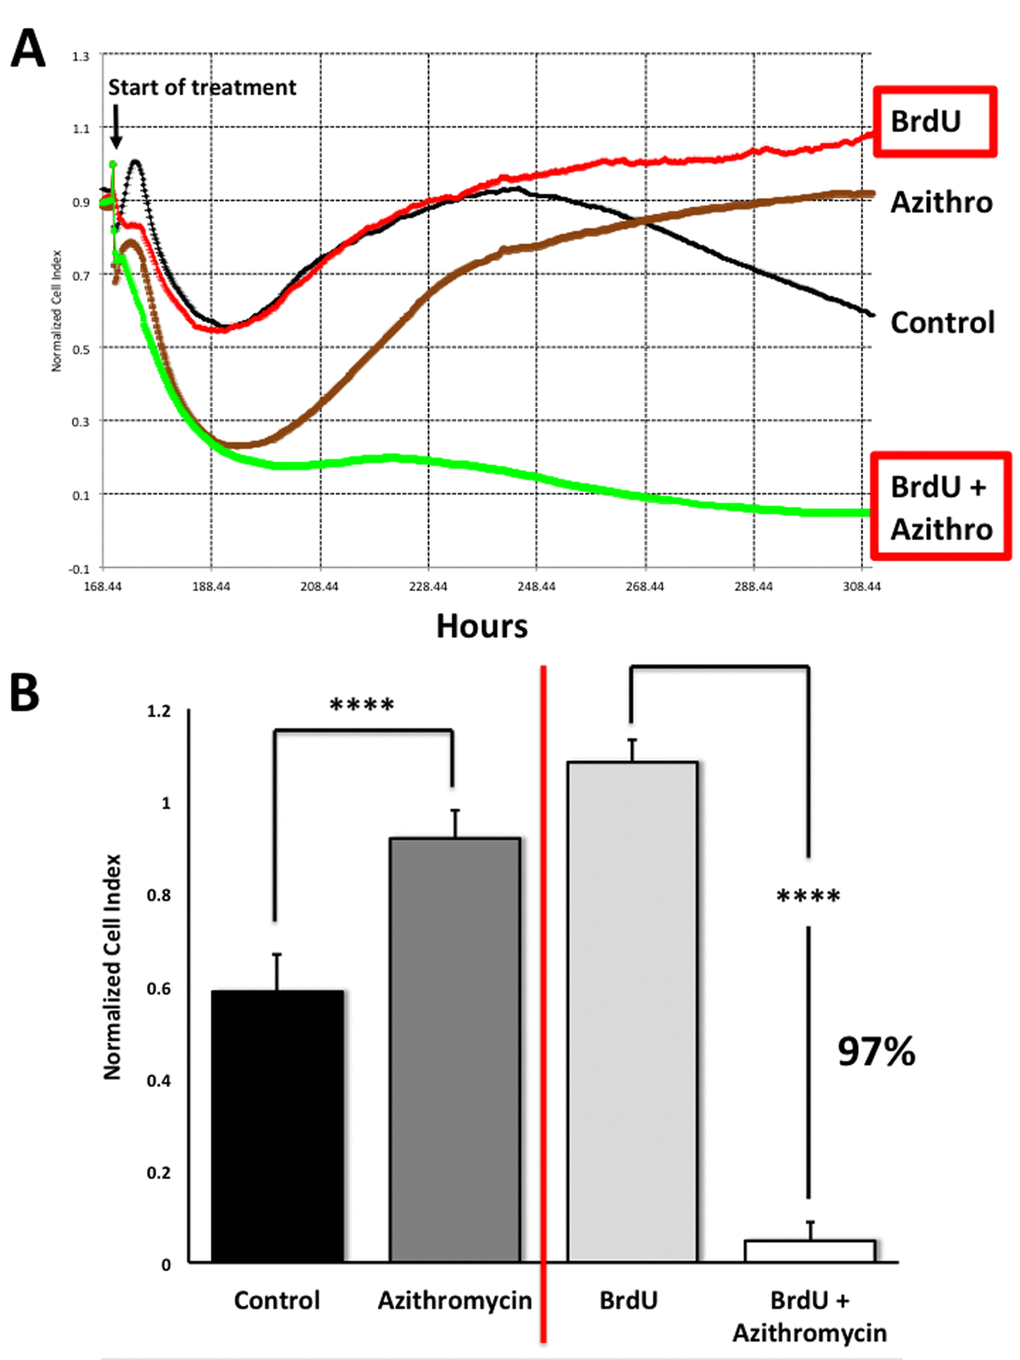
Figure 11. Assessing the efficacy of Azithromycin in the selective targeting of senescent MRC-5 cells, using the xCELLigence system. The xCELLigence system allows for the real-time, label-free, monitoring of cell health and behavior, via high frequency measurement of cell-induced electrical impedance. Panel (A) A representative cell tracing is shown. Note that senescent cells (BrdU-treated/MRC-5 fibroblasts) were effectively killed; directly compare the red curve (BrdU only) versus the green curve (BrdU plus Azithromycin). For normal MRC-5 fibroblasts, compare the black curve (Control) with the browncurve (Azithromycin). Panel (B) Bar graphs highlighting the final cell index, are shown as the average + the SEM. Approximately 97% of the senescent MRC-5 cells are targeted by Azithromycin treatment. In contrast, normal control MRC-5 cells are only transiently affected by Azithromycin, and they rapidly recover via cell proliferation, exceeding vehicle-alone control cell levels by greater than 30%. **** p < 0.001.
This real-time analysis also revealed that the population of normal control MRC-5 cells are also transiently affected by Azithromycin, but that they rapidly recover through additional cell proliferation (Figure 11), exceeding vehicle-alone control cell levels by > 30% (p < 0.001).
Therefore, this real-time assay system is superior to our static SRB assay, for more directly visualizing the potential “senolytic” effects of compounds, during drug screening.