


Introduction
Brain activity depends on GABAergic inhibitory interneurons, a heterogeneous class of neurons distinguished by diverse anatomical, biochemical and physiological characteristics [1]. Beyond their role in the regulation of glutamatergic neurons firing, GABAergic interneurons activity regulate neuronal network information processing, affecting functions as diverse as, for example, cognition, pain transmission [2] and feeding behavior [3]. More than 20 categories of inhibitory GABAergic interneurons have been described in the cortex and the hippocampus [4, 5]. Three major classes of GABAergic neurons expressing Parvalbumin (Pvalb), Somatostatin (Sst) and 5HTr3A respectively have been described, however, the extent of GABAergic cellular diversity begins only recently to be appreciated thanks to single cell transcriptomic analysis [6, 7]. To generate these diverse morphotypes, neuronal progenitors engage in stereotyped transcriptional trajectories in which combinatorial sequences of transcription factors (TFs) progressively unfold specific differentiation programs [8].
Dlx genes encode a family of homeodomain transcription factors that control multiple aspects of embryonic development [9] including neurogenesis [10]. In mammals, six Dlx genes are arranged in three pairs of closely linked transcription units: Dlx1/Dlx2, Dlx3/Dlx4 and Dlx5/Dlx6 [11, 12]. During early development, Dlx5 is initially expressed in the anterior neural ridge and its derivatives [13]. At later stages, during brain morphogenesis, Dlx1, Dlx2, Dlx5, and Dlx6 are expressed in precursors of the GABAergic lineage [10]. Their expression follows a temporal, positional, and functional sequence in the ventricular/subventricular (VZ/SVZ) zone of the embryonic ganglionic eminence (GE) [14]: Dlx2 and Dlx1 are mainly found in neuroepithelial cells of the VZ, while Dlx5 is mostly expressed in cells of the SVZ and migrating neuroblasts. Later in embryogenesis, Dlx5 is expressed by cells of the rostral migratory stream (RMS), and of the olfactory bulb (OB) [15].
In the adult brain, the expression of a Dlx5/6 enhancer/reporter construct [16] and of a Dlx5 BAC [17] in transgenic mice suggests that a low expression level of Dlx5/6 is maintained in mature GABAergic interneurons.
The function of Dlx5/6 in adult GABAergic neurons has been, so far, difficult to analyze due to perinatal lethality of mutant mice [18–21]. Nonetheless, heterochronic grafting experiments have shown that immature Dlx5/6-null interneurons transplanted into wild type newborn brains fail to differentiate into Pvalb-positive GABAergic neurons, although other GABAergic subtypes are present [17]. Moreover, Dlx2 and Dlx5 have been shown to regulate GABAergic differentiation through the participation to protein complexes containing MAGE-D1 and Necdin [22]. Interestingly, loss of Necdin gene expression is associated with Prader-Willi Syndrome (PWS) [23], a neurobehavioral disorder characterized by hyperphagia and mental health disorders with accelerated aging [24].
In humans, DLX5 is located on chromosome 7q21.3 and is part of a gene cluster imprinted in lymphoblasts and brain tissues [25]. In the mouse brain, however, Dlx5 is biallelically expressed with preferential transcription of the maternal allele [26]. An interesting association between DLX5 and the aging process comes from the linear correlation observed between aging and hypermethylation of DLX5 [27, 28] or during senescence of human mesenchymal stem cells [29].
Although Dlx5 and Dlx6 are important for the development of cortical GABAergic interneurons [30], their distribution and function in the adult brain [16] and their implication in neuropsychiatric conditions remain elusive. Adolescent mice, heterozygous for a generalized deletion of Dlx5 and Dlx6 (Dlx5/6+/-), present traits reminiscent of human schizophrenia [31], but also gonadal [32], bone [33] and craniofacial anomalies [34] not directly associated to GABAergic interneurons.
Here we analyze the phenotype of VgatΔDlx5-6 mice in which Dlx5 and Dlx6 are both inactivated only in GABAergic interneurons. Heterozygous and homozygous mutants (VgatΔDlx5-6/+ and VgatΔDlx5-6) present a reduction in anxiety-like and obsessive-compulsive-like behaviors, have less adipose tissue and live 33% longer and in better health than their control littermates. We conclude that Dlx5/6-dependent regulations in GABAergic interneurons affect behavior as well as metabolism, and contribute to determine healthspan and lifespan.
Results
Inactivation of Dlx5/6 in adult GABAergic neurons
We first analyzed Dlx5lacZ/+ mice in which Dlx5 exons I and II are replaced by the E. coli lacZ gene and β-galactosidase activity reproduces the known pattern of expression of the gene in embryonic [18] and adult tissues [35]. In the central nervous system (CNS) of adult Dlx5lacZ/+ mice, β-galactosidase activity is widely detected in forebrain regions including the cerebral cortex, the striatum and the hypothalamus (Figure 1A–1C). Double immunofluorescence labelling showed that most cortical Parvalbumin (84%), Calretinin (100%) and Somatostatin (89%) interneurons are positive for Dlx5 (Figure 1D–1D”). Single cell RNA sequencing analysis (scRNA-seq) of publicly available data sets [36] showed that Dlx5 and Dlx6 expression is restricted to all subtypes of GABAergic interneurons characterized by expression of Gad1/2 and Vgat including Sst, Pvalb, HTr3a, Npy and CR clusters (Figure 1E, Supplementary Figure 1). In contrast, Dlx5/6 expression was not detected in glutamatergic neurons (Supplementary Figure 1, Vglut2) nor in mature astrocytes (Aldh1l1) and oligodendrocytes (Olig2) (Supplementary Figure 1).
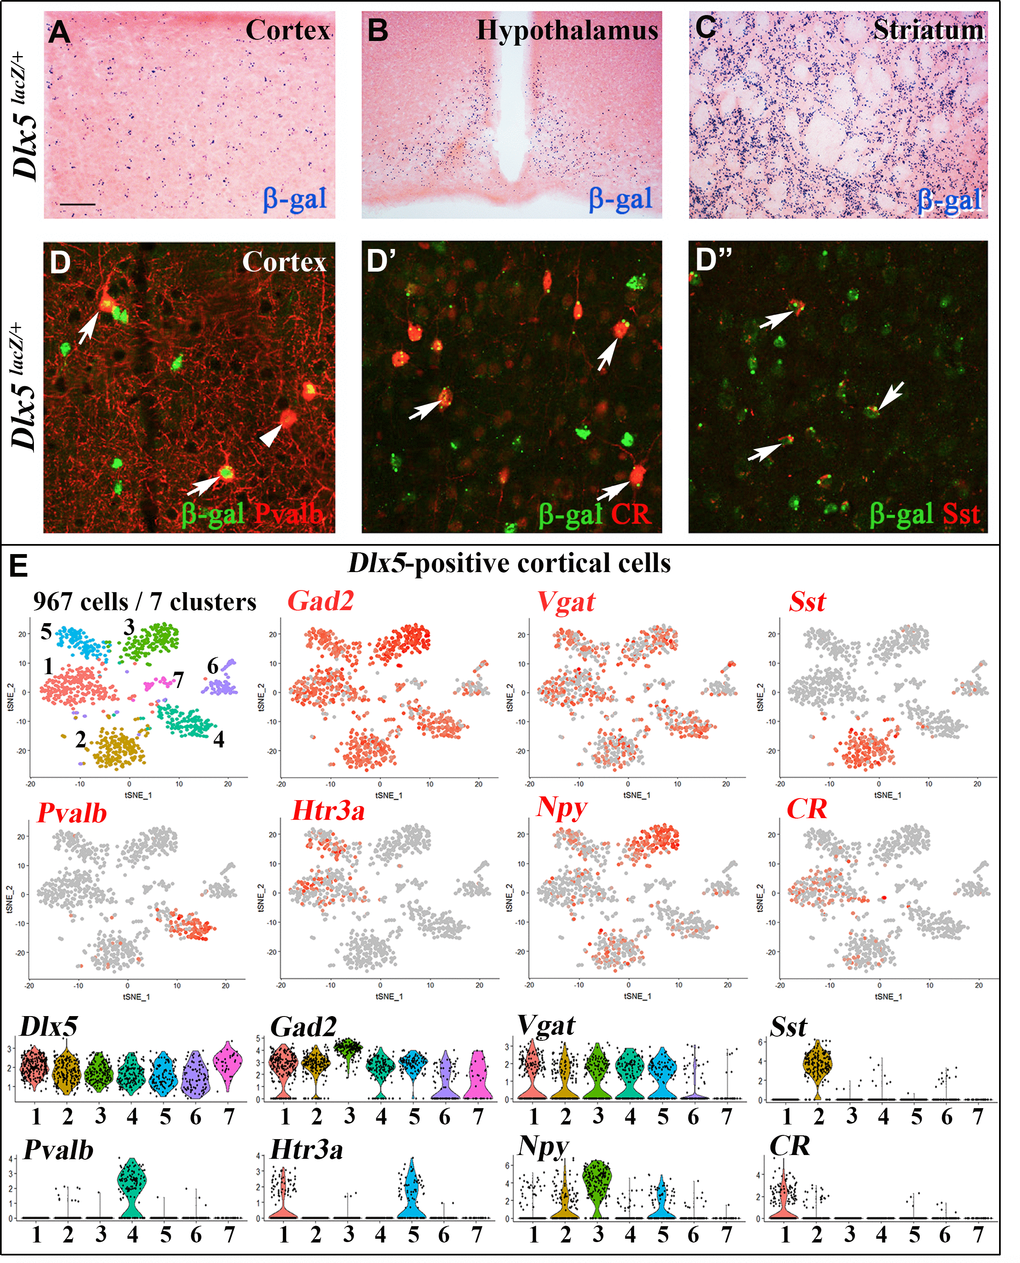
Figure 1. Expression of Dlx5 in adult brain. (A–C) Sections from adult brain of Dlx5lacZ/+ mice. β-D-galactosidase activity, visualized as dark blue dots, is evident in the cortex (A), hypothalamus (B) and striatum (C). (D–D’’) Adult brain somatosensory cortex from Dlx5lacZ/+ mice was double stained with anti-β-D-galactosidase antibodies (green) and antibodies against major GABAergic neuronal subclasses (Parvalbumin (Pvalb), Calretinin (CR) and Somatostatin (Sst)) (red). Arrows point to examples of double-stained neurons; arrowhead indicates a β-D-galactosidase-negative/Pvalb-positive neuron. Bar: 250 μm A-C; 25 μm D, D’’. (E) (Upper panels) t-distributed stochastic neighbor embedding (t-SNE) plots showing the relationship among 967 Dlx5-positive single cells isolated from the frontal cortex. The seven identified clusters are color-coded and expression of selected markers for different classes of cortical GABAergic neurons is presented (Gad2, Vgat, Sst, Pvalb, Htr3a, Npy, CR). All Dlx5-positive clusters are Gad2 and Vgat-positive, all major GABAergic subtypes include Dlx5-positive neurons. (Lower panels) Violin plots showing the normalized expression distribution of selected markers in the different Dlx5-positive clusters.
We choose to inactivate both Dlx5 and Dlx6 in GABAergic interneurons since these two closely related genes have often redundant functions [19, 20]. To inactivate Dlx5/6 genes in GABAergic interneurons we crossed Dlx5/6flox/flox mice, in which the homeodomain-encoding regions of both Dlx5 and Dlx6 are flanked by non-compatible lox sequences [35] with Vgatcre/+ mice in which an IRES-Cre recombinase cassette is inserted downstream of the stop codon of the endogenous Vgat (vesicular GABA transporter) gene. In Vgat-cre mice Cre-recombinase expression is observed in all GABAergic neurons, but not in other cell types [37]. We first generated Dlx5/6flox/+;VgatCre/+ mice (thereafter designated VgatΔDlx5-6/+) which were then crossed with Dlx5/6flox/flox mice, to obtain VgatΔDlx5-6 individuals (Dlx5/6flox/flox;VgatCre/+) (Figure 2A). VgatΔDlx5-6/+ and VgatΔDlx5-6 mice were viable and fertile. PCR analyses of cortical DNA confirmed that recombination had occurred in VgatΔDlx5-6/+ and VgatΔDlx5-6mice (Figure 2B). RT-PCR confirmed the absence of exon II in the vast majority of Dlx5 cortical transcripts (compare second and first lane of Figure 3B), and in all Dlx6 cortical transcripts of VgatΔDlx5-6mice (Figure 3A–3B).
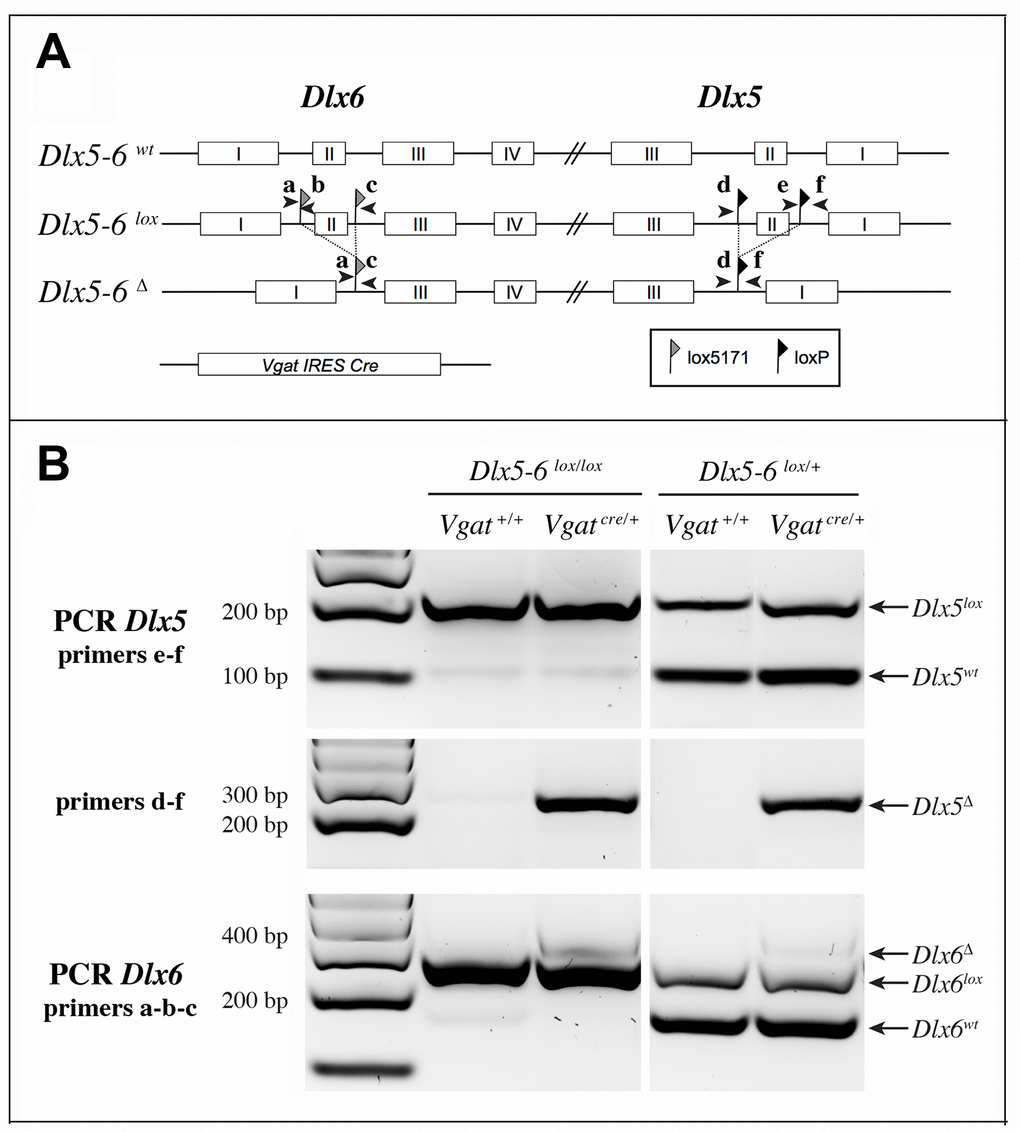
Figure 2. Strategy of Dlx5 and Dlx6 simultaneous invalidation and mouse genotyping. (A) Exons 2 of Dlx5 and Dlx6 were respectively framed with loxP and lox5171 sequences as described in [35]. In the presence of a Slc32a1-IRES-Cre(Vgat-Cre), exons II of Dlx5 and Dlx6 are deleted in GABAergic interneurons generating a Dlx5-6Δ allele. Arrowheads indicate the position and name (a to f) of the primers used for genotyping. (B) PCRs on cortical DNA extracts. Primers a, b, c and d, e, f were respectively utilized to reveal Dlx6 and Dlx5 recombination. The floxed and wild type Dlx5 alleles (primers e-f) were revealed in a separate PCR than that used to reveal the recombinant (Dlx5Δ) allele (primers d-f). Wild type, floxed and recombinant Dlx6 alleles were identified with a single PCR with primers a, b, c. In the presence of Cre recombinase, a band corresponding to the recombinant allele (Δ) can be detected for both Dlx5 (primers d-f) and Dlx6 (primers a, b, c) in VgatΔDlx5-6. In VgatΔDlx5-6/+ mice wild type and recombinant alleles are detected.
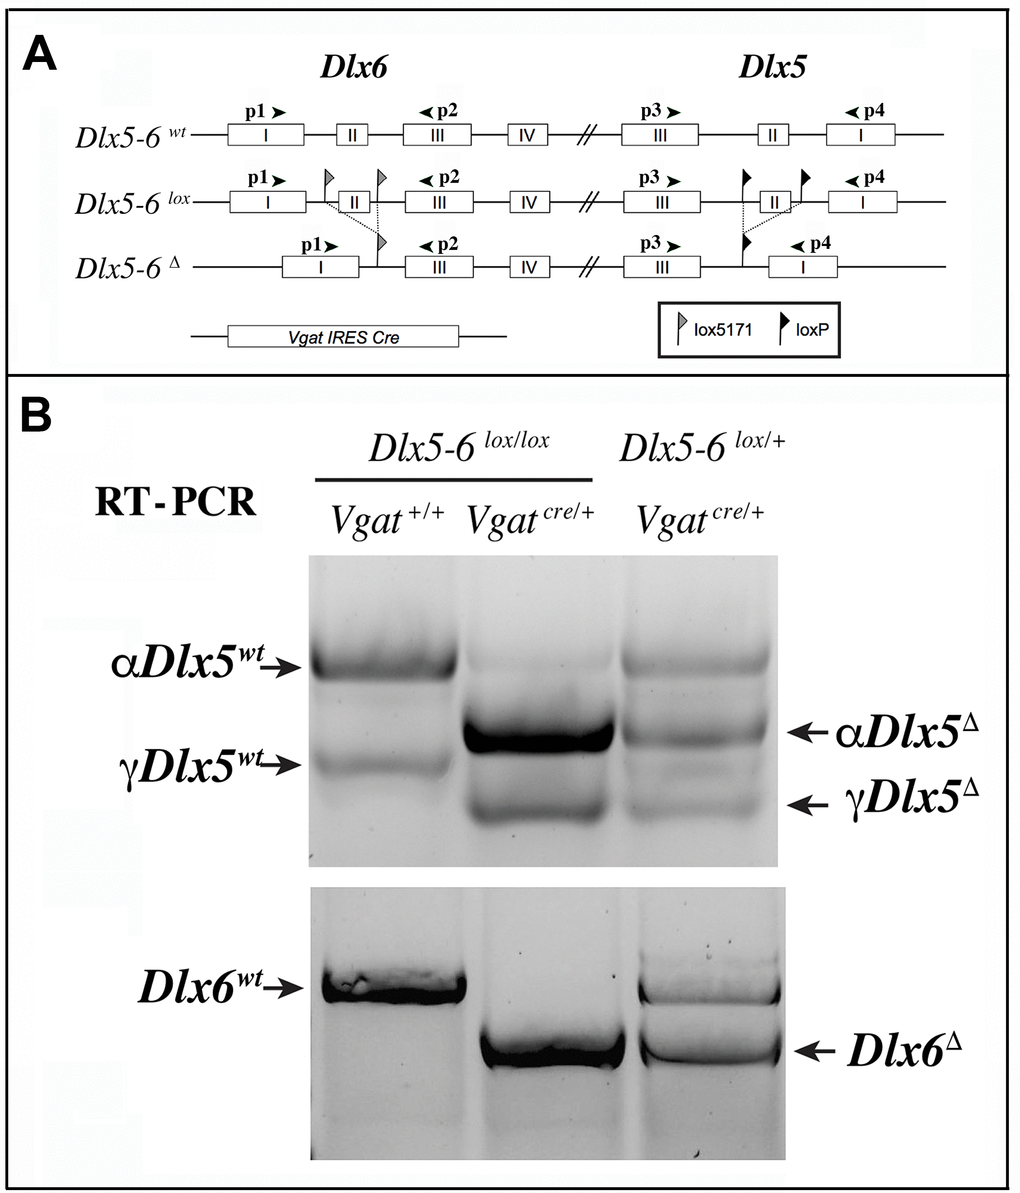
Figure 3. RT-PCR analysis of Dlx5 and Dlx6 expression in the cerebral cortex. (A) Primers p1 to p4 were used to analyze the presence of Dlx5 and Dlx6 transcripts in reverse-transcribed RNA extracts from adult cerebral cortex fragments. (B) Two known splice variants of Dlx5(αDlx5 and γDlx5, [58]) were amplified with primers p3 and p4. Deletion of exon II shifted both bands giving rise to αDlx5Δ and γDlx5Δ. A small fraction of Dlx5 transcripts, possibly corresponding to expression of this gene in non-GABAergic cells or a few non-cre expressing Vgat-positive cells, was not recombined. Dlx6 transcripts were amplified with primers p1 and p2 and did not show any splice variants.
Behavioral defects associated with Dlx5/6 inactivation in GABAergic neurons
To examine how Dlx5/6 inactivation in GABAergic neurons affects adult mouse behavior we scored the performance of heterozygous and homozygous mutant mice in five different tests: locomotor activity, open field, marble burying, nest building and socialization.
Open Field Test (OFT)
Mice were filmed while freely moving in a 72x72 cm square flat arena for 10 minutes; the path followed by the animals was tracked and analyzed (Figure 4A). VgatΔDlx5-6/+ and VgatΔDlx5-6 mice travelled respectively two or four times more the distance than their control littermates (Figure 4A, 4B).
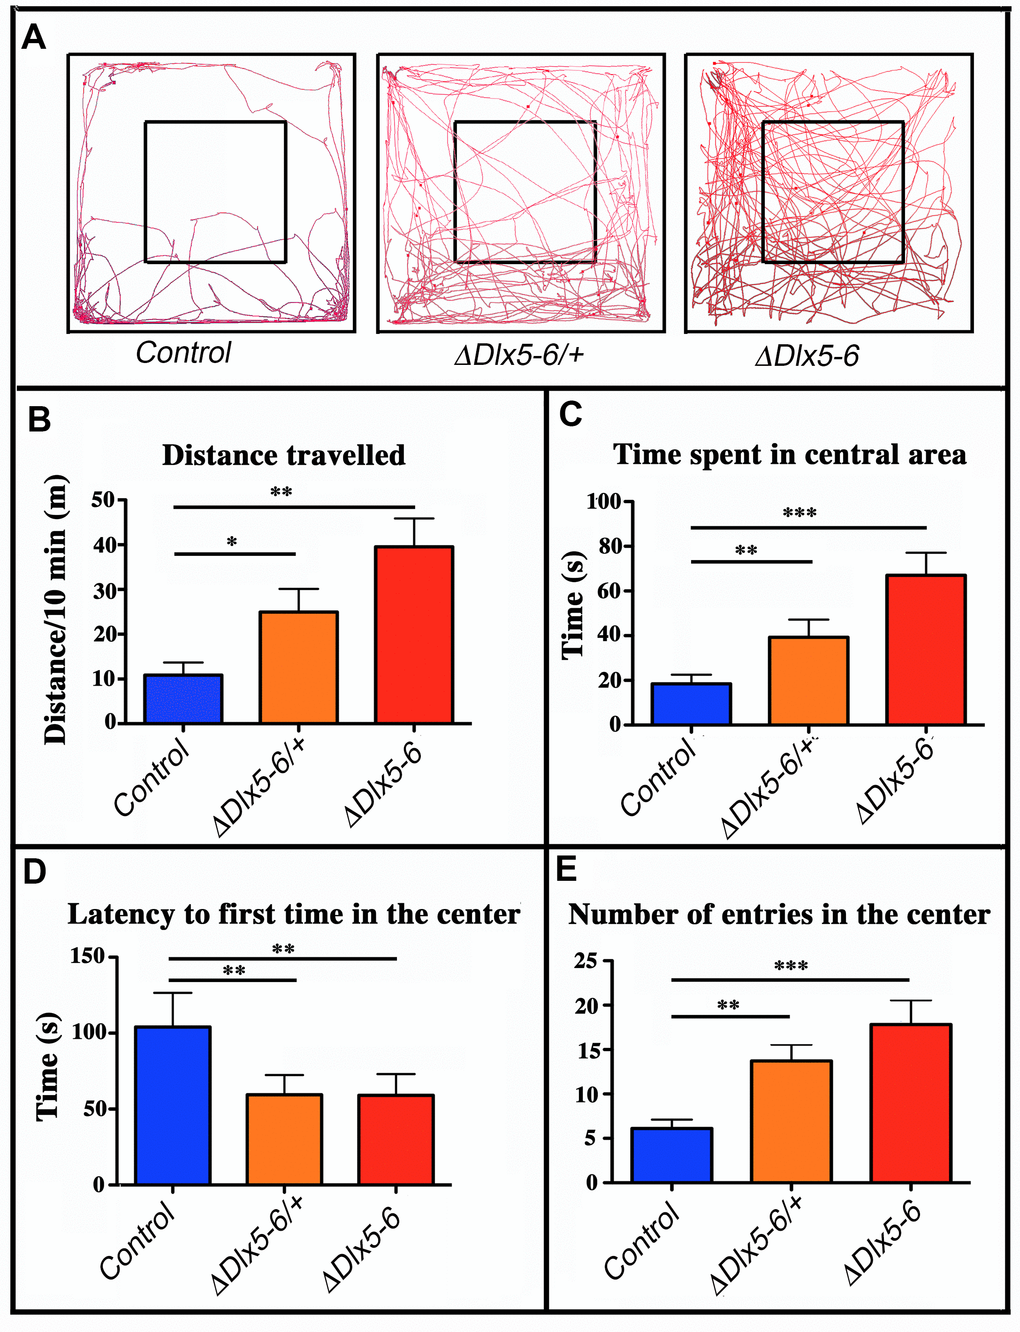
Figure 4. Behavioral response in an open field test. (A) Travel pathway (red) of illustrative examples of control, VgatΔDlx5-6/+ and VgatΔDlx5-6 mice (ΔDlx5-6/+ and ΔDlx5-6 respectively) filmed for 10 min in the open field test arena (72x72 cm larger square perimeter). The central region (36x36 cm) is indicated by the smaller square. VgatΔDlx5-6/+ and VgatΔDlx5-6 animals travelled a significantly longer distance than their control littermates (B) and spent more time in the center of the open field (C), where they entered more rapidly (D) and more frequently (E). Histograms bars indicate the mean±SEM; One way ANOVA, post hoc analysis by Tukey’s HSD (Controls: n = 45 and VgatΔDlx5-6/+: n = 38, VgatΔDlx5-6 : n=34): ***: p<0.001; **: p<0.01; *: p<0.05.
The time spent in the center of the open field was significantly increased in both VgatΔDlx5-6/+ and VgatΔDlx5-6 animals (Figure 4C). Both heterozygous and homozygous mice entered in the central area of the open field faster (50% reduction in latency) (Figure 4D) and more frequently (Figure 4E) than control littermates. Control mice spent more time in the corners of the open field than mutants (Figure 4A). The peak and mean velocity reached by VgatΔDlx5-6/+ and VgatΔDlx5-6 mice was 2 to 4 times higher than that of their control littermates (Figure 5A, 5B). Moreover, the acceleration of VgatΔDlx5-6 mice was up to six times higher than controls and three times higher than heterozygous mutants (Figure 5C). In the OFT no difference was observed between males and females. Globally, these results suggest that adult mutants present a reduction in anxiety-like behavior.
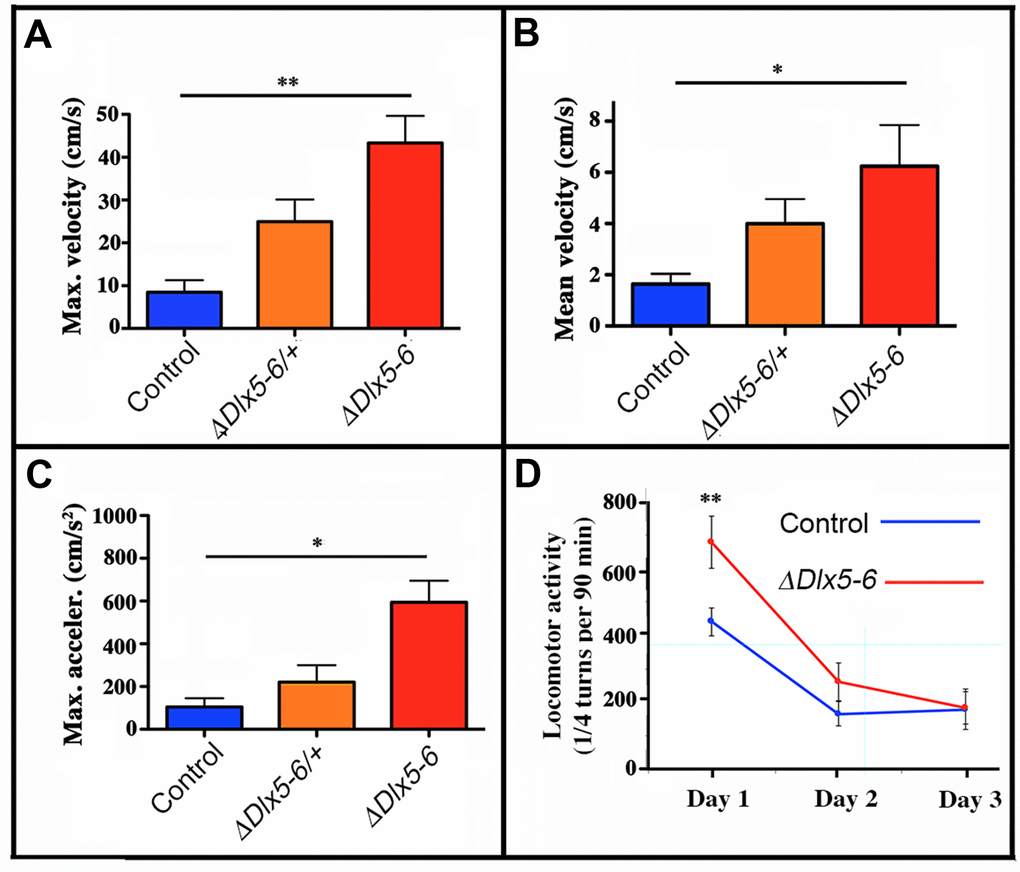
Figure 5. Mouse velocity and acceleration in an open field test. Maximal (A) and average (B) velocity and maximal acceleration (C) of mice in the open field test (see Figure 2). During the 10 minutes test the velocity and acceleration of mutant mice was significantly higher than that of controls. (D) Locomotor activity was measured on a 90 min period in a circular corridor for three consecutive days. Only the first day a significant difference was observed suggesting an increased response to novelty of mutant mice. One way (A, B, C) and repeated two way (D) ANOVA tests, Bonferroni post-hoc test p<0.01 were performed. Histograms bars indicate the mean±SEM. **: p<0.01; *: p<0.05.
Locomotor activity
Locomotor activity during a 90 min period was measured for control and VgatΔDlx5-6 mice for 3 consecutive days. Control mice displayed normal spontaneous locomotor response and habituation to a novel environment with a high locomotor activity on day 1 that then decreased and stabilized on days 2 and 3. In contrast, VgatΔDlx5-6 mice showed a significantly higher locomotor response on day 1 compared to controls; however on days 2 and 3 no significant difference was detected (Figure 5D). Altogether these results suggest that VgatΔDlx5-6 mice do not show a generalized hyperactivity, but are more reactive to novelty.
Marble burying test (MBT)
The consequences of Dlx5/6 inactivation in GABAergic neurons on stereotyped repetitive behavior were assessed through the Marble Burying Test (MBT) (Figure 6A).
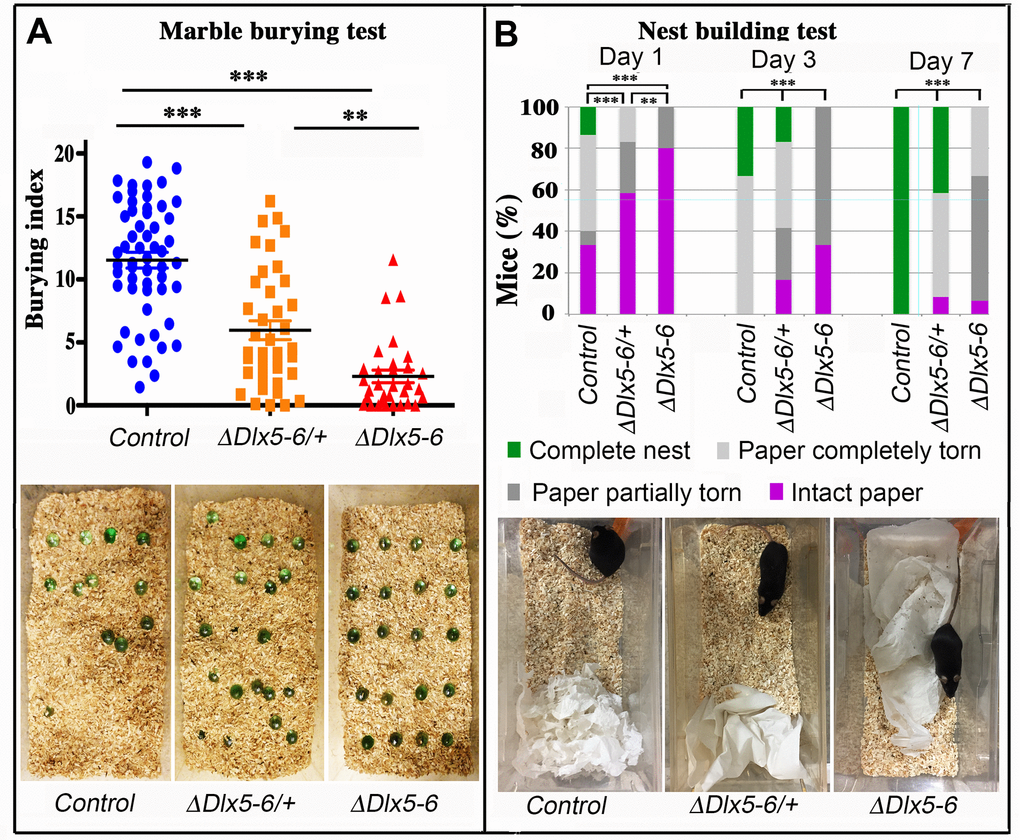
Figure 6. Behavioral response to marble burying and nest building tests. (A) The number of marbles buried by each mouse over a 10 min period (Burying index) is plotted to show the dispersion of the results and to highlight the proportion of mutant mice that did not bury even one marble during the test. Horizontal lines indicate median values. (Kruskal-Wallis test; Control: n = 55; VgatΔDlx5-6/+: n = 39; VgatΔDlx5-6: n=31). The lower panel presents representative examples of the MBT arena at the end of the test for the three genotypes. (B) The quality of nests built by control, VgatΔDlx5-6/+ and VgatΔDlx5-6 mice was evaluated each day over a seven days period. The quality of nest building was scored as: completed nest (green), completely torn paper (light grey), partially torn paper (dark grey) or intact paper (purple). The percentage of mice in each category is indicated at 1, 3 and 7 days. The lower panel presents representative examples of the nest-building arena at the end of the first 24 h of test for the three genotypes. At the end of the scoring period all control mice had completed nest building whereas none of the VgatΔDlx5-6 mice had done so (Pearson's chi-squared; Control: n = 15 and VgatΔDlx5-6/+ : n = 12, VgatΔDlx5-6 : n=15; ***: p<0.001; **: p<0.01).
During the 10 min test, both VgatΔDlx5-6/+ and VgatΔDlx5-6 animals buried a significantly lower number of marbles than control littermates (Figure 6A). Remarkably, 42% (13/31) of the VgatΔDlx5-6 animals did not bury or displace even one marble while only 7,7% (3/39) of the VgatΔDlx5-6/+ animals presented this extreme phenotype which was never observed in the control group. Mutant animals and control littermates moved similarly throughout the cage, however, mutant mice passed over the marbles without stopping to bury them with rapid movements of their hind limbs as did their control littermates.
Nest building test
Nest building is an important natural behavior occurring without intervention of the experimenter. We observed a statistically significant difference in the quality of constructed nest among control, VgatΔDlx5-6/+ and VgatΔDlx5-6 animals. The quality of the nests built by heterozygous and homozygous mutants was significantly lower than that of control mice (Figure 6B). The difference was already evident after one day (Figure 6B lower panels) and persisted for at least seven days when the observation was terminated. At the end of the test, none of the VgatΔDlx5-6 mice had built a high quality nest (Figure 3B), whereas all control mice had completed nest construction and only 40% VgatΔDlx5-6/+ mice had generated high quality nests (Figure 6B).
Sociability tests
The social behavior of VgatΔDlx5-6/+ and VgatΔDlx5-6 animals was evaluated in two different tests in open field. In the first test, sociability was measured by comparing the time spent in proximity of a prison occupied by an unfamiliar animal to the time spent near a similar empty prison. In this test all animals spent more time in proximity of the occupied prison, and no significant difference could be seen between control, VgatΔDlx5-6/+ and VgatΔDlx5-6 animals (Supplementary Figure 2). In the second test a control mouse was confronted in an open field to a control, a VgatΔDlx5-6/+ or a VgatΔDlx5-6 second individual. Their interactions were filmed and analyzed. No difference was found between genotypes (Supplementary Figure 3).
Metabolic consequences of Dlx5/6 inactivation in GABAergic neurons
Throughout their life, both male and female VgatΔDlx5-6 mice had a similar length, but presented a significantly lower body weight compared to control littermates (Figures 7, 8). In most age groups, heterozygous mutants presented a similar, but less pronounced weight reduction (Figure 7A, Figure 8). After 5 months of age both female (Figure 7A) and male (Figure 8C) VgatΔDlx5-6/+ and VgatΔDlx5-6 animals presented up to 25% body weight reduction compared to their normal littermates. Body mass reduction was already evident during growth (Figure 8A, 8B) and persisted in adult and aging animals (Figures 7A, 8C). At any age analyzed the nose-to-anus length of normal and mutant animals was not significantly different suggesting that the loss in body weight depended on reduce adiposity. No obvious difference was observed in the daily food intake of control, VgatΔDlx5-6/+ and VgatΔDlx5-6 animals.
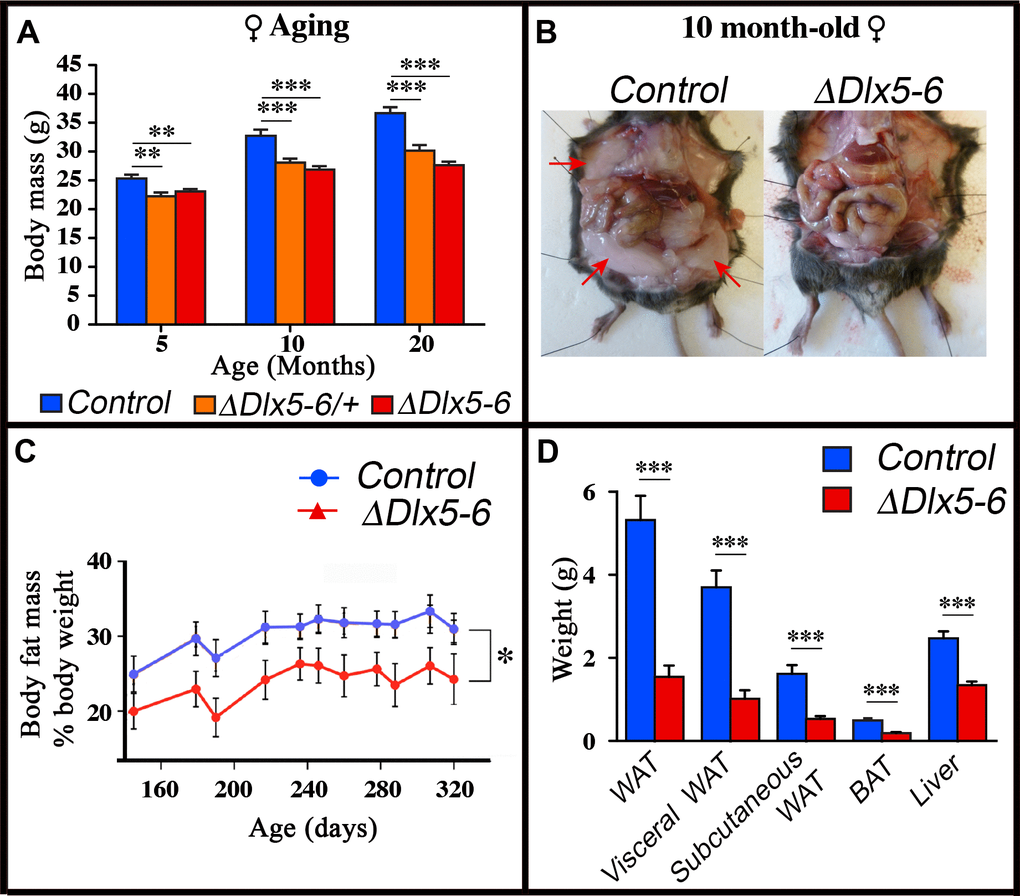
Figure 7. Reduced weight and adipose tissue in VgatΔDlx5-6/+ and VgatΔDlx5-6 mice. (A) The body weight of a cohorts of female control, VgatΔDlx5-6/+ and VgatΔDlx5-6 mice (n ≥ 8 per group) was measured during the first 20 months of aging. At all time points analyzed VgatΔDlx5-6/+ and VgatΔDlx5-6 mice (male (Supplementary Figure 7) and female) presented a highly significant weight reduction. (B–D) Gross anatomical inspection (B), MRI analysis (C) and dissected organ weight (D) confirmed a dramatic reduction of visceral and subcutaneous WAT and of BAT in VgatΔDlx5-6 mice (n=11 controls, n=7 VgatΔDlx5-6). Mann-Witney test; ***: p<0.001; **: p<0.01; *: p<0.05.
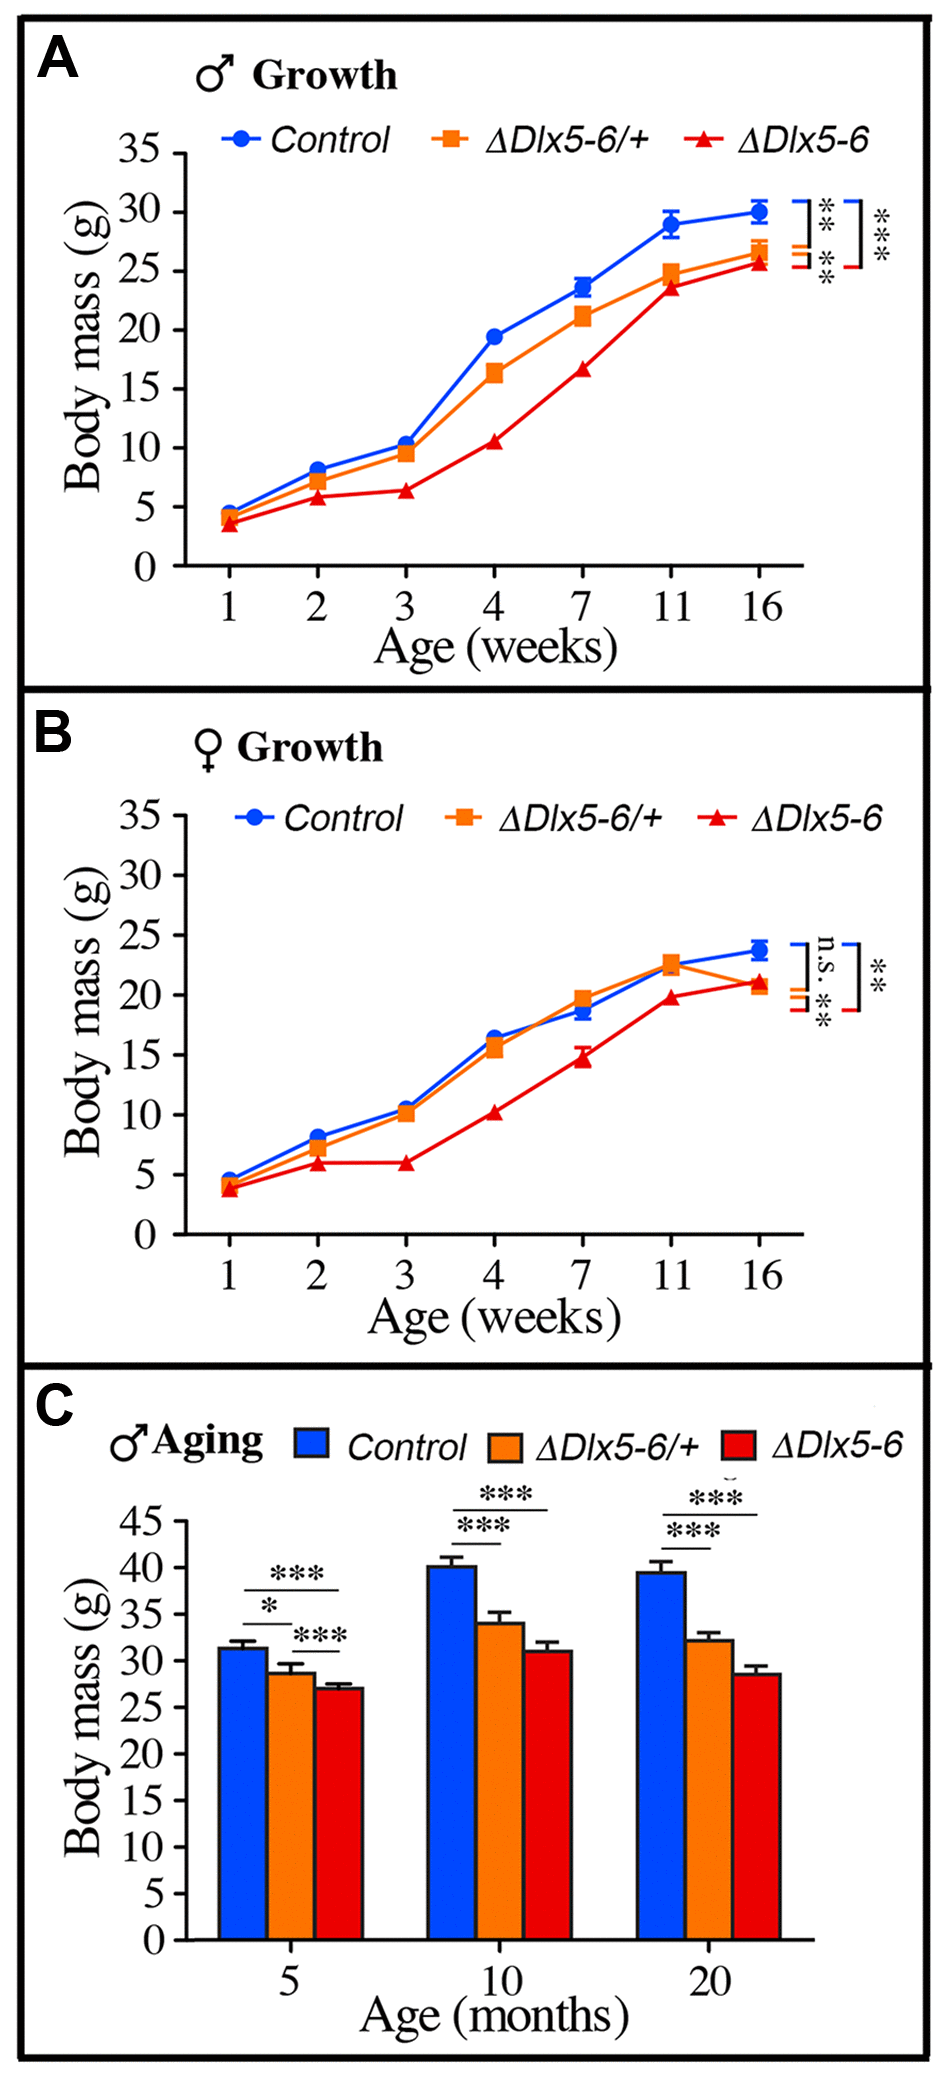
Figure 8. Weight measures during growth and aging. (A-B) The body weight of cohorts of male (A) and female (B) control, VgatΔDlx5-6/+ and VgatΔDlx5-6 mice was measured during the first 16 weeks of growth. At all time points, VgatΔDlx5-6 mice (male and female) displayed a significant weight reduction; VgatΔDlx5-6/+ males had also a significantly lower weight, while, during growth, until 11 weeks of age, the weight of female VgatΔDlx5-6/+was not significantly different than controls (B). (C) The body weight of a cohorts of male control, VgatΔDlx5-6/+ and VgatΔDlx5-6 mice (n ≥ 8 per group) was measured during the first 20 months of aging. At all time points analyzed VgatΔDlx5-6/+ and VgatΔDlx5-6 male mice presented a highly significant weight reduction.
Dissection of 10 months old VgatΔDlx5-6 mice (n=7) showed a dramatic reduction (Figure 7B–7D) of visceral (-73% w/w) and subcutaneous White Adipose Tissue (-67% w/w) (vWAT and scWAT) and of Brown Adipose Tissue (BAT) (-62% w/w). Body composition analysis using nuclear magnetic resonance imaging confirmed the reduction in the percentage of adipose tissue present in mutant animals (Figure 7C).
Extended lifespan and healthspan of VgatΔDlx5-6/+ and VgatΔDlx5-6 mice
Both VgatΔDlx5-6/+ and VgatΔDlx5-6 mice lived considerably longer than their control littermates. Heterozygous or homozygous inactivation of Dlx5/6 in GABAergic neurons resulted in prolonging by 33% the median survival of the animals (Figure 9A) (n=21 controls, 16 VgatΔDlx5-6/+ and 17 VgatΔDlx5-6). At 18 months, the aging mutant mice appeared in better health than their control littermates. Whereas control mice gained excessive weight at old age, VgatΔDlx5-6/+ and VgatΔDlx5-6 mice maintained a stable body mass. The external appearance (alopecia; coat conditions; loss of fur color; loss of whiskers) was quantified on two groups (n=12 each) of control and mutant animals at 2, 9 and 18 months of age in order to follow changes in this indicator of aging [38]. As shown in Figure 9B, the decline in coat condition of mutant mice was much slower than that observed in their control littermates.
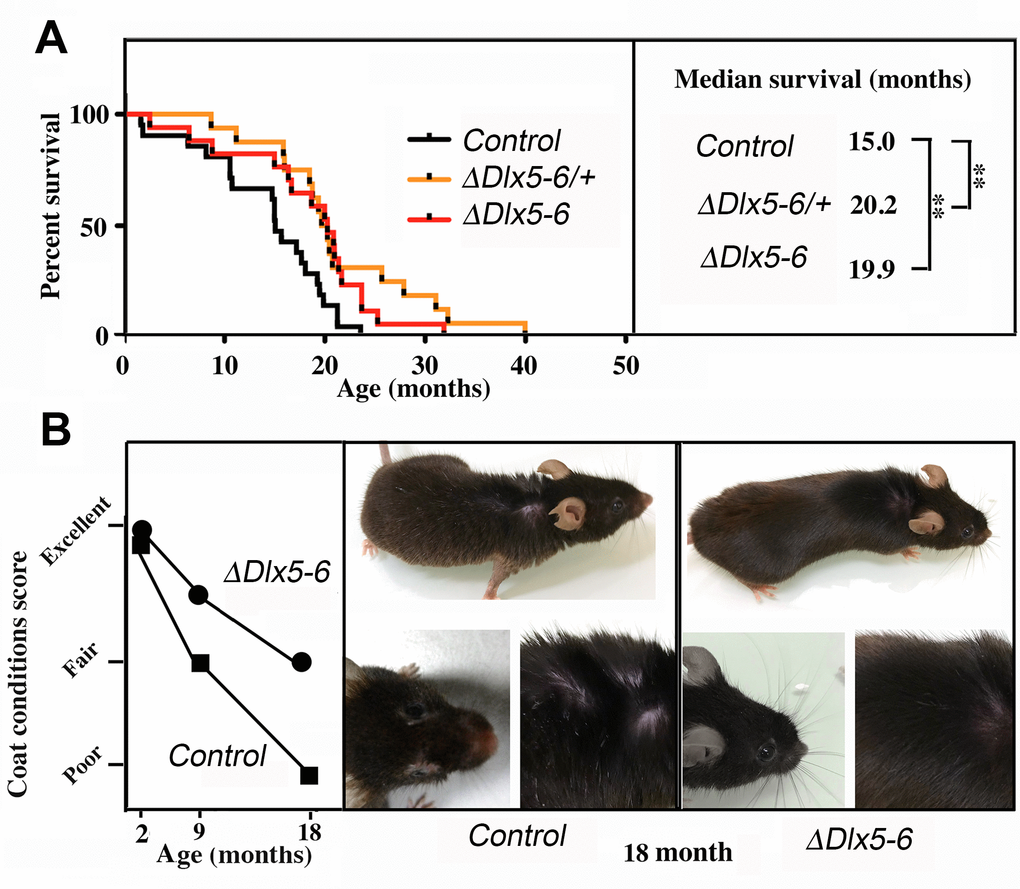
Figure 9. Extended lifespan and healthspan of VgatΔDlx5-6/+ and VgatΔDlx5-6 mice. (A) Kaplan-Meier survival plots. The median survival of VgatΔDlx5-6/+ and VgatΔDlx5-6 mice is 33% longer than that of their control littermates. (B) Scoring of coat conditions of aging control and VgatΔDlx5-6 mice. At 2, 9 and 18mo the external appearance (alopecia; coat conditions; loss of fur colour; loss of whiskers) was quantified on two groups (n=12 each) of mutant animals and normal controls [38]. Right panels show the coat conditions of two representative control and VgatΔDlx5-6 18mo old animals. Log rank test was performed, **: p<0.01.
These observations, together with the high level of alertness, motility and reduced adiposity of VgatΔDlx5-6/+ and VgatΔDlx5-6 mice suggest that inactivation of Dlx5/6 in GABAergic neurons results in a prolonged and healthier lifespan.
Discussion
The main finding of this study is that transcriptional modifications limited to GABAergic neurons are sufficient to prolong healthspan and lifespan. Indeed, we have shown that inactivation of the two transcription factors Dlx5 and Dlx6 in mouse GABAergic interneurons produces behavioral and metabolic changes accompanied by a prolonged median survival in good health. VgatΔDlx5-6 mice are characterized by a reduction in anxiety-like and compulsive repetitive-like activities, by a remarkable decrease in white and brown adipose tissues and by a 33% median lifespan increase (Figure 10). By scRNA-seq analysis and histological analyses, we show that all adult cortical GABAergic neuronal subtypes express Dlx5 and Dlx6. Similar results were obtained analyzing striatum and hypothalamus published datasets [7, 36]. All these regions are involved directly or indirectly in the central control of feeding behavior.
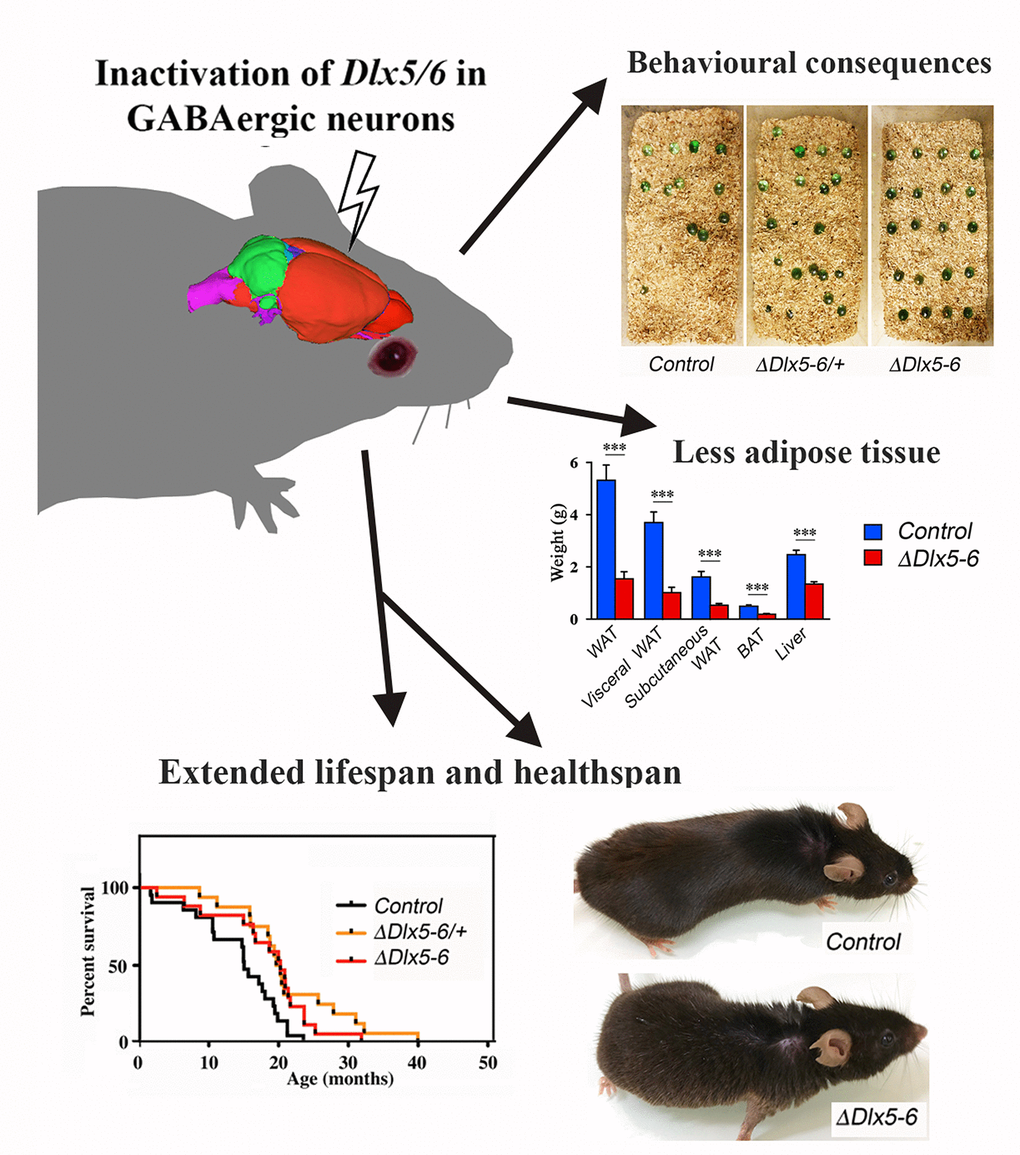
Figure 10. Summary diagram.
The molecular and cellular origin of the phenotypes displayed by VgatΔDlx5-6 animals is yet to be deciphered. Interestingly, during development, Dlx5 expression is sufficient to induce both GABA synthetizing enzymes, Gad65 and Gad67 [15, 39]. Furthermore, ectopic expression of Dlx5 in the cerebral cortex can induce Gad65 expression [16]. In humans, alterations of GAD65/67 have been consistently implicated in cognitive deficits including bipolar disorders and schizophrenia [40] and linkage analysis has identified GAD65 as one of the few genes associated to obesity [41].
Metabolic status is one of the major determinants of healthy aging and life expectancy [42]. In turn, metabolism is controlled by the activity of neuronal networks capable to integrate hormonal signals from peripheral organs and cognitive inputs from the central nervous system [43]. Therefore, specific brain circuits can integrate sensory, cognitive and physiological inputs and affect the psychophysiological status of the body determining healthy aging trajectories. Our findings support the notion that Dlx5/6-dependent regulations in GABAergic interneurons play an important role in the central regulation of behavior and metabolism and ultimately of healthspan and lifespan.
The intimal link between cognitive, rewarding, hypothalamic and peripheral metabolic control systems is most probably at the origin of the comorbidity observed between metabolic syndrome and mental health disorders [44]. Individuals with schizophrenia, autism spectrum disorder and other psychiatric conditions have a higher prevalence of metabolic syndrome compared to the general population [45]. Reciprocally, obesity impairs cognition and produces atrophy of brain regions associated with learning and memory deficits. Metabolic and psychiatric disorders are both associated with an increased risk of all-cause mortality [46]. The pathophysiological, molecular and cellular mechanisms linking metabolic and psychiatric disorders to shorter healthspan are still poorly understood. A genetic component is suggested by the fact that several genetic conditions, such as Prader-Willi syndrome (PWS), present at the same time metabolic and cognitive impairment [47] and reduced life expectancy. Interestingly, it has been shown that Dlx5 promotes GABAergic differentiation participating to a protein complex which includes also MAGE-D1 and Necdin (NDN) [22] one of the genes affected in PWS.
A remarkable association between DLX5/6 and lifespan comes from the observation that these genes are progressively and linearly hypermethylated during human aging [27, 28, 48] and during cellular senescence [29]. Furthermore the methylation state of individual CpG sites of both DLX5 and DLX6 has been shown to increase in adipose tissue and correlate with age and BMI of both female and male cohorts [49].
In the adult, Dlx5 and Dlx6 are not only important in the brain, but play also a central role in determining male [50] and female reproduction [32]. Our finding that Dlx5/6 are also important in determining healthspan and lifespan lead us to suggest that they might play an important role in establishing a fecundity/lifespan tradeoff during evolution. In this respect it is important to note that the methylation level of DLX5/6 increases in response to aging [27], metabolism [49] and life exposures [51] suggesting that these genes might be integrators of lifespan determinants.
Materials and Methods
Animals
Procedures involving animals were conducted in accordance with European Community (Council Directive 86/609) and French Agriculture Ministry directives (Council Directive 87–848, permissions 00782 to GL). The project was reviewed and approved by the “Cuvier” ethical committee of the Muséum National d’Histoire Naturelle (approval n° 68-028r1) validated by the French Ministry of Agriculture.
Mice were housed in light, temperature (21°C) and humidity (50–60% relative humidity) controlled conditions. Food and water were available ad libitum. Mice were individually identified by microchip implanted 3 weeks postnatal. Litter sizes and genotypes were kept in record. WT animals were from Charles River, France. Dlx5/6flox/floxmice [35] were backcrossed and bred on a mixed C57BL6/N X DBA/2N genetic background.
Slc32a1tm2(cre)Lowl knock-in mice (here referred as Vgatcre/+ mice) were purchased from Jackson Laboratories through Charles River, France. To obtain the double conditional mutant VgatΔDlx5-6/+ and VgatΔDlx5-6 in which the DNA-binding regions of both Dlx5 and Dlx6 are deleted by GABAergic-specific cre-recombinase, we crossed Vgatcre/+;Dlx5/6flox/+ males with Dlx5/6flox/flox females (Figure 2A). Dlx5lacZ mice [18] were also backcrossed and bred on a mixed C57BL6/N X DBA/2N genetic background.
Genotyping
For genotyping, DNA was extracted from mice tails using a KAPA express extraction kit (Kapa Biosystems, Sigma, France). Control, VgatΔDlx5-6/+ and VgatΔDlx5-6mice were genotyped by PCR using allele-specific primers using TAKARA Ex Taq (Takara).
To identify the Dlx5flox and Dlx5Δ alleles the following three primers were used:
d5′-TTCCATCCCTAAAGCGAAGAACTTG-3′
e5′-CCTCCCAGAAATACCCCTTCTCTTG-3′
f5′ -GTCCCATCCTCAGATCAC -3′
Wild-type, Dlx5flox and Dlx5Δ alleles give rise respectively to 106 bp, 216 bp and 244 bp PCR products.
To identify the Dlx6flox and Dlx6Δ alleles the following three primers were used:
a5′-CTTTAGGCGTTGGGAAAAGCCAGG-3′
b5′-GCATTATGATAGTGGATCGAATCTAG -3′
c5′-CTGGTCTCAGCTCATAAGTTTCCTTC-3′
Wild-type, Dlx6flox and Dlx6Δ alleles give rise respectively to 165 bp, 222 bp and 345 bp PCR products.
RT-PCR analysis
Total RNA was isolated from cortical fragments of control, VgatΔDlx5-6/+ and VgatΔDlx5-6 mice using an RNeasy minikit (Qiagen) according the manufacturer instructions. On-column deoxyribonuclease (Qiagen) digestion was incorporated into an RNA isolation procedure to remove potential genomic DNA contamination. RNA concentration and the ratio of the absorbance at 260 and 280 nm were measured using a NanoDrop 2000 spectrophotometer (Thermo Scientific). Reverse transcription was carried out using 600 or 200 ng total RNA and Superscript III (Invitrogen) or Primscript (Ozyme) reverse transcriptase to obtain cDNA.
Dlx5 and Dlx6 transcripts were analyzed using the following primers (see Supplementary Figure 4):
p4 GTCCCAAGCATCCGATCCG
p3 CAGGTGGGAATTGATTGAGCTG
p1 ACATTACCCTCTGCACTGCTTG
p2 ATGTAGCTGTTGGGAGGCATAC
Histological analysis
Mice were fixed by transcardiac perfusion with 4% paraformaldehyde and brains were post-fixed by overnight immersion in 4% paraformaldehyde at 4°C. Samples were cryoprotected in 30% sucrose and frozen. Cryoprotected brains were embedded in OCT (Leica, France) and 60-μm-thick free-floating cryostat sections were prepared.
For lacZ expression analysis, adult brains were fixed by perfusion with 4% PFA with no postfixation. X-gal staining was performed as described [18]. Immunohistochemistry on tissue sections was performed on free-floating sections (60 μm) of adult Dlx5lacZ/+ brains, incubated overnight at 4°C with a chicken anti β-D-galactosidase antibody (1:2000; Aves labs BGL-1040) combined with either mouse anti PV (1:2000, Sigma P3088), rabbit anti Calretinin (1:1000, Millipore AB5054) or rat anti Somatostatin (1:1000, Millipore MAB354). Sections were then incubated for 2 hours at room temperature in the corresponding secondary fluorescent antibodies (1:300; Jackson Immunoresearch). Pictures were acquired using a Leica SP5 confocal microscope.
Single-cell RNA sequencing clustering
Single-cell RNA sequencing (scRNA-seq) analysis was performed on publicly available datasets where individual cells from adult frontal cortex were profiled using Drop-seq technology (GEO accession number GSE116470) [36]. Digital gene expression (DGE) matrices from 21 sequencing pools including a total of 190,972 cells were compiled before analysis. The R package Seurat [52] was used for cell clustering following a standard workflow; a Seurat Object was created using the parameters described here. To ensure quality of data, we excluded cells with fewer than 500 sequenced transcripts (nGene), outliers cells with more than 6000 sequenced transcripts and cells with high mitochondrial percentage (>15%). This filtering step led to a total of 130,845 high quality cells from adult frontal cortex for further analysis. The expression matrix was then normalized by global-scaling normalization method (LogNormalize, scale factor of 10,000). We then identified the different cell type identities in the dataset by selecting highly variable genes using the variance/mean ratio estimation (FindVariableGenes method). We selected the top 1,000 highly variable genes and scaled with percentage of mitochondrial genes regressed out to avoid this parameter to influence the clustering for downstream dimension reduction steps. Linear reduction was performed on the scaled matrix using a principal component analysis (PCA) method. We selected 60 principal components for further non-linear reduction using the t-distributed stochastic neighbor embedding algorithm (t-SNE) to project the data on a 2-dimension space. A total of 42 clusters across the global frontal cortex were identified using the shared nearest neighbor (SNN) modularity optimization-based cluster algorithm embedded in the Seurat FindClusters() function, setting the resolution parameter at 1.
To further characterize the Dlx5-positive population, we subsetted the dataset to the Dlx5-expressing cells only using the Seurat SubsetData() function. The Dlx5-positive subset was subjected to another round of variable gene selection using the Seurat FindVariableGenes() function (with mean low and high cutoff values set at 0.0125 and 3 respectively, and dispersion cutoff value set at 0.5). The expression matrix was scaled with nUMI and percentage of mitochondrial genes, PCA was performed with 20 principal components and t-SNE reduction was done setting the resolution parameter at 1.2. Following this procedure, 7 clusters were identified among 967 Dlx5-positive cells.
Behavioral tests
Mice were taken to the test room 30 min before the test. Behavioral procedures were conducted between 10 a.m. and 4 p.m. in a dim and quiet room. Observers were blind to the experimental design.
Open field test (OFT)
We used the classical OFT to measure motor and anxiety-like behaviors of rodents in a novel environment [53, 54]. The equipment consisted of a close square arena (72 × 72 cm). The computer defined the grid lines dividing the box floor into 16 equal-sized squares, with the central four squares regarded as the center. Each mouse aged of less than one year, was gently placed at one corner of the arena facing the wall and video taped for 10 min. All animals were tracked and recorded with a digital camera and analyzed by Ethovision system (Noldus). Delay to enter in the center, time in the center, number of entries into the center, total distance covered, average and peak velocity and acceleration were analyzed. Between each test, the equipment was cleaned and disinfected.
Marble burying test (MBT)
The marble burying test (MBT) [55] was employed to measure anxiety- and compulsive-like behaviors. A clear Plexiglas box (36,5 cm long × 20,7 cm wide × 14 cm high) was filled to a depth of 3 cm with standard wood shavings. Twenty glass marbles were placed on the surface of the shavings. Mice aged of less than 6 months were individually placed in the center of the box; the test session was 10 min. At the end of the session, a picture of the marbles was taken, and the marbles buried index was counted with the Fiji (ImageJ) image-processing program.
Nest building test
Each mouse aged of less than one year, was housed in a single cage before testing. During the test, a paper towel (30 cm × 21,5 cm) was placed in the cage and left for one week. The quality of the nest was scored each following day into four categories: complete nest built, paper completely torn, paper partially torn and no interaction with intact paper. Nests were scored at 10h a.m.
Sociability tests
Social interaction test
Mice (aged 5-6 months) were introduced for 150 s in an open-field (40cm x 40cm x 25) containing an empty perforated polycarbonate box (« no target » condition). Immediately after this, mice were rapidly removed and an unfamiliar male mouse was placed in the box (« target » condition) and mice were re-exposed to the open-field for another 150 s. The time spent in the interaction zone surrounding the polycarbonate box while empty or with an unfamiliar mouse was recorded and used as an index of social interaction.
Open field social behavior
After one hour of habituation a female control mouse was placed in a test cage (50x50x30 cm) together with either a second control, a VgatΔDlx5-/+ or a VgatΔDlx5-6 female mouse. Mice were then filmed for 10 min. Social behavior was measured using real-time approach that couples computer vision, machine learning and Triggered-RFID identification to track and monitor animals [56].
Locomotor activity
Locomotor activity of the mice (aged 2-5 months) was measured for 90 min for 3 consecutive days as described [57]. Mice were introduced in circular chambers (4.5-cm width, 17-cm external diameter) crossed by four infrared captors (1.5 cm above the base) placed at every 90° (Imetronic, Bordeaux, France). The locomotor activity was counted when animals interrupted two successive beams and thus had travelled a quarter of the circular corridor and was expressed as ¼ turns per 90 min.
Scoring of coat conditions
Groups of mice (n=12 each) were individually photographed and observed at different ages. The parameters measured were: A) alopecia level scored into three grades: score 1: alopecia on all body or at least two zones; score 0.5: alopecia on one body zone; and 0: no alopecia observed; B) loss of fur color also scored into three grades: score 1: loss of fur color on all body or at least two zones; score 0.5: loss of fur color on one body zone; and 0: no loss of fur color observed; C) loss of whiskers scored as follows: score 1: complete loss of whiskers; score 0.5: partial loss of whiskers; and 0: no loss of whiskers observed, and finally; D) coat conditions scored as follows: 1: ungroomed, ruffled, non-shiny appearance; 0,5: average appearance; 0: smooth, shiny coat. The global scoring of coat condition was performed as described [38].
Statistical analyses
The Pearson's chi-squared, ANOVA and Kruskal-Wallis test were conducted using Prism (Graphpad Software, La Jolla, CA, USA) to calculate the differences between groups.
All values are expressed as means ± SEM of combined data from replicate experiments. Values of P < 0.05 were considered statistically significant.
Supplementary Materials
Author Contributions
C.d.L. performed experiments, analyzed data, prepared figures, contributed to the text. E.H. performed single cell data analysis. G.A. performed experiments. A.F. performed experiments. R.H. performed body composition analysis. C.V. performed social interaction tests. F.d.C. performed social interaction tests. C.O-M. designed social interaction tests. S.P. performed social interaction test. F.T. provided experimental support, results evaluation and data analysis. E.E. performed social behavior tests. T.B. provided experimental support, results evaluation and data analysis. S.L. provided experimental support, results evaluation and data analysis. G.L. coordinated the work, analyzed data, wrote the text, prepared figures, and took histological images. N.N.-N. performed and coordinated the experimental work, wrote the text.
Acknowledgments
A particular thank goes to the team in charge of mouse animal care and in particular Stéphane Sosinsky and Fabien Uridat and to Pr. Amaury de Luze in charge of the “Cuvier” ethical committee. We thank Rym Aouci, Mey El Soudany, Zakaria Maakoul, Marianne Pungartnik, Guillaume Robert, Marjorie Sabourin, and Benjamin Vanhoutte for experimental support. We thank Aicha Bennana and Lanto Courcelaud for administrative assistance. We also thank Sébastien Mella for constructive discussion about scRNA-seq analysis.
Conflicts of Interest
The authors of this manuscript have no conflicts of interests to declare.
Funding
This research was partially supported by the EU Consortium HUMAN (EU-FP7-HEALTH-602757) to G.L. and by the ANR grants TARGETBONE (ANR-17-CE14-0024) to GL and METACOGNITION (ANR-17-CE37-0007) to GL, S.L., F.T and “Cognitio”, an ATM grant to NN-N, CdL is supported by a grant of the French Ministry of Research.
References
- 1. Lim L, Mi D, Llorca A, Marín O. Development and Functional Diversification of Cortical Interneurons. Neuron. 2018; 100:294–313. https://doi.org/10.1016/j.neuron.2018.10.009 [PubMed]
- 2. Zhang Z, Gadotti VM, Chen L, Souza IA, Stemkowski PL, Zamponi GW. Role of Prelimbic GABAergic Circuits in Sensory and Emotional Aspects of Neuropathic Pain. Cell Rep. 2015; 12:752–59. https://doi.org/10.1016/j.celrep.2015.07.001 [PubMed]
- 3. Suyama S, Yada T. New insight into GABAergic neurons in the hypothalamic feeding regulation. J Physiol Sci. 2018; 68:717–22. https://doi.org/10.1007/s12576-018-0622-8 [PubMed]
- 4. Tremblay R, Lee S, Rudy B. GABAergic Interneurons in the Neocortex: From Cellular Properties to Circuits. Neuron. 2016; 91:260–92. https://doi.org/10.1016/j.neuron.2016.06.033 [PubMed]
- 5. Klausberger T, Somogyi P. Neuronal diversity and temporal dynamics: the unity of hippocampal circuit operations. Science. 2008; 321:53–57. https://doi.org/10.1126/science.1149381 [PubMed]
- 6. Tasic B, Yao Z, Graybuck LT, Smith KA, Nguyen TN, Bertagnolli D, Goldy J, Garren E, Economo MN, Viswanathan S, Penn O, Bakken T, Menon V, et al. Shared and distinct transcriptomic cell types across neocortical areas. Nature. 2018; 563:72–78. https://doi.org/10.1038/s41586-018-0654-5 [PubMed]
- 7. Chen R, Wu X, Jiang L, Zhang Y. Single-Cell RNA-Seq Reveals Hypothalamic Cell Diversity. Cell Rep. 2017; 18:3227–41. https://doi.org/10.1016/j.celrep.2017.03.004 [PubMed]
- 8. Laclef C, Métin C. Conserved rules in embryonic development of cortical interneurons. Semin Cell Dev Biol. 2018; 76:86–100. https://doi.org/10.1016/j.semcdb.2017.09.017 [PubMed]
- 9. Merlo GR, Zerega B, Paleari L, Trombino S, Mantero S, Levi G. Multiple functions of Dlx genes. Int J Dev Biol. 2000; 44:619–26. [PubMed]
- 10. Panganiban G, Rubenstein JL. Developmental functions of the Distal-less/Dlx homeobox genes. Development. 2002; 129:4371–86. [PubMed]
- 11. Simeone A, Acampora D, Pannese M, D’Esposito M, Stornaiuolo A, Gulisano M, Mallamaci A, Kastury K, Druck T, Huebner K. Cloning and characterization of two members of the vertebrate Dlx gene family. Proc Natl Acad Sci USA. 1994; 91:2250–54. https://doi.org/10.1073/pnas.91.6.2250 [PubMed]
- 12. Porteus MH, Bulfone A, Ciaranello RD, Rubenstein JL. Isolation and characterization of a novel cDNA clone encoding a homeodomain that is developmentally regulated in the ventral forebrain. Neuron. 1991; 7:221–29. https://doi.org/10.1016/0896-6273(91)90260-7 [PubMed]
- 13. Yang L, Zhang H, Hu G, Wang H, Abate-Shen C, Shen MM. An early phase of embryonic Dlx5 expression defines the rostral boundary of the neural plate. J Neurosci. 1998; 18:8322–30. https://doi.org/10.1523/JNEUROSCI.18-20-08322.1998 [PubMed]
- 14. Eisenstat DD, Liu JK, Mione M, Zhong W, Yu G, Anderson SA, Ghattas I, Puelles L, Rubenstein JL. DLX-1, DLX-2, and DLX-5 expression define distinct stages of basal forebrain differentiation. J Comp Neurol. 1999; 414:217–37. https://doi.org/10.1002/(SICI)1096-9861(19991115)414:2<217::AID-CNE6>3.0.CO;2-I [PubMed]
- 15. Levi G, Puche AC, Mantero S, Barbieri O, Trombino S, Paleari L, Egeo A, Merlo GR. The Dlx5 homeodomain gene is essential for olfactory development and connectivity in the mouse. Mol Cell Neurosci. 2003; 22:530–43. https://doi.org/10.1016/S1044-7431(02)00041-6 [PubMed]
- 16. Stühmer T, Puelles L, Ekker M, Rubenstein JL. Expression from a Dlx gene enhancer marks adult mouse cortical GABAergic neurons. Cereb Cortex. 2002; 12:75–85. https://doi.org/10.1093/cercor/12.1.75 [PubMed]
- 17. Wang Y, Dye CA, Sohal V, Long JE, Estrada RC, Roztocil T, Lufkin T, Deisseroth K, Baraban SC, Rubenstein JL. Dlx5 and Dlx6 regulate the development of parvalbumin-expressing cortical interneurons. J Neurosci. 2010; 30:5334–45. https://doi.org/10.1523/JNEUROSCI.5963-09.2010 [PubMed]
- 18. Acampora D, Merlo GR, Paleari L, Zerega B, Postiglione MP, Mantero S, Bober E, Barbieri O, Simeone A, Levi G. Craniofacial, vestibular and bone defects in mice lacking the Distal-less-related gene Dlx5. Development. 1999; 126:3795–809. [PubMed]
- 19. Depew MJ, Lufkin T, Rubenstein JL. Specification of jaw subdivisions by Dlx genes. Science. 2002; 298:381–85. https://doi.org/10.1126/science.1075703 [PubMed]
- 20. Beverdam A, Merlo GR, Paleari L, Mantero S, Genova F, Barbieri O, Janvier P, Levi G. Jaw transformation with gain of symmetry after Dlx5/Dlx6 inactivation: mirror of the past? Genesis. 2002; 34:221–27. https://doi.org/10.1002/gene.10156 [PubMed]
- 21. Depew MJ, Liu JK, Long JE, Presley R, Meneses JJ, Pedersen RA, Rubenstein JL. Dlx5 regulates regional development of the branchial arches and sensory capsules. Development. 1999; 126:3831–46. [PubMed]
- 22. Kuwajima T, Nishimura I, Yoshikawa K. Necdin promotes GABAergic neuron differentiation in cooperation with Dlx homeodomain proteins. J Neurosci. 2006; 26:5383–92. https://doi.org/10.1523/JNEUROSCI.1262-06.2006 [PubMed]
- 23. MacDonald HR, Wevrick R. The necdin gene is deleted in Prader-Willi syndrome and is imprinted in human and mouse. Hum Mol Genet. 1997; 6:1873–78. https://doi.org/10.1093/hmg/6.11.1873 [PubMed]
- 24. Sinnema M, Schrander-Stumpel CT, Maaskant MA, Boer H, Curfs LM. Aging in Prader-Willi syndrome: twelve persons over the age of 50 years. Am J Med Genet A. 2012; 158A:1326–36. https://doi.org/10.1002/ajmg.a.35333 [PubMed]
- 25. Okita C, Meguro M, Hoshiya H, Haruta M, Sakamoto YK, Oshimura M. A new imprinted cluster on the human chromosome 7q21-q31, identified by human-mouse monochromosomal hybrids. Genomics. 2003; 81:556–59. https://doi.org/10.1016/S0888-7543(03)00052-1 [PubMed]
- 26. Horike S, Cai S, Miyano M, Cheng JF, Kohwi-Shigematsu T. Loss of silent-chromatin looping and impaired imprinting of DLX5 in Rett syndrome. Nat Genet. 2005; 37:31–40. https://doi.org/10.1038/ng1491 [PubMed]
- 27. Weidner CI, Lin Q, Koch CM, Eisele L, Beier F, Ziegler P, Bauerschlag DO, Jöckel KH, Erbel R, Mühleisen TW, Zenke M, Brümmendorf TH, Wagner W. Aging of blood can be tracked by DNA methylation changes at just three CpG sites. Genome Biol. 2014; 15:R24. https://doi.org/10.1186/gb-2014-15-2-r24 [PubMed]
- 28. Bell JT, Tsai PC, Yang TP, Pidsley R, Nisbet J, Glass D, Mangino M, Zhai G, Zhang F, Valdes A, Shin SY, Dempster EL, Murray RM, et al, and MuTHER Consortium. Epigenome-wide scans identify differentially methylated regions for age and age-related phenotypes in a healthy ageing population. PLoS Genet. 2012; 8:e1002629. https://doi.org/10.1371/journal.pgen.1002629 [PubMed]
- 29. Bork S, Pfister S, Witt H, Horn P, Korn B, Ho AD, Wagner W. DNA methylation pattern changes upon long-term culture and aging of human mesenchymal stromal cells. Aging Cell. 2010; 9:54–63. https://doi.org/10.1111/j.1474-9726.2009.00535.x [PubMed]
- 30. Batista-Brito R, Machold R, Klein C, Fishell G. Gene expression in cortical interneuron precursors is prescient of their mature function. Cereb Cortex. 2008; 18:2306–17. https://doi.org/10.1093/cercor/bhm258 [PubMed]
- 31. Cho KK, Hoch R, Lee AT, Patel T, Rubenstein JL, Sohal VS. Gamma rhythms link prefrontal interneuron dysfunction with cognitive inflexibility in Dlx5/6(+/-) mice. Neuron. 2015; 85:1332–43. https://doi.org/10.1016/j.neuron.2015.02.019 [PubMed]
- 32. Bouhali K, Dipietromaria A, Fontaine A, Caburet S, Barbieri O, Bellessort B, Fellous M, Veitia RA, Levi G. Allelic reduction of Dlx5 and Dlx6 results in early follicular depletion: a new mouse model of primary ovarian insufficiency. Hum Mol Genet. 2011; 20:2642–50. https://doi.org/10.1093/hmg/ddr166 [PubMed]
- 33. Samee N, Geoffroy V, Marty C, Schiltz C, Vieux-Rochas M, Clément-Lacroix P, Belleville C, Levi G, de Vernejoul MC. Increased bone resorption and osteopenia in Dlx5 heterozygous mice. J Cell Biochem. 2009; 107:865–72. https://doi.org/10.1002/jcb.22188 [PubMed]
- 34. Vieux-Rochas M, Mantero S, Heude E, Barbieri O, Astigiano S, Couly G, Kurihara H, Levi G, Merlo GR. Spatio-temporal dynamics of gene expression of the Edn1-Dlx5/6 pathway during development of the lower jaw. Genesis. 2010; 48:262–373. https://doi.org/10.1002/dvg.20625 [PubMed]
- 35. Bellessort B, Le Cardinal M, Bachelot A, Narboux-Nême N, Garagnani P, Pirazzini C, Barbieri O, Mastracci L, Jonchere V, Duvernois-Berthet E, Fontaine A, Alfama G, Levi G. Dlx5 and Dlx6 control uterine adenogenesis during post-natal maturation: possible consequences for endometriosis. Hum Mol Genet. 2016; 25:97–108. https://doi.org/10.1093/hmg/ddv452 [PubMed]
- 36. Saunders A, Macosko EZ, Wysoker A, Goldman M, Krienen FM, de Rivera H, Bien E, Baum M, Bortolin L, Wang S, Goeva A, Nemesh J, Kamitaki N, et al. Molecular Diversity and Specializations among the Cells of the Adult Mouse Brain. Cell. 2018; 174:1015–1030 e1016. https://doi.org/10.1016/j.cell.2018.07.028 [PubMed]
- 37. Vong L, Ye C, Yang Z, Choi B, Chua S
Jr , Lowell BB. Leptin action on GABAergic neurons prevents obesity and reduces inhibitory tone to POMC neurons. Neuron. 2011; 71:142–54. https://doi.org/10.1016/j.neuron.2011.05.028 [PubMed] - 38. Sukoff Rizzo SJ, Anderson LC, Green TL, McGarr T, Wells G, Winter SS. Assessing Healthspan and Lifespan Measures in Aging Mice: Optimization of Testing Protocols, Replicability, and Rater Reliability. Curr Protoc Mouse Biol. 2018; 8:e45. https://doi.org/10.1002/cpmo.45 [PubMed]
- 39. Long JE, Garel S, Depew MJ, Tobet S, Rubenstein JL. DLX5 regulates development of peripheral and central components of the olfactory system. J Neurosci. 2003; 23:568–78. https://doi.org/10.1523/JNEUROSCI.23-02-00568.2003 [PubMed]
- 40. Fujihara K, Miwa H, Kakizaki T, Kaneko R, Mikuni M, Tanahira C, Tamamaki N, Yanagawa Y. Glutamate Decarboxylase 67 Deficiency in a Subset of GABAergic Neurons Induces Schizophrenia-Related Phenotypes. Neuropsychopharmacology. 2015; 40:2475–86. https://doi.org/10.1038/npp.2015.117 [PubMed]
- 41. Boutin P, Dina C, Vasseur F, Dubois S, Corset L, Séron K, Bekris L, Cabellon J, Neve B, Vasseur-Delannoy V, Chikri M, Charles MA, Clement K, et al. GAD2 on chromosome 10p12 is a candidate gene for human obesity. PLoS Biol. 2003; 1:E68. https://doi.org/10.1371/journal.pbio.0000068 [PubMed]
- 42. Fontana L, Partridge L, Longo VD. Extending healthy life span—from yeast to humans. Science. 2010; 328:321–26. https://doi.org/10.1126/science.1172539 [PubMed]
- 43. Chen Y, Lin YC, Kuo TW, Knight ZA. Sensory detection of food rapidly modulates arcuate feeding circuits. Cell. 2015; 160:829–41. https://doi.org/10.1016/j.cell.2015.01.033 [PubMed]
- 44. Nousen EK, Franco JG, Sullivan EL. Unraveling the mechanisms responsible for the comorbidity between metabolic syndrome and mental health disorders. Neuroendocrinology. 2013; 98:254–66. https://doi.org/10.1159/000355632 [PubMed]
- 45. Newcomer JW. Metabolic syndrome and mental illness. Am J Manag Care. 2007 (Suppl ); 13:S170–77. [PubMed]
- 46. Chesney E, Goodwin GM, Fazel S. Risks of all-cause and suicide mortality in mental disorders: a meta-review. World Psychiatry. 2014; 13:153–60. https://doi.org/10.1002/wps.20128 [PubMed]
- 47. Goldstone AP. Prader-Willi syndrome: advances in genetics, pathophysiology and treatment. Trends Endocrinol Metab. 2004; 15:12–20. https://doi.org/10.1016/j.tem.2003.11.003 [PubMed]
- 48. Xu Z, Taylor JA. Genome-wide age-related DNA methylation changes in blood and other tissues relate to histone modification, expression and cancer. Carcinogenesis. 2014; 35:356–64. https://doi.org/10.1093/carcin/bgt391 [PubMed]
- 49. Rönn T, Volkov P, Gillberg L, Kokosar M, Perfilyev A, Jacobsen AL, Jørgensen SW, Brøns C, Jansson PA, Eriksson KF, Pedersen O, Hansen T, Groop L, et al. Impact of age, BMI and HbA1c levels on the genome-wide DNA methylation and mRNA expression patterns in human adipose tissue and identification of epigenetic biomarkers in blood. Hum Mol Genet. 2015; 24:3792–813. https://doi.org/10.1093/hmg/ddv124 [PubMed]
- 50. Nishida H, Miyagawa S, Vieux-Rochas M, Morini M, Ogino Y, Suzuki K, Nakagata N, Choi HS, Levi G, Yamada G. Positive regulation of steroidogenic acute regulatory protein gene expression through the interaction between Dlx and GATA-4 for testicular steroidogenesis. Endocrinology. 2008; 149:2090–97. https://doi.org/10.1210/en.2007-1265 [PubMed]
- 51. Marinova Z, Maercker A, Küffer A, Robinson MD, Wojdacz TK, Walitza S, Grünblatt E, Burri A. DNA methylation profiles of elderly individuals subjected to indentured childhood labor and trauma. BMC Med Genet. 2017; 18:21. https://doi.org/10.1186/s12881-017-0370-2 [PubMed]
- 52. Macosko EZ, Basu A, Satija R, Nemesh J, Shekhar K, Goldman M, Tirosh I, Bialas AR, Kamitaki N, Martersteck EM, Trombetta JJ, Weitz DA, Sanes JR, et al. Highly Parallel Genome-wide Expression Profiling of Individual Cells Using Nanoliter Droplets. Cell. 2015; 161:1202–14. https://doi.org/10.1016/j.cell.2015.05.002 [PubMed]
- 53. Chen Z, Xu YY, Wu R, Han YX, Yu Y, Ge JF, Chen FH. Impaired learning and memory in rats induced by a high-fat diet: involvement with the imbalance of nesfatin-1 abundance and copine 6 expression. J Neuroendocrinol. 2017; 29. https://doi.org/10.1111/jne.12462 [PubMed]
- 54. Ge JF, Gao WC, Cheng WM, Lu WL, Tang J, Peng L, Li N, Chen FH. Orcinol glucoside produces antidepressant effects by blocking the behavioural and neuronal deficits caused by chronic stress. Eur Neuropsychopharmacol. 2014; 24:172–80. https://doi.org/10.1016/j.euroneuro.2013.05.007 [PubMed]
- 55. Angoa-Pérez M, Kane MJ, Briggs DI, Francescutti DM, Kuhn DM. Marble burying and nestlet shredding as tests of repetitive, compulsive-like behaviors in mice. J Vis Exp. 2013. 50978. https://doi.org/10.3791/50978 [PubMed]
- 56. de Chaumont F, Ey E, Torquet N, Lagache T, Dallongeville S, Imbert A, Legou T, Le Sourd AM, Faure P, Bourgeron T, Olivo-Marin JC. Live Mouse Tracker: real-time behavioral analysis of groups of mice. bioRxiv. 2018. https://doi.org/10.1101/345132
- 57. Parnaudeau S, Dongelmans ML, Turiault M, Ambroggi F, Delbes AS, Cansell C, Luquet S, Piazza PV, Tronche F, Barik J. Glucocorticoid receptor gene inactivation in dopamine-innervated areas selectively decreases behavioral responses to amphetamine. Front Behav Neurosci. 2014; 8:35. https://doi.org/10.3389/fnbeh.2014.00035 [PubMed]
- 58. Liu JK, Ghattas I, Liu S, Chen S, Rubenstein JL. Dlx genes encode DNA-binding proteins that are expressed in an overlapping and sequential pattern during basal ganglia differentiation. Dev Dyn. 1997; 210:498–512. https://doi.org/10.1002/(SICI)1097-0177(199712)210:4<498::AID-AJA12>3.0.CO;2-3 [PubMed]