


Introduction
Colorectal cancer (CRC) is the fourth most commonly diagnosed cancer and the second leading cause of cancer-related mortality worldwide [1]. CRC is a highly aggressive malignancy with rapid progression. Its pathogenetic heterogeneity confers an escape mechanism to radiation, chemotherapy, and targeted therapies [2]. Despite recent advances in early diagnosis and treatment, the CRC prevalence and death rate in China have shown a significant upward trend over the past ten years [3], which sparked the need for effective management of CRC. Understanding the molecular mechanisms involved in CRC pathogenesis is key to discover new targets and therapeutic agents for CRC.
The SLCO1B3 gene encodes an organic anion-transporting polypeptide (OATP) 1B3, a member of the liver-enriched OATP superfamily. The OATP1B3 was first identified as a membrane-bound multi-specific transporter in hepatocytes responsible for the uptake of endogenous and xenobiotic substances [4, 5]. Later studies found that a variant of the liver-type SLCO1B3 mRNA (Lt-SLCO1B3) is expressed in human cancer tissues and cell lines [6]. This cancer-type SLCO1B3 mRNA (Ct-SLCO1B3) has a different transcription initiation site from the Lt-SLCO1B3, and its translated product (Ct-OATP1B3) mainly localized in the cytoplasm of cancer cells. Importantly, Ct-SLCO1B3 was detected significantly higher than Lt-SLCO1B3 in human colon cancer tissues [6]. However, the potential diagnostic and/or prognostic value and the functional role of SLCO1B3 in human CRC remain unexplored.
This study evaluated the relationship between SLCO1B3 and the clinicopathological characteristics and prognosis of CRC patients. We also investigated the function of SLCO1B3 in human CRC cell proliferation, migration, and invasion in vitro and in CRC tumorigenesis and metastasis in vivo. The molecular mechanisms underlying the function of SLCO1B3 in CRC were also explored.
Results
Gene screening and the expression of SLCO1B3 in human CRC and its relationship with disease progression and survival
To further assess the mechanism of CRC acceleration, we downloaded the GSE123734 dataset from the GEO database, which comprised CRC samples. According to data in GSE123734, we found that a high expression level of SLCO1B3 is associated with a lower overall survival rate (Figure 1A). Cytoscape and cytoHubba were used to catch the Hub genes. Consequently, the SLCO1B3 gene with the highest score was considered a hub gene involved in the cell-matrix adhesion and MMPs pathway GSE123734 (Figure 1B). In the collected clinical samples compared with adjacent normal tissues, the human CCR tissues exhibited significantly higher SLCO1B3 expression as revealed by qRT-PCR (P < 0.01, Figure 1C). SLCO1B3 is highly expressed in poorly differentiated CRC, whereas reduced expression has been noticed in moderately well-differentiated CRC. The difference is statistically significant (P < 0.01, Figure 1D). Correlation analysis revealed that high tumorous SLCO1B3 was associated with advanced disease stage, tumor invasion, lymph node metastasis, poor tumor differentiation, and low overall survival (Table 1 and Figure 1E). However, SLCO1B3 expression was not associated with gender, age, tumor size, or tumor location in these patients (Table 1).
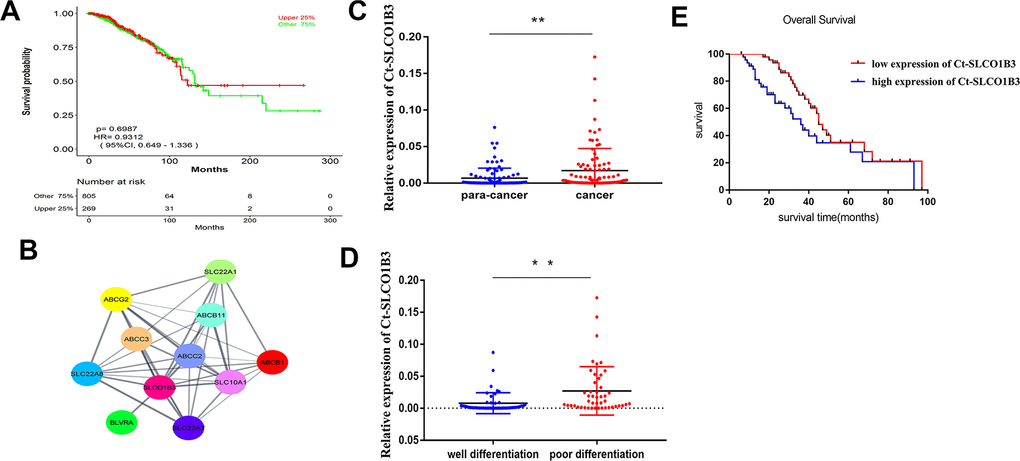
Figure 1. The expression of Ct-SLCO1B3 in human CRC and its correlation with tumor differentiation and survival. (A) The relationship between OS and Ct-SLCO1B3 expression in CRC patients was assessed by assessing the mechanism of SLCO1B3 in colorectal cancer acceleration. GSE123734 dataset from the GEO database was downloaded that comprised of colorectal cancer samples. (B) Cytoscape and cytoHubba were used to catch the Hub genes based on GSE123734. As a result, the SLCO1B3 gene with the highest score was considered a hub gene involved in the cell-matrix adhesion and MMPs pathway on GSE123734. (C) The Ct-SLCO1B3 expression in cancer and adjacent normal tissues by qRT-PCR. n=96. **P < 0.01. (D) In poorly differentiated CRC, higher expression of SLCO1B3 and in moderately well-differentiated CRC reduced expression of SLCO1B3 has been noticed significantly. **P < 0.01. (E) Overall survival analysis of SLCO1B3 expression in cancer tissues based one the collected clinical sample revealed that the high expression level of SLCO1B3 was associated with a lower overall survival rate. The median SLCO1B3 expression level was used as the cutoff for splitting high-expression and low-expression.
Table 1. The correlation between Ct-SLCO1B3 expression and the clinicopathologic features of the 96 CRC patients.
| Clinicopathologic features | n | SLCO1B3 | c2 | P-value | |||||||||||||||||||||||||||||||||||||||||||||||||||||||||||||||||||||||||||||||||||||||||||||||
| Low | High | ||||||||||||||||||||||||||||||||||||||||||||||||||||||||||||||||||||||||||||||||||||||||||||||||||
| All | 96 | 48 | 48 | ||||||||||||||||||||||||||||||||||||||||||||||||||||||||||||||||||||||||||||||||||||||||||||||||
| Gender | Male | 58 | 30 | 28 | 0.174 | 0.676 | |||||||||||||||||||||||||||||||||||||||||||||||||||||||||||||||||||||||||||||||||||||||||||||
| Female | 38 | 18 | 20 | ||||||||||||||||||||||||||||||||||||||||||||||||||||||||||||||||||||||||||||||||||||||||||||||||
| Age | ≥65 | 59 | 31 | 28 | 0.396 | 0.529 | |||||||||||||||||||||||||||||||||||||||||||||||||||||||||||||||||||||||||||||||||||||||||||||
| <65 | 37 | 17 | 20 | ||||||||||||||||||||||||||||||||||||||||||||||||||||||||||||||||||||||||||||||||||||||||||||||||
| Tumor size | ≥6cm | 41 | 21 | 20 | 0.043 | 0.873 | |||||||||||||||||||||||||||||||||||||||||||||||||||||||||||||||||||||||||||||||||||||||||||||
| <6cm | 55 | 27 | 28 | ||||||||||||||||||||||||||||||||||||||||||||||||||||||||||||||||||||||||||||||||||||||||||||||||
| Tumor site | Left | 59 | 31 | 28 | 0.396 | 0.529 | |||||||||||||||||||||||||||||||||||||||||||||||||||||||||||||||||||||||||||||||||||||||||||||
| Right | 37 | 17 | 20 | ||||||||||||||||||||||||||||||||||||||||||||||||||||||||||||||||||||||||||||||||||||||||||||||||
| Tumor invasion | T1+T2 | 5 | 5 | 0 | 5.275 | 0.022 | |||||||||||||||||||||||||||||||||||||||||||||||||||||||||||||||||||||||||||||||||||||||||||||
| T3+T4 | 91 | 43 | 48 | ||||||||||||||||||||||||||||||||||||||||||||||||||||||||||||||||||||||||||||||||||||||||||||||||
| N stage | N0 | 45 | 33 | 12 | 5.880 | 0.015 | |||||||||||||||||||||||||||||||||||||||||||||||||||||||||||||||||||||||||||||||||||||||||||||
| N1+2 | 51 | 15 | 36 | ||||||||||||||||||||||||||||||||||||||||||||||||||||||||||||||||||||||||||||||||||||||||||||||||
| M stage | M0 | 89 | 47 | 42 | 4.909 | 0.027 | |||||||||||||||||||||||||||||||||||||||||||||||||||||||||||||||||||||||||||||||||||||||||||||
| M1 | 7 | 1 | 6 | ||||||||||||||||||||||||||||||||||||||||||||||||||||||||||||||||||||||||||||||||||||||||||||||||
| TNM stage | I+II | 31 | 22 | 9 | 8.052 | 0.005 | |||||||||||||||||||||||||||||||||||||||||||||||||||||||||||||||||||||||||||||||||||||||||||||
| III+IV | 65 | 26 | 39 | ||||||||||||||||||||||||||||||||||||||||||||||||||||||||||||||||||||||||||||||||||||||||||||||||
| Note: The median Ct-SLCO1B3 expression level was used as the cutoff for splitting high-expression and low-expression tumors. The Chi-square test was used to analyze the correlation between the clinicopathologic features and Ct-SLCO1B3 expression level. P < 0.05 indicates statistical significance. | |||||||||||||||||||||||||||||||||||||||||||||||||||||||||||||||||||||||||||||||||||||||||||||||||||
SLCO1B3 expression in CRC cell lines and select effective interfere sequence
We found that high SLCO1B3 expression in human CRC tissues was associated with advanced disease, tumor invasion, lymph node metastasis, and poor patient survival. We investigated the role of this gene in CRC tumorigenesis in vitro and in vivo. We examined SLCO1B3 expression in the NCM460 normal human colon epithelial cell line and the SW480, SW620, HT29, HCT116, and RKO human CRC cell lines. The HCT116, HT29, and SW480 CRC cell lines showed significantly higher SLCO1B3 expression than the NCM460 cell line (Figure 2A, 2B). To evaluate the function of SLCO1B3 in human CRC cell proliferation, migration, and invasion in vitro, we generated HCT116 and SW480 cells transiently transfected with si1-SLCO1B3, si2-SLCO1B3, si3-SLCO1B3, or si-NC. The SLCO1B3 expression was effectively reduced with si1-SLCO1B3 or si2-SLCO1B3, but not with si3-SLCO1B3 transfection (Figure 2C, 2D). Subsequently, the HCT116 and SW480 cell lines were used to perform the followed research, transfected by si1-SLCO1B3 and si2-SLCO1B3.
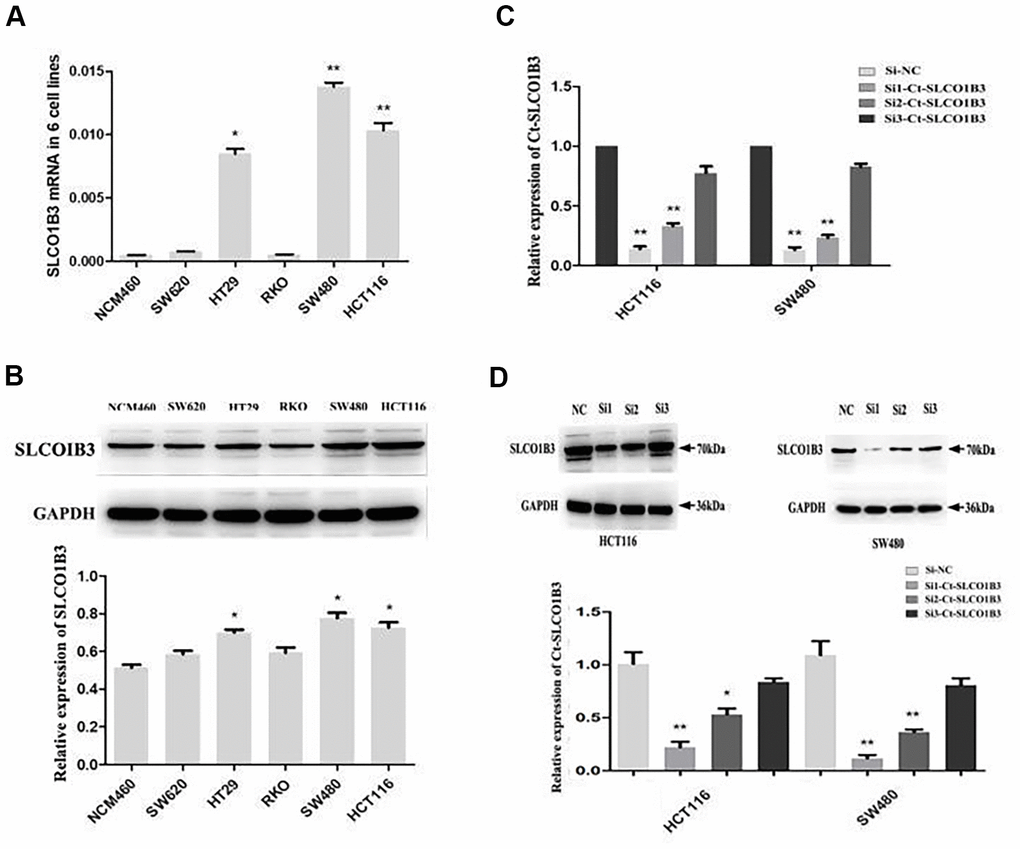
Figure 2. Ct-SLCO1B3 expression in CRC cell lines and select effective interfere sequence. (A, B) The mRNA (A) and protein (B) levels of Ct-SLCO1B3 in the NCM460 normal human colon epithelial cell line and the SW480, SW620, HT29, HCT116, and RKO human CRC cell lines by qRT-PCR and western blot analysis, respectively. n=3; *P < 0.05, **P < 0.01 vs. NCM460. (C, D) HCT116 and SW480 cells were transiently transfected with si1-Ct-SLCO1B3, si2-Ct-SLCO1B3, si3-Ct-SLCO1B3, or si-NC. (C) The Ct-SLCO1B3 mRNA levels by qRT-PCR. (D) The Ct-OATP1B3 protein levels by western blot analysis. n=3; *P < 0.05, **P < 0.01 vs. si-NC. NC=si-NC, Si1=si1-Ct-SLCO1B3, Si2=si2-Ct-SLCO1B3 and Si3=si3-Ct-SLCO1B3.
SLCO1B3 knockdown inhibits human CRC cell proliferation, migration, and invasion in vitro
Compared with the corresponding control cells, SLCO1B3-silenced HCT116 and SW480 cells exhibited significantly reduced migration and invasion abilities as indicated by the Transwell and wound healing assays (P < 0.05; Figure 3A–3C). In addition, the MTS assay revealed decreased proliferation of the SLCO1B3-silenced cells than their corresponding control (P < 0.05, Figure 3D, 3E).
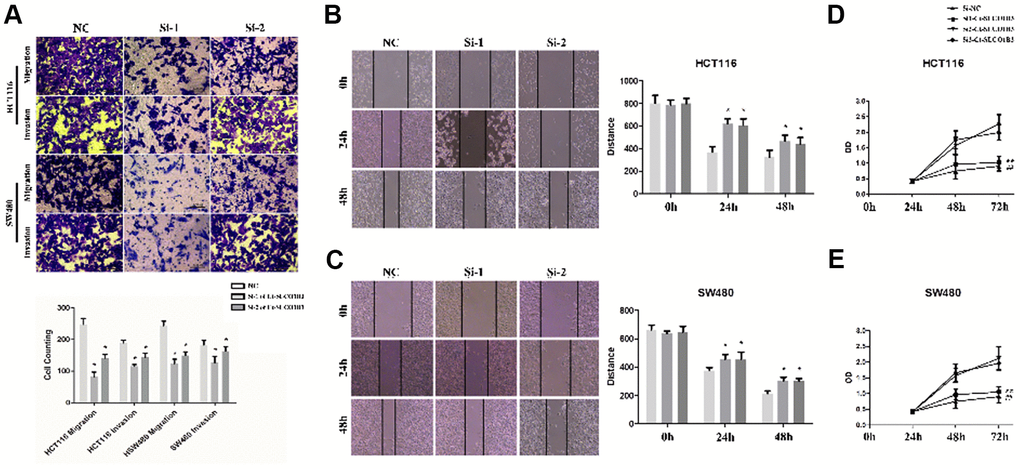
Figure 3. Ct-SLCO1B3 knockdown inhibits human CRC cell proliferation, migration, and invasion in vitro. (A) Cell migration and invasion abilities evaluated by the Transwell assays. The cells that had migrated to the lower surface of the membrane were counted after 48-hour incubation. n=3; *P < 0.05, **P < 0.01 vs. NC. (B, C) The scratch-wound healing assay evaluated cell migration ability. The width of the wound bed (distance) was measured at 0, 24, and 48 hours after the creation of the scratch wound. (D, E) Cell proliferation evaluated by the MTS assay. n=3; *P < 0.05, **P < 0.01, ##P < 0.01 vs. si-NC or NC. NC=si-NC.
The effects of SLCO1B3 knockdown on CRC tumorigenesis in vivo
We investigated the role of SLCO1B3 in CRC tumorigenesis in a mouse xenograft model and subsequently generated HCT116 and HT29 cells. They were then stably transfected with a lentiviral vector carrying sh-SLCO1B3 or sh-Control. SLCO1B3 knockdown was confirmed with western blot analysis (Figure 4A). Female BALB/c nude mice received HCT116 cells with stable SLCO1B3 knockdown (sh-SLCO1B3) or an equal number of negative controls HCT116 cells (sh-Control) by subcutaneous injection into the front flank (n=6 per group). The mice were euthanized 21 days after the inoculation. We found that xenograft tumors derived from SLCO1B3-silenced HCT116 cells grew significantly slower than those derived from control cells (P < 0.05). This resulted in smaller and lighter tumors after three weeks of growth (Figure 4B–4D).
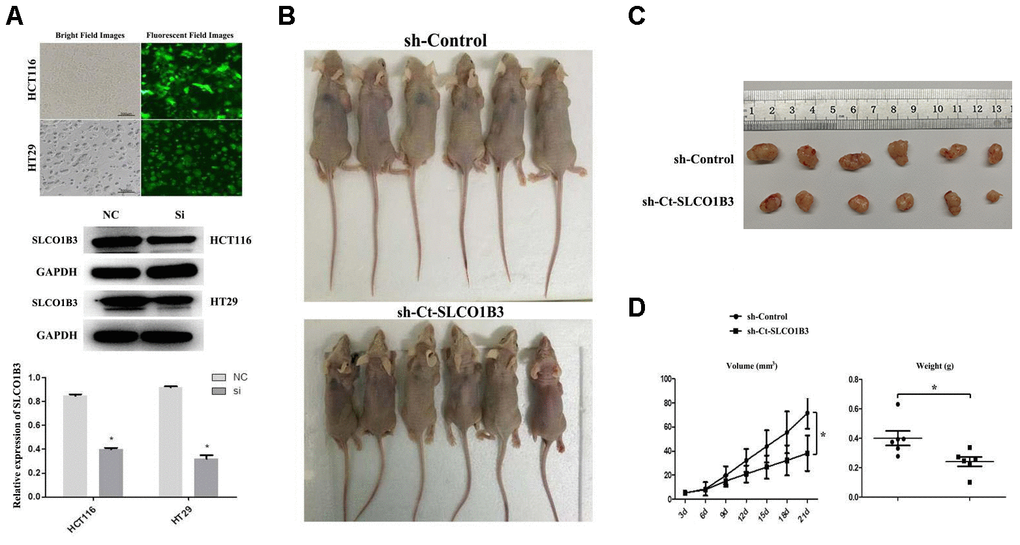
Figure 4. The effects of Ct-SLCO1B3 knockdown on CRC tumorigenesis in vivo. (A) Characterization of the HCT116 and HT29 cells stably transfected with a lentiviral vector carrying sh-Ct-SLCO1B3 or sh-Control. Bright and fluorescent field cell images (upper panel) and western blot analysis results on Ct-OATP1B3 protein expression (middle and lower panels) are shown. n=3, *P < 0.05 vs. sh-Control. (B) Photos of mice bearing subcutaneous tumors. (C) Photos of tumors harvested from the mice. (D) The change in tumor volume with time and the weight of the harvested tumors. *P < 0.05.
SLCO1B3 activates STAT3 in human CRC cells
To investigate the molecular mechanisms underlying the function of SLCO1B3, we used next-generation sequencing to study the effects of SLCO1B3 knockdown on the gene expression profile of CRC cells. A total of 286 mRNAs were differentially expressed in SLCO1B3-silenced HCT116 cells compared with the mRNAs in control HCT116 cells. Among which 125 were upregulated, and 161 were downregulated (Figure 5C). The mRNA expression data from this study are available from the GSE163396 dataset of the GEO database (Figure 5A). The GO functional enrichment analysis (Figure 5B, 5C), KEGG pathway analysis (Figure 5D), and GSEA (Figure 5E) revealed that many of these DEGs are involved in cancer invasion, metastasis, and DNA repair.
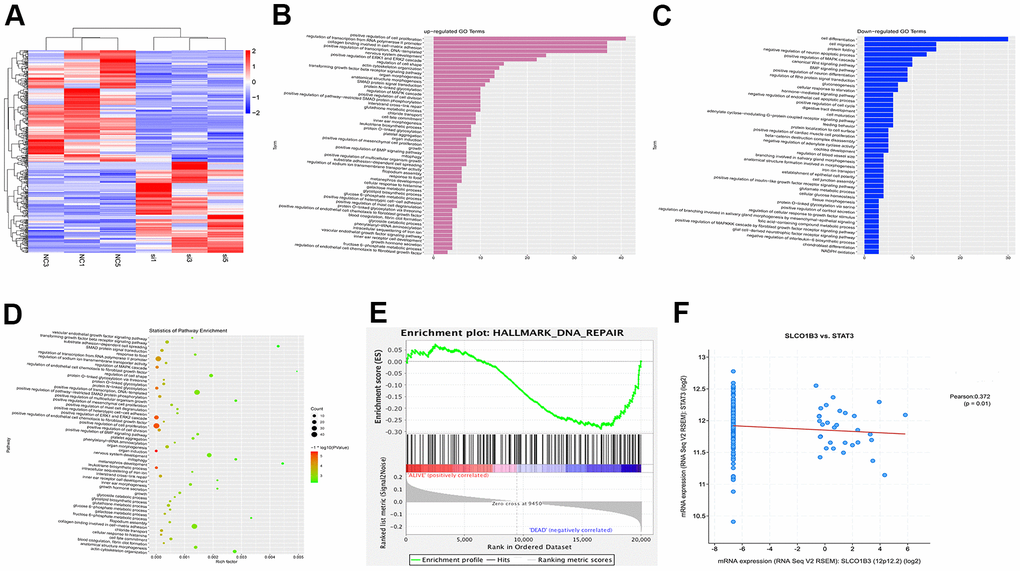
Figure 5. Bioinformatics analysis of GSE163396. Microarray data analysis was performed to investigate the molecular mechanisms underlying the function of SLCO1B3. (A) Heatmap of 286 differentially expressed genes from GSE163396 dataset (with 125 highly expressed genes and 161 lowly expressed genes). (B–D) GO functional enrichment and KEGG pathway analysis were performed based on DEGs from GSE163396 dataset. Partial results of the upregulated GO pathways were shown in panel B, the downregulated GO pathways were shown in panel C, and the KEGG pathway was illustrated in panel D. (E) Gene Set Enrichment Analysis (GSEA) revealed that most DEGs associated with the STAT3 signaling pathway were enriched in the SLCO1B3 gene. (F) The co-expression analysis revealed a positive association between the SLCO1B3 and STAT3 activation.
In a previous study, we found that STAT3, an important driver for CRC tumorigenesis and metastasis [7–9], was overexpressed in human CRC tissues compared with adjacent non-tumor colorectal tissues [10]. The co-expression analysis revealed a positive association between the two (Figure 5F). In our in vitro experiments, SLCO1B3 knockdown in HCT116 cells downregulated p-STAT3 (P < 0.01, Figure 6A, 6B), while total STAT3 remained unchanged. This indicated that SLCO1B3 activates the STAT3 pathway by promoting STAT3 phosphorylation. MMP-2 and MMP-9 are downstream targets of STAT3 that play critical roles in CRC invasion and metastasis [11]. SLCO1B3 knockdown also decreased MMP-2 and MMP-9 (P < 0.01). Thus, the pro-CRC properties of SLCO1B3 were at least partially mediated by STAT3 and its downstream mediators such as MMP-2 and MMP-9. Interleukin-6 (IL-6), a cytokine released from CRC cells, activates STAT3 to drive CRC pathogenesis and metastasis [12]. p-STAT3, MMP-2, and MMP-9 downregulated by SLCO1B3 silencing were restored by IL-6 (Figure 6A). Female BALB/c nude mice received HT29 cells with stable SLCO1B3 knockdown (sh-SLCO1B3) or an equal number of negative controls HT29 cells (sh-Control) by injection into the tail vein (n=6 per group). The mice were euthanized 21 days after the injection (Figure 7A, 7B). H&E staining of the liver Figure 7A and lung Figure 7B tissues showing metastatic nodules. The expression of p-STAT3, STAT3, MMP-2, and MMP-9 in metastatic tumors by western blot analysis (Figure 7C). **P < 0.01 vs. sh-Control.
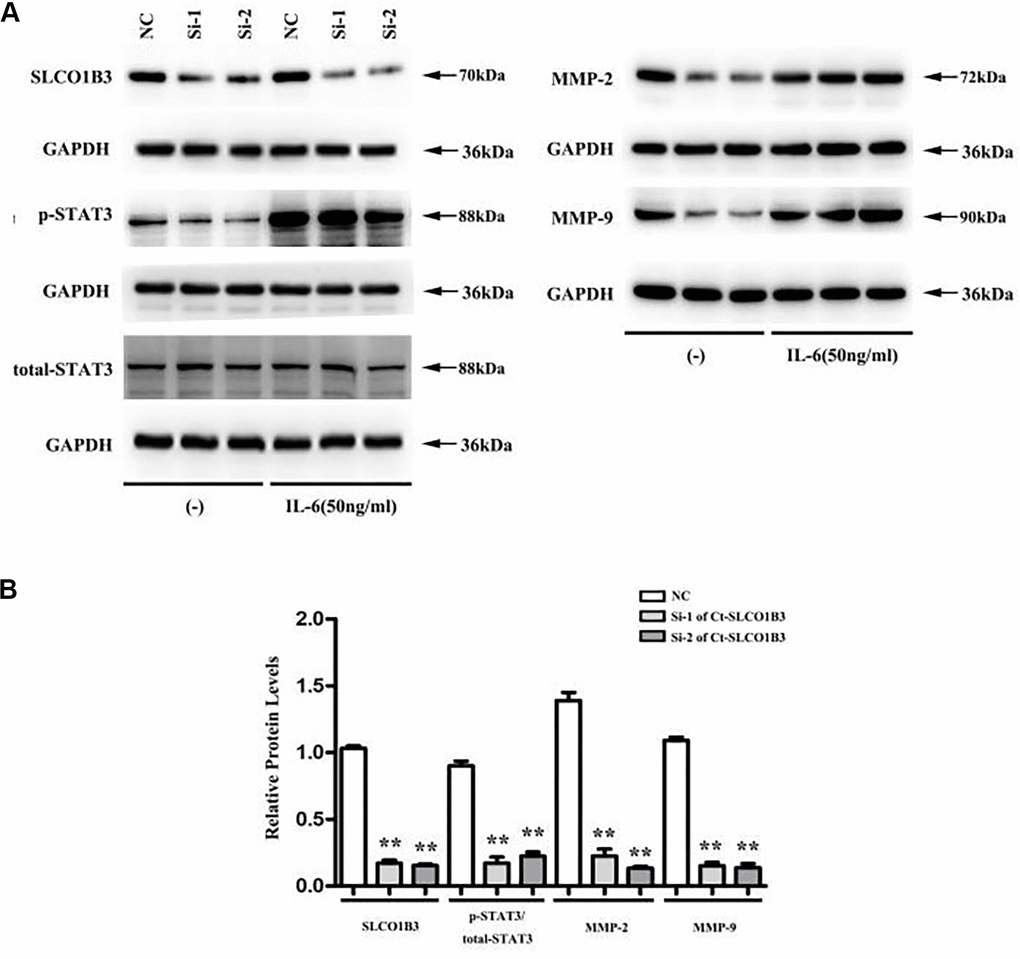
Figure 6. Ct-SLCO1B3 knockdown in HCT116 cells downregulates p-STAT3, MMP-2, and MMP-9. HCT116 cells were transiently transfected with si1-Ct-SLCO1B3, si2-Ct-SLCO1B3, or si-NC with or without IL-6 stimulation (50 ng/mL). The protein levels of Ct-OATP1B3, p-STAT3, total STAT3, MMP-2, and MMP-9 were determined by western blot analysis. (A) Gel image. (B) Quantified protein levels without IL-6 stimulation. n=3, **P < 0.01 vs. si-NC. NC=si-NC, Si-1=si1-Ct-SLCO1B3, Si-2=si2-Ct-SLCO1B3.
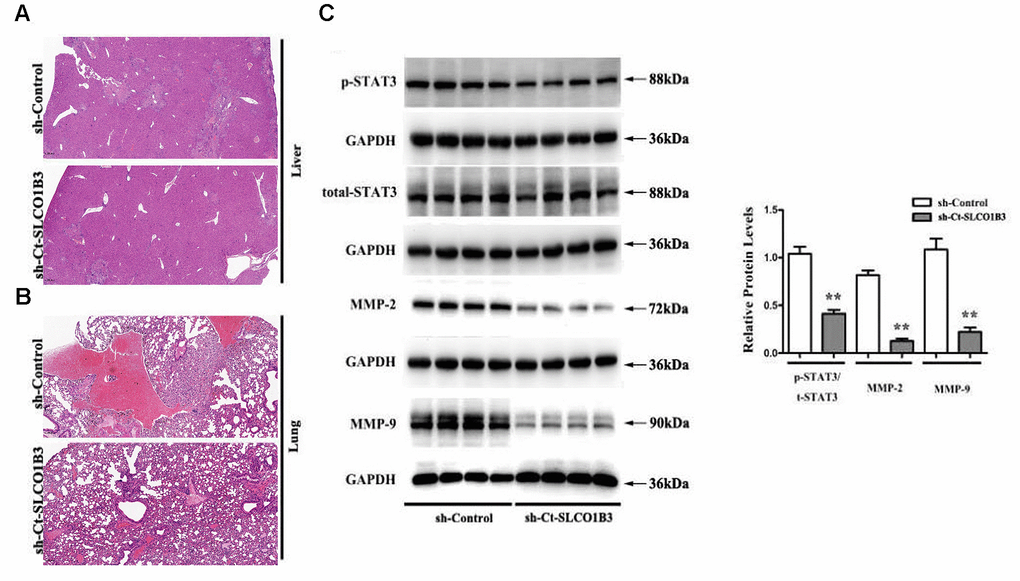
Figure 7. The effects of Ct-SLCO1B3 knockdown on CRC metastasis in vivo. (A, B) H&E staining of the liver and lung tissues showing metastatic nodules. (C) The expression of p-STAT3, STAT3, MMP-2, and MMP-9 in metastatic tumors by western blot analysis. **P < 0.01 vs. sh-Control.
Discussion
In the present study, the relationship between SLCO1B3 and the clinicopathological characteristics and prognosis of CRC patients was evaluated [13]. Our bioinformatics analysis identified SLCO1B3 as the top hub gene associated with the OS of CRC patients. Thus, SLCO1B3 may serve as a novel therapeutic target for CRC.
In 2008, L. Wooin et al. detected SLCO1B3 expression in most colon tumors [14]. They also found that higher SLCO1B3 expression was associated with lower stage and lower grade tumors and improved 5-year survival within individual tumor grades. This suggested that SLCO1B3 might exhibit antitumor properties in human CRC. However, another 2008 report showed that SLCO1B3 overexpression in CRC cells conferred resistance to drug-induced apoptosis, supporting the protumorigenic function of SLCO1B3 [14]. These seemingly contradictory findings were reported before the discovery of Ct-SLCO1B3 in 2012. In 2012, Nagai and colleagues identified Ct-SLCO1B3 in human colon and lung cancer tissues [6]. The original SLCO1B3 was renamed Lt-SLCO1B3 because of its enriched expression in the liver. Importantly, Ct-SLCO1B3 was detected significantly higher than Lt-SLCO1B3 in both human colon cancer tissues and cells [6, 15]. While Lt-OATP1B3 (the translated product of Lt-SLCO1B3) was mostly found as a membrane-bound protein on the cell surface, Ct-OATP1B3 (the translated product of Ct-SLCO1B3) was mainly detected in the cytoplasm of colon cancer cells [15]. In addition, Ct-OATP1B3 and Lt-OATP1B3 exhibited disparate patterns of post-translational modifications and proteasomal degradation [15]. Compared with Lt-OATP1B3, Ct-OATP1B3 showed poorer transporter activity [15]. Given these differences between the two, it is reasonable to speculate that Ct-SLCO1B3 and Lt-SLCO1B3 may play separate roles in carcinogenesis. Herein, we reported for the first time the function of SLCO1B3 as a carcinogen in CRC. Intriguingly, Ct-SLCO1B3, but not Lt-SLCO1B3, can be induced in response to ambient or chemical hypoxia through the HIF-1a pathway [16]. Thus, Ct-SLCO1B3 may serve as a defense mechanism in cancer cells to sustain tumor growth under hypoxic conditions.
This study found that high SLCO1B3 expression in human CRC tissues is associated with advanced disease stage, tumor invasion, lymph node metastasis, poor tumor differentiation, and poor OS. SLCO1B3 knockdown effectively inhibited human CRC proliferation, migration, and invasion in vitro and curbed CRC tumorigenesis and metastasis in vivo. Mechanistically, we identified p-STAT3 and its downstream targets MMP-2 and MMP-9 as mediators of the protumorigenic function of SLCO1B3. The STAT3 signaling is overactivated in the CRC, and its downstream mediators such as VEGF, c-Myc and Cyclin D1, MMP-2, and MMP-9 have been linked with tumor angiogenesis, proliferation, invasion, and metastasis, respectively [17–19]. Importantly, the activation of STAT3 has been identified as a critical mechanism for resistance to 5-FU [20], the current first-line chemotherapy for advanced CRC [21]. A SLCO1B3 inhibitor would possibly potentiate the efficacy of 5-FU in CRC by inactivating STAT3.
This study has limitations: (i) The primers designed in this study do not specifically recognize CT-OATP1B3, LT-OATP1B3; (ii) Immunohistochemistry in this study is also lacking. Thus, in a future study on this topic, immunohistochemistry should be performed with the antibody that recognizes Ct-OATP1B3.
In summary, we identified SLCO1B3 as a novel carcinogen in the CRC that drives CRC tumorigenesis and metastasis. SLCO1B3 inhibitors, alone or in combination with current drugs, may have therapeutic benefits in the CRC.
Materials and Methods
Human tissue samples
A total of 96 pairs of tumor and adjacent normal tissues were collected between 2012 and 2014 from 96 CRC patients in the Fourth Affiliated Hospital of Hebei Medical University (Shijiazhuang, Hebei, China). The adjacent normal tissues were at least 5 cm away from the tumor edge. The clinicopathological characteristics of the patients are shown in Table 1. This study was approved by the Ethics Committee of the Fourth Affiliated Hospital of Hebei Medical University, China. All patients included in this study provided written informed consent before test-specific implementation process.
Quantitative real-time PCR (qRT-PCR)
Total RNA was extracted using TRIzol Reagent (Thermo Fisher, USA). Complementary DNA (cDNA) was synthesized using the Reverse Transcription System (Promega, USA), following the manufacturer's instructions. Quantitative PCR (qPCR) was performed on a 7500 RT-PCR System (Applied Biosystems, USA) with the qPCR Mix (Promega, USA). The primers used in the amplification were: GAPDH, forward 5'-GGACCTGACCTGCCGTCTAG-3' and reverse 5'-GTAGCCCAGGATGCCCTTGA-3'; SLCO1B3, forward 5'-ACAGCAGAGTCAGCATCTTCAG-3' and reverse 5'-ATCACAAGCAAATTTCCAATTT-3'. The relative expression of SLCO1B3 was calculated using the 2-ΔΔCt method. Each experiment was performed in triplicate.
Cell culture
The SW480, SW620, HT29, HCT116, and RKO human CRC cell lines were purchased from the Type Culture Collection of the Chinese Academy of Science (Shanghai, China). The NCM460 normal human colon epithelial cell line was obtained from INCELL (USA). All cell lines were authenticated with short tandem repeat profiling. The SW480, SW620, and HT29 cells were cultured in Dulbecco's modified Eagle's medium (DMEM; Thermo Fisher USA), and the HCT116, RKO, and NCM460 cells were cultured in RPMI-1640 medium (Thermo Fisher). All growth media were supplemented with 10% fetal bovine serum (FBS) and 1% penicillin/streptomycin. All cells used in the experiments were mycoplasma-free.
Transient and stable transfections
HCT116 and SW480 cells were transiently transfected with an siRNA targeting SLCO1B3 or a negative control siRNA (Invitrogen, USA) using Lipofectamine 2000 (Invitrogen, USA), following the manufacturer's instructions. This was done to evaluate the effects of SLCO1B3 knockdown, on CRC cell proliferation, migration, and invasion. The target sequences were: si1-SLCO1B3, 5'-GCAACAGGAGGUACCACAUTT AUGUGGUACCUCCUGUUGCTT-3'; si2-SLCO1B3, 5'-GGAAAUAAUUCAGUGGCAUTTAUGCCACUGAAUUAUUUCCTT-3'; si3-SLCO1B3, 5'-GCACUAGGUGGAAUCAUUATT UAAUGAUUCCACCUAGUGCTT-3'. The negative control (si-NC) target sequence was: 5'-UUCUCCGAACGUGUCACGUTTACGUGACACGUUCGGAGAATT-3'. in which TT is the tail, playing as a stabilizing role. HCT116 and HT29 cells were stably transfected with a lentiviral vector carrying an shRNA targeting SLCO1B3 (sh-SLCO1B3: 5'-GGAAAUAAUUCAGUGGCAUTTAUGCCACUGAAUUAUUUCCTT-3'.) or a scrambled shRNA that served as negative control (sh-Control). This was done to evaluate the effects of SLCO1B3 knockdown, on CRC xenograft tumor growth and metastasis. Both sh-SLCO1B3 and sh-Control were obtained from Shanghai Genechem Co., Ltd., (Shanghai, China). SLCO1B3 knockdown in transient and stable transfections was confirmed by qRT-PCR and western blot analysis.
CRC mouse xenograft model
Female BALB/c nude mice (five weeks old) were purchased from Beijing Vital River Laboratory Animal Technology (Beijing, China). The mouse model was established following the previously published protocol [22]. The mice were randomly assigned to two groups (n=6 per group) to receive HCT116 cells with stable SLCO1B3 knockdown or an equal number of negative controls HCT116 cells by subcutaneous injection into the front flank. This was done to evaluate the effects of SLCO1B3 knockdown, on CRC xenograft tumor growth. Tumor length and width were measured with an external caliper once every three days. Tumor volume was calculated using the formula: tumor volume = (length × width2)/2. The mice were euthanized 21 days after the inoculation, and the tumors were harvested, photographed, and weighed. The mice were randomly assigned to two groups (n=6 per group) to receive HT29 cells with stable SLCO1B3 knockdown or an equal number of negative controls HT29 cells by injecting them into the tail vein. This was done to evaluate the effects of SLCO1B3 knockdown, on CRC metastasis. The mice were euthanized 21 days after the injection.
The lung and liver tissues were harvested and examined with hematoxylin and eosin (H&E) staining. The metastatic tumors were collected for western blot analysis. All animal experiments were performed following the international standards-3R principle of animal welfare and with permission of the Experimental Animal Ethics Committee of The Fourth Affiliated Hospital of Hebei Medical University.
H&E staining
H&E staining was conducted following the previously published protocol [23]. The paraffin sections of the mouse liver and lung tissues were dewaxed and stained with hematoxylin (Servicebio, Wuhan, China) for 3-5 minutes. After differentiation, bluing, and dehydration in 85% and 95% alcohol for 5 minutes each, the sections were stained with eosin (Servicebio) for 5 minutes, dehydrated, sealed, and observed under the microscope.
Western blot analysis
Western blot analysis was performed as previously described [24]. The primary antibodies used in the experiments included an anti-OATP1B3 antibody from Proteintech Group Inc., (Wuhan, China; Catalog # 66381-1) and anti-STAT3 (Catalog # ab68153), anti-p-STAT3 (S727) (Catalog # ab32143), anti-MMP-2 (Catalog # ab92536), and anti-MMP9 (Catalog # ab58803) antibodies from Abcam (USA). Each experiment was performed in triplicate.
Cell proliferation assay
SW480 and HCT116 cells transiently transfected with si1-SLCO1B3, si2-SLCO1B3, or si-NC were seeded in 96-well plates at a density of 3,000 cells/well and cultured for three days. Cell viability was evaluated using a 3-(4,5-dimethylthiazol-2-yl)-5-(3-carboxymethoxyphenyl)-2-(4-sulfophenyl)-2H-tetrazolium, inner salt (MTS) assay kit (Promega), according to the manufacturer's instructions. Each experiment was performed in triplicate.
Scratch-wound healing and transwell assays
The cell migration ability was assessed using the scratch-wound healing assay [25]. The width of the wound bed was recorded at 0, 24, and 48 hours after the scratch wound. In addition, the cell migration and invasion abilities were evaluated using the Transwell migration and invasion assays, respectively. In brief, 1.5 × 10⁵ cells were loaded into the upper chamber of Transwell inserts with an 8-μm pore membrane (Corning Costar, USA), either uncoated (for migration assessment) or pre-coated with Matrigel, BD, USA, (for invasion assessment). After 48 hours, the cells that had migrated to the lower surface of the membrane were fixed, stained with crystal violet, and counted under an inverted light microscope. Each experiment was performed in triplicate.
Identification of differentially expressed genes (DEGs) by microarray mRNA analysis
The microarray mRNA analysis was performed on HCT116 cells transfected with si1-SLCO1B3 or si-NC. The raw microarray data were converted to gene expression data using the Edge R package [26]. The DEGs (|logFC|>2 and padj<0.05) were identified with the Limma R package.
GSEA, GO, and KEGG analysis of DEGs
The Gene Set Enrichment Analysis (GSEA) was performed using the Category package (version 2.10.1). The functional enrichment Gene Ontology (GO) analysis and the Kyoto Encyclopedia of Genes and Genomes (KEGG) pathway analysis were performed with the DAVID online tools. Fisher's exact test was used to select the significant pathways. A P value less than 0.05 was considered statistically significant.
Bioinformatics analysis
The overall survival (OS) and mRNA expression data of CRC patients were retrieved from the GSE123734 dataset from the GEO (Gene Expression Omnibus) database. The relationship between OS and SLCO1B3 expression was analyzed by the Kaplan–Meier method. The CytoHubba application in Cytoscape was used to identify and rank the hub genes. The Cytoscape software was used to generate the protein-protein interaction diagram.
Statistical analysis
Each experiment was performed in triplicate. The results are presented as mean ± standard deviation. The differences between the two groups were evaluated using the two-tailed Student's t-test. The correlation between tumorous SLCO1B3 and the clinicopathological characteristics and prognosis of CRC patients was evaluated using the chi-square test. The Kaplan–Meier method (log-rank test) was used to interpret the survival curves. All statistical analyses were performed using the GraphPad Prism 5.0 and SPSS 21.0 software. A P-value of less than 0.05 was considered statistically significant.
Data availability statement
The mRNA expression data from this study will be deposited in the GSE163396 dataset of the GEO database.
Author Contributions
Lianghui Zhi conceived and coordinated the study, designed, performed and analyzed the experiments, wrote the paper. Lianmei Zhao, Xue Zhang, Wei Liu, Bo Gao, Feifei Wang, Xiaoran Wang and Guiying Wang carried out the data collection, data analysis, and revised the paper. All authors reviewed the results and approved the final version of the manuscript.
Conflicts of Interest
The authors declare that they have no conflicts of interest.
Funding
This work was supported by the Key Project of Precision Medical Joint Fund of Hebei Province (grant no.H202020648) from Guiying Wang, the Natural Science Foundation of China (grant no.81772550) from Lianmei Zhao, the Youth Outstanding Foundation of Hebei Province (grant no.H2019206697) from Lianmei Zhao.
References
- 1. Bray F, Ferlay J, Soerjomataram I, Siegel RL, Torre LA, Jemal A. Global cancer statistics 2018: GLOBOCAN estimates of incidence and mortality worldwide for 36 cancers in 185 countries. CA Cancer J Clin. 2018; 68:394–424. https://doi.org/10.3322/caac.21492 [PubMed]
- 2. Van der Jeught K, Xu HC, Li YJ, Lu XB, Ji G. Drug resistance and new therapies in colorectal cancer. World J Gastroenterol. 2018; 24:3834–48. https://doi.org/10.3748/wjg.v24.i34.3834 [PubMed]
- 3. Feng RM, Zong YN, Cao SM, Xu RH. Current cancer situation in China: good or bad news from the 2018 Global Cancer Statistics? Cancer Commun (Lond). 2019; 39:22. https://doi.org/10.1186/s40880-019-0368-6 [PubMed]
- 4. Hagenbuch B, Gui C. Xenobiotic transporters of the human organic anion transporting polypeptides (OATP) family. Xenobiotica. 2008; 38:778–801. https://doi.org/10.1080/00498250801986951 [PubMed]
- 5. König J, Cui Y, Nies AT, Keppler D. Localization and genomic organization of a new hepatocellular organic anion transporting polypeptide. J Biol Chem. 2000; 275:23161–68. https://doi.org/10.1074/jbc.M001448200 [PubMed]
- 6. Nagai M, Furihata T, Matsumoto S, Ishii S, Motohashi S, Yoshino I, Ugajin M, Miyajima A, Matsumoto S, Chiba K. Identification of a new organic anion transporting polypeptide 1B3 mRNA isoform primarily expressed in human cancerous tissues and cells. Biochem Biophys Res Commun. 2012; 418:818–23. https://doi.org/10.1016/j.bbrc.2012.01.115 [PubMed]
- 7. Corvinus FM, Orth C, Moriggl R, Tsareva SA, Wagner S, Pfitzner EB, Baus D, Kaufmann R, Huber LA, Zatloukal K, Beug H, Ohlschläger P, Schütz A, et al. Persistent STAT3 activation in colon cancer is associated with enhanced cell proliferation and tumor growth. Neoplasia. 2005; 7:545–55. https://doi.org/10.1593/neo.04571 [PubMed]
- 8. Kusaba T, Nakayama T, Yamazumi K, Yakata Y, Yoshizaki A, Inoue K, Nagayasu T, Sekine I. Activation of STAT3 is a marker of poor prognosis in human colorectal cancer. Oncol Rep. 2006; 15:1445–51. https://doi.org/10.3892/or.15.6.1445 [PubMed]
- 9. Ma XT, Wang S, Ye YJ, Du RY, Cui ZR, Somsouk M. Constitutive activation of Stat3 signaling pathway in human colorectal carcinoma. World J Gastroenterol. 2004; 10:1569–73. https://doi.org/10.3748/wjg.v10.i11.1569 [PubMed]
- 10. Li M, Zhao LM, Li SL, Li J, Gao B, Wang FF, Wang SP, Hu XH, Cao J, Wang GY. Differentially expressed lncRNAs and mRNAs identified by NGS analysis in colorectal cancer patients. Cancer Med. 2018; 7:4650–64. https://doi.org/10.1002/cam4.1696 [PubMed]
- 11. Ye TH, Yang FF, Zhu YX, Li YL, Lei Q, Song XJ, Xia Y, Xiong Y, Zhang LD, Wang NY, Zhao LF, Gou HF, Xie YM, et al. Inhibition of Stat3 signaling pathway by nifuroxazide improves antitumor immunity and impairs colorectal carcinoma metastasis. Cell Death Dis. 2017; 8:e2534. https://doi.org/10.1038/cddis.2016.452 [PubMed]
- 12. Wang SW, Sun YM. The IL-6/JAK/STAT3 pathway: potential therapeutic strategies in treating colorectal cancer (Review). Int J Oncol. 2014; 44:1032–40. https://doi.org/10.3892/ijo.2014.2259 [PubMed]
- 13. Lockhart AC, Harris E, Lafleur BJ, Merchant NB, Washington MK, Resnick MB, Yeatman TJ, Lee W. Organic anion transporting polypeptide 1B3 (OATP1B3) is overexpressed in colorectal tumors and is a predictor of clinical outcome. Clin Exp Gastroenterol. 2008; 1:1–7. https://doi.org/10.2147/ceg.s3743 [PubMed]
- 14. Lee W, Belkhiri A, Lockhart AC, Merchant N, Glaeser H, Harris EI, Washington MK, Brunt EM, Zaika A, Kim RB, El-Rifai W. Overexpression of OATP1B3 confers apoptotic resistance in colon cancer. Cancer Res. 2008; 68:10315–23. https://doi.org/10.1158/0008-5472.CAN-08-1984 [PubMed]
- 15. Thakkar N, Kim K, Jang ER, Han S, Kim K, Kim D, Merchant N, Lockhart AC, Lee W. A cancer-specific variant of the SLCO1B3 gene encodes a novel human organic anion transporting polypeptide 1B3 (OATP1B3) localized mainly in the cytoplasm of colon and pancreatic cancer cells. Mol Pharm. 2013; 10:406–16. https://doi.org/10.1021/mp3005353 [PubMed]
- 16. Han S, Kim K, Thakkar N, Kim D, Lee W. Role of hypoxia inducible factor-1α in the regulation of the cancer-specific variant of organic anion transporting polypeptide 1B3 (OATP1B3), in colon and pancreatic cancer. Biochem Pharmacol. 2013; 86:816–23. https://doi.org/10.1016/j.bcp.2013.07.020 [PubMed]
- 17. Lee H, Herrmann A, Deng JH, Kujawski M, Niu G, Li Z, Forman S, Jove R, Pardoll DM, Yu H. Persistently activated Stat3 maintains constitutive NF-kappaB activity in tumors. Cancer Cell. 2009; 15:283–93. https://doi.org/10.1016/j.ccr.2009.02.015 [PubMed]
- 18. Li B, Huang C. Regulation of EMT by STAT3 in gastrointestinal cancer (Review). Int J Oncol. 2017; 50:753–67. https://doi.org/10.3892/ijo.2017.3846 [PubMed]
- 19. Lin L, Liu A, Peng Z, Lin HJ, Li PK, Li C, Lin J. STAT3 is necessary for proliferation and survival in colon cancer-initiating cells. Cancer Res. 2011; 71:7226–37. https://doi.org/10.1158/0008-5472.CAN-10-4660 [PubMed]
- 20. Zhang Q, Liu RX, Chan KW, Hu J, Zhang J, Wei L, Tan H, Yang X, Liu H. Exosomal transfer of p-STAT3 promotes acquired 5-FU resistance in colorectal cancer cells. J Exp Clin Cancer Res. 2019; 38:320. https://doi.org/10.1186/s13046-019-1314-9 [PubMed]
- 21. McQuade RM, Stojanovska V, Bornstein JC, Nurgali K. Colorectal Cancer Chemotherapy: The Evolution of Treatment and New Approaches. Curr Med Chem. 2017; 24:1537–57. https://doi.org/10.2174/0929867324666170111152436 [PubMed]
- 22. Wimsatt JH, Montgomery C, Thomas LS, Savard C, Tallman R, Innes K, Jrebi N. Assessment of a mouse xenograft model of primary colorectal cancer with special reference to perfluorooctane sulfonate. PeerJ. 2018; 6:e5602. https://doi.org/10.7717/peerj.5602 [PubMed]
- 23. Perreault N, Sackett SD, Katz JP, Furth EE, Kaestner KH. Foxl1 is a mesenchymal Modifier of Min in carcinogenesis of stomach and colon. Genes Dev. 2005; 19:311–15. https://doi.org/10.1101/gad.1260605 [PubMed]
- 24. Li J, Zhao LM, Zhang C, Li M, Gao B, Hu XH, Cao J, Wang GY. The lncRNA FEZF1-AS1 Promotes the Progression of Colorectal Cancer Through Regulating OTX1 and Targeting miR-30a-5p. Oncol Res. 2020; 28:51–63. https://doi.org/10.3727/096504019X15619783964700 [PubMed]
- 25. Zhang WJ, Hu CG, Luo HL, Zhu ZM. Activation of P2×7 Receptor Promotes the Invasion and Migration of Colon Cancer Cells via the STAT3 Signaling. Front Cell Dev Biol. 2020; 8:586555. https://doi.org/10.3389/fcell.2020.586555 [PubMed]
- 26. Robinson MD, McCarthy DJ, Smyth GK. edgeR: a Bioconductor package for differential expression analysis of digital gene expression data. Bioinformatics. 2010; 26:139–40. https://doi.org/10.1093/bioinformatics/btp616 [PubMed]