


Introduction
As the premier malignant neoplasm in the urinary system, BC is a highly pathogenic malignant tumor that puts a heavy financial strain on patients and society [1–4]. BCs frequently recurs and even advanced malignant tumors often leads to the death of BC patients, so far it is difficult to be completely cured. Therefore, it is necessary to detect the potential mechanism of BC, so as to clarify its biological function in the occurrence and development of BC, and thus it can be transformed into a reasonable treatment strategy [5–7].
At present, the treatment for BC is still limited. Most BC pathological phenotypes are urothelial carcinomas, and the relatively ideal prognosis and high morbidity non-muscle-invasive BCs account for the majority, inversely, poor prognosis is the muscle-invasive BC [2, 8–10]. The non-invasive high-risk BC is used for transurethral cystectomy (TURBT), and the radical cystectomy is mainly applicable to muscular invasive high-risk bladder carcinomas, and the advanced tumors patients could mainly adopt targeted therapy or other conservative treatment measures [11–13]. However, the treatment effect of advanced tumor patients is still not ideal and the survival rate is lower. Therefore, there is an urgent need for alternative therapies and the development of more effective and safer therapies for bladder carcinoma is inevitable [5, 14–16]. The key molecular mechanisms of BC is thoroughly explored to conquer the bottleneck of clinical treatment in the future.
With the high-efficiency development of significant sequencing technologies, more and more abnormal lncRNAs that are more than 200 nucleotides [17–21], as important diseases gene regulators referred to biological transcription and post-transcription behavior, were reported in multifarious malignant tumors [22–24]. Various literatures indicated that lncRNAs acted as important functions in the malignant tumors [25–27], and were involved in proliferation, migration, apoptosis, even metastasis and other biological processes [28–31]. The abnormal expression of PVT1 was reported in the lung carcinomas, osteosarcomas, squamous cell carcinomas, stomach carcinomas, liver carcinomas, colorectal carcinomas, nasopharyngeal carcinomas and so on [32–37]. In vitro and in vivoo, studies were implemented to in-depth study potential tumor progression roles [38–43]. However, the clinical transformation application and biological significance of PVT1 in BC and other tumors is still thoroughly uncertain [1–8, 41, 45–50].
MicroRNAs (miRNAs) are 18-25 nucleotides’ non-coding RNAs to regulate tumorigenesis and progression, which have been confirmed in various tumors [8, 28, 36]. MiRNAs are quite conserved in species evolution, which are found in plants, animals and fungi, and are only expressed in specific tissues and developmental stages. The tissue specificity and timing of microRNAs determine the functional specificity of tissues and cells, indicating that microRNAs act as various roles in term of the cell growth and development regulation [41, 50–54]. MiR-194-5p was reported in numerous tumors, including kidney carcinoma, colorectal cancer and glioma [55–59]. Nevertheless, the potential mechanisms of miR-194-5p in the malignant BC behaviors are thoroughly unknown. In our experiment, as a negative regulatory, miR-194-5p participated in the BC evolution.
A lot of literatures manifested lncRNAs function as miRNAs sponges [26, 28, 35–37, 56]. We reported the mutual correlation between PVT1 and miR-194-5p as miRNAs sponges in the bladder carcinomas. Our research could help us deeply broaden our horizons about the lncRNA-miRNA sponges’ expression pattern and mutual roles of PVT1 and miR-194-5p in the BC.
In our study, we discovered that PVT1 is up-regulated in BC tissues and cells and miR-194-5p is converse. The relative expression levels of PVT1 and miR-194-5p are closely correlated with histological grade and TNM stage. In our study, we elucidated that PVT1 facilitated the progression of BC and miR-194-5p is converse.
Furthermore, it was found that PVT1 functions as a ceRNA-dependent manner to sponge miR-194-5p to tightly promote BCLAF1 expression. Meanwhile, our deepen study suggests that PVT1 acts as a significant tumor regulator and PVT1-miR-194-5p-BCLAF1 axis participates in BC progression, which emerges its possibly clinical application of BC as a meritoriously clinical diagnosis and treatment strategies. Maybe, our experiments can offer a novel direction for the exploration of BC therapeutic target and provide a more valid research method to detect tumor progression and treatment strategies for the ultimate aim of the precision cancer medicine.
Results
Up-regulated expression of PVT1 and down-regulated expression of miR-194-5p in BCs
The relative expression level of PVT1 and miR-194-5p was measured through RT-qPCR in BC samples. Compared to para-carcinoma tissues, the relative expression level of PVT1 was significantly increased about 2.28 times (43 of 70) of BC samples (P<0.001) (Figure 1A, 1B), and the relative expression level of miR-194-5p was significantly decreased about 42.92% (46 of 70) of BC samples (P=0.023) (Figure 1C, 1D). Compared to SV-HUC-1, the relative expression level of PVT1 was up-regulated in both BC cells, T24 about 3.76 times (P < 0.001) and UM-UC-3 about 2.84 times (P=0.004) (Figure 1E), and the relative expression level of miR-194-5p was decreased in both BC cells, T24 about 44.16% (P=0.003) and UM-UC-3 about 63.77% (P = 0.001) (Figure 1F). PVT1 expression levels were statistically positively correlated with miR-194-5p expression levels in BC samples and cells (Figure 1G, 1H). As following in Table 1, the up-regulated expression of PVT1 was closely associated with histological grade (P = 0.014), and TNM stage (P< 0.001) in bladder carcinomas, the low expression of miR-194-5p was significantly related to histological grade (P=0.006) and TNM stage (P<0.001). But sex, age, tumor size, and lymph node metastasis were no obvious correlation with the relative expression levels of PVT1 and miR-194-5p. Our results manifested that PVT1 could act as the oncogene and miR-194-5p could act as the antioncogene in BCs.
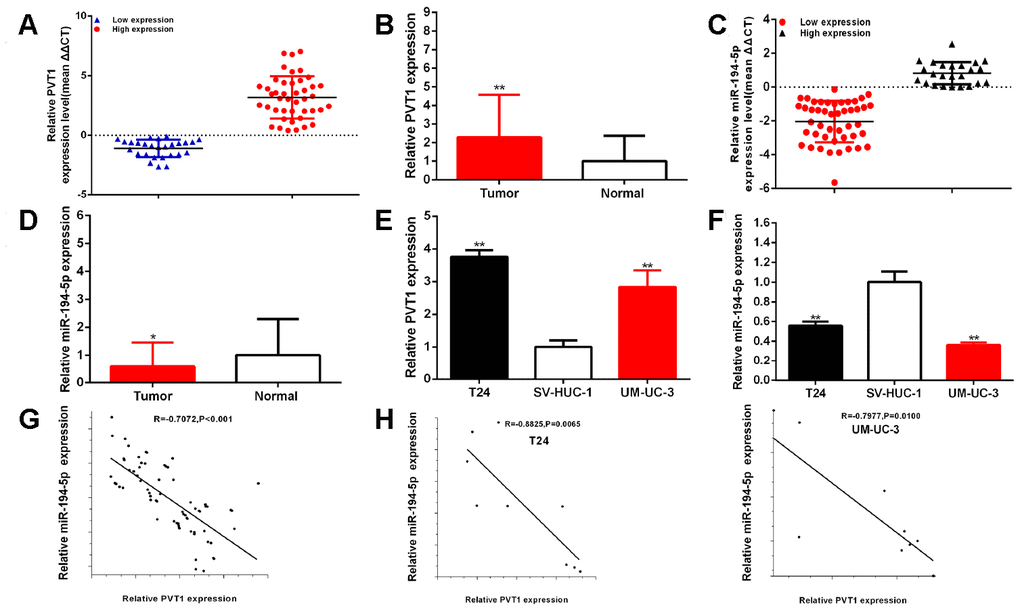
Figure 1. PVT1 is up-regulated and miR-194-5p is down-regulated in BC samples and cells. The relative expression patterns of PVT1 (A, B) and miR-194-5p (C, D) in paired BC tissues and normal tissues, and in BC cells (T24 and UM-UC-3) and SV-HUC-1 (E, F) were shown. PVT1 expression levels were statistically correlated with miR-194-5p expression levels in bladder tissues and cells (G, H). (*P < 0.05, **P < 0.01).
Table 1a. Correlation between PVT1 expression and clinicopathological characteristics of bladder cancer patients.
| Characteristics | Total | Expression of PVT1 | P value | ||||||||||||||||||||||||||||||||||||||||||||||||||||||||||||||||||||||||||||||||||||||||||||||||
| High (n=43) | Low (n=27) | ||||||||||||||||||||||||||||||||||||||||||||||||||||||||||||||||||||||||||||||||||||||||||||||||||
| Gender | |||||||||||||||||||||||||||||||||||||||||||||||||||||||||||||||||||||||||||||||||||||||||||||||||||
| Male | 45 | 31(68.9%) | 14(31.1%) | 0.124 | |||||||||||||||||||||||||||||||||||||||||||||||||||||||||||||||||||||||||||||||||||||||||||||||
| Female | 25 | 12(48.0%) | 13(52.0%) | ||||||||||||||||||||||||||||||||||||||||||||||||||||||||||||||||||||||||||||||||||||||||||||||||
| Tumor size (cm) | |||||||||||||||||||||||||||||||||||||||||||||||||||||||||||||||||||||||||||||||||||||||||||||||||||
| <3cm | 33 | 17(51.5%) | 16(48.5%) | 0.142 | |||||||||||||||||||||||||||||||||||||||||||||||||||||||||||||||||||||||||||||||||||||||||||||||
| ≥3cm | 37 | 26(70.3%) | 11(29.7%) | ||||||||||||||||||||||||||||||||||||||||||||||||||||||||||||||||||||||||||||||||||||||||||||||||
| Multiplicity | |||||||||||||||||||||||||||||||||||||||||||||||||||||||||||||||||||||||||||||||||||||||||||||||||||
| Single | 30 | 20(66.7%) | 10(33.3%) | 0.468 | |||||||||||||||||||||||||||||||||||||||||||||||||||||||||||||||||||||||||||||||||||||||||||||||
| Multiple | 40 | 23(57.5%) | 17(42.5%) | ||||||||||||||||||||||||||||||||||||||||||||||||||||||||||||||||||||||||||||||||||||||||||||||||
| Age | |||||||||||||||||||||||||||||||||||||||||||||||||||||||||||||||||||||||||||||||||||||||||||||||||||
| <60 | 26 | 18(69.2%) | 8(30.8%) | 0.324 | |||||||||||||||||||||||||||||||||||||||||||||||||||||||||||||||||||||||||||||||||||||||||||||||
| ≥60 | 44 | 25(56.8%) | 19(43.2%) | ||||||||||||||||||||||||||||||||||||||||||||||||||||||||||||||||||||||||||||||||||||||||||||||||
| Histological grade | |||||||||||||||||||||||||||||||||||||||||||||||||||||||||||||||||||||||||||||||||||||||||||||||||||
| PUNLMP/Low-grade | 33 | 15(45.5%) | 18(54.5%) | 0.014* | |||||||||||||||||||||||||||||||||||||||||||||||||||||||||||||||||||||||||||||||||||||||||||||||
| High-grade | 37 | 28(75.7%) | 9(24.3%) | ||||||||||||||||||||||||||||||||||||||||||||||||||||||||||||||||||||||||||||||||||||||||||||||||
| Tumor invasion depth (T) | |||||||||||||||||||||||||||||||||||||||||||||||||||||||||||||||||||||||||||||||||||||||||||||||||||
| Tis, Ta, T1 | 34 | 13(38.2%) | 21(61.8%) | <0.001** | |||||||||||||||||||||||||||||||||||||||||||||||||||||||||||||||||||||||||||||||||||||||||||||||
| T2,T3 or above | 36 | 30(83.3%) | 6(16.7%) | ||||||||||||||||||||||||||||||||||||||||||||||||||||||||||||||||||||||||||||||||||||||||||||||||
| Lymph node metastasis(N) | |||||||||||||||||||||||||||||||||||||||||||||||||||||||||||||||||||||||||||||||||||||||||||||||||||
| N0 | 64 | 38(59.4%) | 26(40.6%) | 0.394 | |||||||||||||||||||||||||||||||||||||||||||||||||||||||||||||||||||||||||||||||||||||||||||||||
| N1 or above | 6 | 5(83.3%) | 1(16.7%) | ||||||||||||||||||||||||||||||||||||||||||||||||||||||||||||||||||||||||||||||||||||||||||||||||
| PUNLMP: Papillary Urothelial Neoplasm of Low Malignant Potential; Low-grade, Low-grade Papillary Urothelial Carcinoma; High-grade, High-grade Papillary Urothelial Carcinoma; TNM according to the seventh edition of staging TNM of Union Internationale Contre Le Cancer (UICC) in 2009. | |||||||||||||||||||||||||||||||||||||||||||||||||||||||||||||||||||||||||||||||||||||||||||||||||||
Table 1b. Correlation between miR-194-5p expression and clinicopathological characteristics of bladder cancer patients.
| Characteristics | Total | Expression of miR-194-5p | P value | ||||||||||||||||||||||||||||||||||||||||||||||||||||||||||||||||||||||||||||||||||||||||||||||||
| High (n=24) | Low (n=46) | ||||||||||||||||||||||||||||||||||||||||||||||||||||||||||||||||||||||||||||||||||||||||||||||||||
| Gender | |||||||||||||||||||||||||||||||||||||||||||||||||||||||||||||||||||||||||||||||||||||||||||||||||||
| Male | 45 | 13(28.9%) | 32(71.1%) | 0.293 | |||||||||||||||||||||||||||||||||||||||||||||||||||||||||||||||||||||||||||||||||||||||||||||||
| Female | 25 | 11(44.0%) | 14(56.0%) | ||||||||||||||||||||||||||||||||||||||||||||||||||||||||||||||||||||||||||||||||||||||||||||||||
| Tumor size (cm) | |||||||||||||||||||||||||||||||||||||||||||||||||||||||||||||||||||||||||||||||||||||||||||||||||||
| <3cm | 33 | 13(39.4%) | 20(60.6%) | 0.455 | |||||||||||||||||||||||||||||||||||||||||||||||||||||||||||||||||||||||||||||||||||||||||||||||
| ≥3cm | 37 | 11(29.7%) | 26(70.3%) | ||||||||||||||||||||||||||||||||||||||||||||||||||||||||||||||||||||||||||||||||||||||||||||||||
| Multiplicity | |||||||||||||||||||||||||||||||||||||||||||||||||||||||||||||||||||||||||||||||||||||||||||||||||||
| Single | 30 | 14(46.7%) | 16(53.3%) | 0.077 | |||||||||||||||||||||||||||||||||||||||||||||||||||||||||||||||||||||||||||||||||||||||||||||||
| Multiple | 40 | 10(25.0%) | 30(75.0%) | ||||||||||||||||||||||||||||||||||||||||||||||||||||||||||||||||||||||||||||||||||||||||||||||||
| Age | |||||||||||||||||||||||||||||||||||||||||||||||||||||||||||||||||||||||||||||||||||||||||||||||||||
| <60 | 26 | 12(46.2%) | 14(53.8%) | 0.125 | |||||||||||||||||||||||||||||||||||||||||||||||||||||||||||||||||||||||||||||||||||||||||||||||
| ≥60 | 44 | 12(27.3%) | 32(72.7%) | ||||||||||||||||||||||||||||||||||||||||||||||||||||||||||||||||||||||||||||||||||||||||||||||||
| Histological grade | |||||||||||||||||||||||||||||||||||||||||||||||||||||||||||||||||||||||||||||||||||||||||||||||||||
| PUNLMP/Low-grade | 33 | 17(51.5%) | 16(48.5%) | 0.006** | |||||||||||||||||||||||||||||||||||||||||||||||||||||||||||||||||||||||||||||||||||||||||||||||
| High-grade | 37 | 7(18.9%) | 30(81.1%) | ||||||||||||||||||||||||||||||||||||||||||||||||||||||||||||||||||||||||||||||||||||||||||||||||
| Tumor invasion depth (T) | |||||||||||||||||||||||||||||||||||||||||||||||||||||||||||||||||||||||||||||||||||||||||||||||||||
| Tis, Ta, T1 | 34 | 21(61.8%) | 13(38.2%) | <0.001** | |||||||||||||||||||||||||||||||||||||||||||||||||||||||||||||||||||||||||||||||||||||||||||||||
| T2,T3 or above | 36 | 3(8.30%) | 33(91.7%) | ||||||||||||||||||||||||||||||||||||||||||||||||||||||||||||||||||||||||||||||||||||||||||||||||
| Lymph node metastasis(N) | |||||||||||||||||||||||||||||||||||||||||||||||||||||||||||||||||||||||||||||||||||||||||||||||||||
| N0 | 64 | 23(35.9%) | 41(64.1%) | 0.656 | |||||||||||||||||||||||||||||||||||||||||||||||||||||||||||||||||||||||||||||||||||||||||||||||
| N1 or above | 6 | 1(16.7%) | 5(83.3%) | ||||||||||||||||||||||||||||||||||||||||||||||||||||||||||||||||||||||||||||||||||||||||||||||||
| PUNLMP: Papillary Urothelial Neoplasm of Low Malignant Potential; Low-grade, Low-grade Papillary Urothelial Carcinoma; High-grade, High-grade Papillary Urothelial Carcinoma; TNM according to the seventh edition of staging TNM of Union Internationale Contre Le Cancer (UICC) in 2009. | |||||||||||||||||||||||||||||||||||||||||||||||||||||||||||||||||||||||||||||||||||||||||||||||||||
PVT1 acted as the oncogene
After 48 hours of transfection for siRNA, miRNA mimics or inhibitor and pcDNA3.1-PVT1, the relative expression levels of PVT1 and miR-194-5p were detected by qRT-PCR in T24, UM-UC-3 and SV-HUC-1. After transfection, the relative expression of PVT1 was down-regulated about 41.51% in T24 (p= 0.002) and was reduced about 44.32% in UM-UC-3 (P= 0.006) cells (Figure 2A). The relative expression of PVT1 was notably increased about 2.41 times in SV-HUC-1 (p<0.001) after 48 hours of transfection for pcDNA3.1-PVT1 (Figure 2B). The relative expression of miR-194-5p was reduced about 53.60% in SV-HUC-1 (P= 0.0185) by pcDNA3.1-PVT1 (Figure 2C).
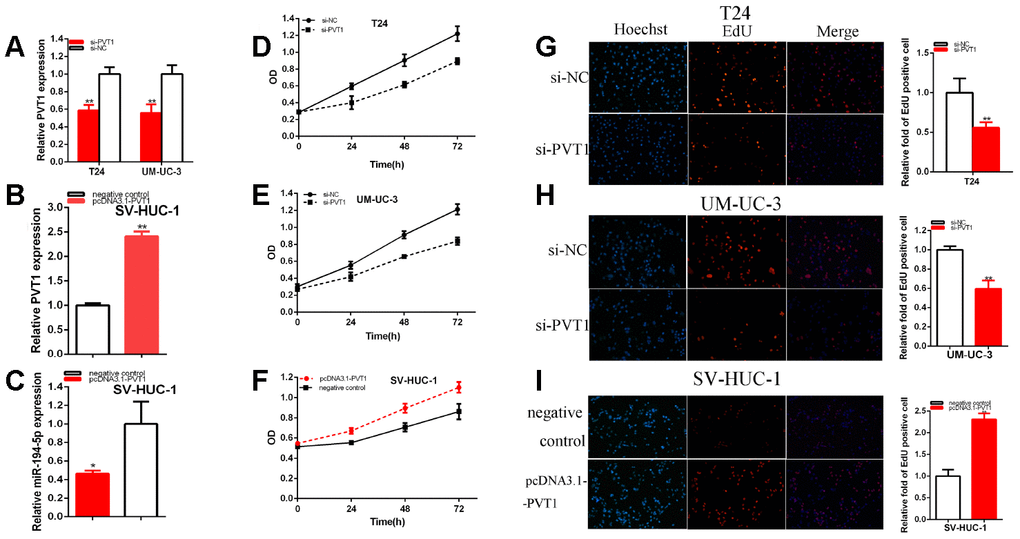
Figure 2. PVT1 acted as the oncogene. The relative expression level of PVT1 was reduced by si-PVT1 (A) and increased by pcDNA3.1-PVT1 (B). The relative expression level of miR-194-5p was reduced by pcDNA3.1-PVT1 (C). Cell proliferation was detected in both BC cells after transfection of siRNA (D, E) and pcDNA3.1-PVT1 (F). Representative images of EdU assay and the relative fold changes of EdU positive cells were detected by siRNA (G, H) and pcDNA3.1-PVT1 (I). (*P < 0.05, **P < 0.01).
CCK-8 was carried out to detect whether the knockdown of PVT1 could restrain the proliferation and pcDNA3.1-PVT1 could facilitate the proliferation in BC T24, UM-UC-3 and SV-HUC-1 cells. Our study demonstrated that si-PVT1 (Figure 2D, 2E) notably restrained both BC cells proliferation (p < 0.01). PcDNA3.1-PVT1 (Figure 2F) remarkably facilitated SV-HUC-1 cell proliferation (p < 0.01).
EdU was elucidated cell proliferation as well. Compared with control group, EdU positive T24 and UM-UC-3 cells in si-PVT1 group were reduced and pcDNA3.1-PVT1 group was reversed after transfection in SV-HUC-1 cell line.
EdU assay proved that the quantity of EdU positive cells was decreased about 47.98% in T24 (P=0.006) (Figure 2G) and about 40.53% in UM-UC-3 (P = 0.002) (Figure 2H) in si-PVT1 group. The quantity of EdU positive cells was increased about 2.31 times in SV-HUC-1 (P< 0.001) (Figure 2I) of pcDNA3.1-PVT1 group.
Our study manifested that the knockdown of PVT1 restrained bladder cell lines proliferation and over-expression PVT1 facilitated bladder cell lines proliferation.
Cell migration was detected after the transfection of siRNA and plasmids by scratch assay. Scratch assay that revealed that the ratio of the relative migration was decreased about 41.29% in T24 (P = 0.001) (Figure 3A) and decreased about 42.18% in UM-UC-3 (P = 0.004) (Figure 3B) in si-PVT1 group. The ratio of the relative migration in the pcDNA3.1-PVT1 group was up-regulated about 2.032 times in SV-HUC-1 (P<0.001) (Figure 3C).
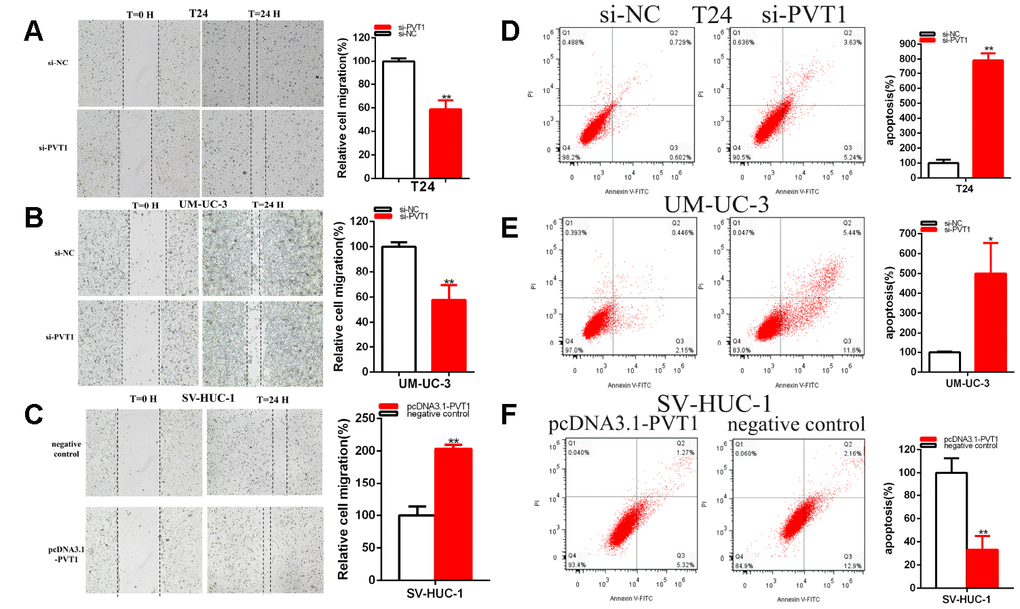
Figure 3. PVT1 affected the BC cell migration and apoptosis. The relative cell migration was restrained after transfection of siRNA in the T24 and UM-UC-3 (A, B) cell lines. The relative cell migration was facilitated after transfection of pcDNA3.1-PVT1 in the SV-HUC-1 cell lines (C). Apoptotic cells were measured after transfection of siRNA in the T24 (D) and UM-UC-3 (E) cell lines, of pcDNA3.1 in the SV-HUC-1 cell line (F) by flow cytometry analysis. (*P < 0.05, **P < 0.01).
Our results concluded that the knockdown of PVT1 restrained bladder cell lines migration. Overexpression PVT1 expression facilitated bladder cell lines migration.
Cell apoptosis was measured with flow cytometry assay. Compared with control groups, the ratios of apoptosis were up-regulated about 7.91 times in T24 (P<0.001) and increased about 4.99 times in UM-UC-3 (P=0.011) (Figure 3D, 3E) after transfection si-PVT1.
Compared with control groups, the ratios of apoptosis were dramatically reduced about 0.332 times in SV-HUC-1 (P=0.003) (Figure 3F) after the transfection of pcDNA3.1-PVT1.
In brief, the knockdown of PVT1 facilitated bladder cell lines apoptosis and overexpression PVT1 restrained bladder cell lines apoptosis.
MiR-194-5p acted as the antioncogene
The relative expression levels of miR-194-5p were remarkably reduced about 48.64% in T24 (p =0.044) and about 75.51% in UM-UC-3 (P<0.001) at 48 hours after the transfection of miR-194-5p inhibitor (Figure 4A). The relative expression levels of miR-194-5p were increased in about 2.460 times in T24 (p=0.002) and 3.259 times in UM-UC-3 (p< 0.001) at 48 hours after the transfection of miR-194-5p mimics (Figure 4A).
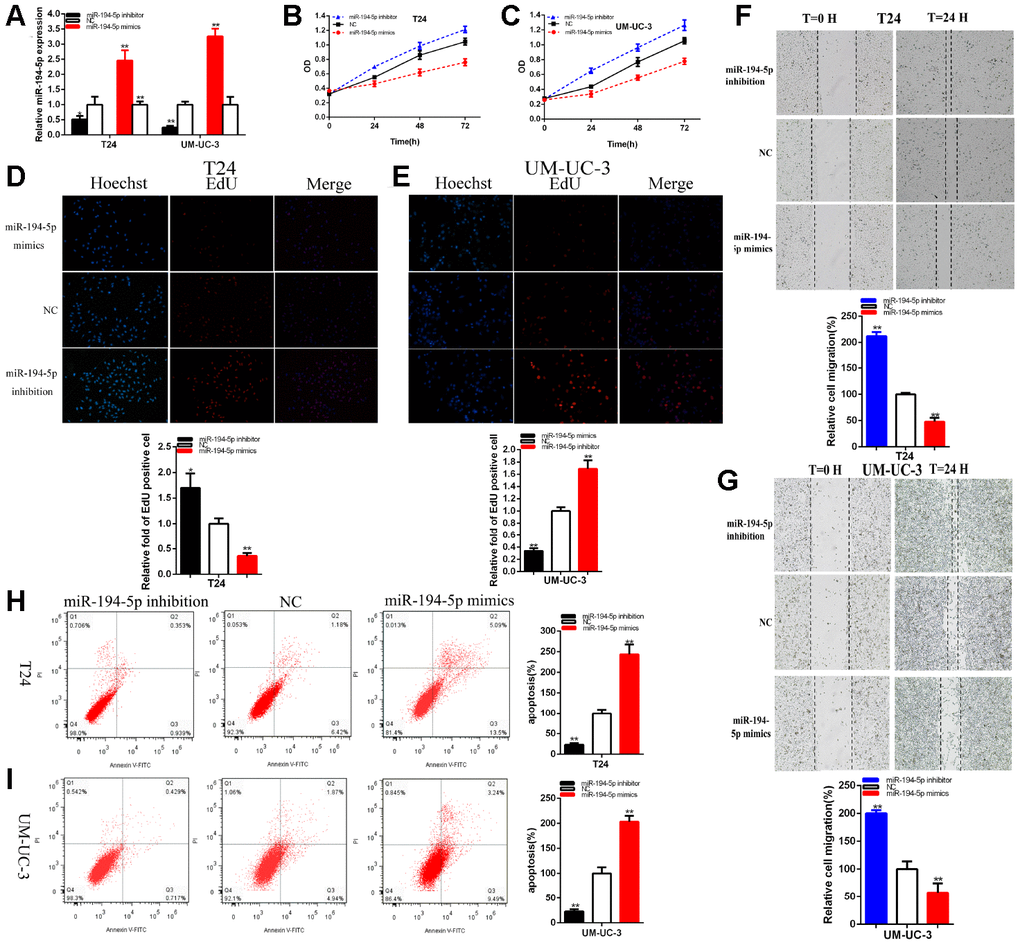
Figure 4. MiR-194-5p acted as the antioncogene. The relative expression level of miR-194-5p was decreased by miR-194-5p inhibitor and increased by miR-194-5p mimics (A). Cell proliferation was detected in both BC cells after the transfection of miR-194-5p inhibitor or mimics (B, C). Representative images of EdU assay and the relative fold changes of EdU positive cells were detected by miR-194-5p inhibitor or mimics (D, E). The relative cell migration was restrained or accelerated after the transfection of miR-194-5p mimics or inhibitor in the T24 and UM-UC-3 (F, G) cell lines. Apoptotic cells were measured after the transfection of miR-194-5p mimics or inhibitor in the T24 and UM-UC-3(H, I) cell lines by flow cytometry analysis. (*P < 0.05, **P < 0.01).
The results demonstrated that miR-194-5p mimics significantly restrained both BC cells proliferation remarkably (Figure 4B, 4C) (p < 0.01). MiR-194-5p inhibitor accelerated both BC cells proliferation (Figure 4B, 4C) (p < 0.01).
The quantity of Edu positive cells in miR-194-5p mimics group was notably decreased about 64.34% in T24 (P= 0.001) and dramatically reduced about 66.34% in UM-UC-3 (P< 0.001) (Figure 4D, 4E). The quantity of Edu positive cells in miR-194-5p inhibitor group was up-regulated about 1.70 times in T24 (P= 0.015) and elevated about 1.69 times in UM-UC-3 (P= 0.001) (Figure 4D, 4E). Our study illustrated that the up-regulation of miR-194-5p restrained BC cells proliferation and suppression of miR-194-5p accelerated BC cells proliferation.
The ratio of the relative migration was down-regulated about 52.10% in T24 (P< 0.001) and decreased about 42.53% in UM-UC-3 (P=0.0002) (Figure 4F, 4G) after the transfection of miR-194-5p mimics. The ratio of the relative migration was up-regulated about 2.121 times in T24 (P< 0.001) and increased about 2.002 times in UM-UC-3 (P=0.0003) (Figure 4F, 4G) after transfection miR-194-5p inhibitor. These data suggested that over-expression of miR-194-5p suppressed BC cells migration and knockdown of mi-194-5p accelerated BC cells migration.
Compared to NC groups, the ratios of apoptosis were gone up about 2.434 times in T24 (P=0.0001) and increased about 2.033 times in UM-UC-3 (P=0.0004) (Figure 4H, 4I) after transfection miR-194-5p mimics. Compared to NC groups, the ratios of apoptosis were lessened about 0.230 times in T24 (P= 0.0002) and about 0.228 times in UM-UC-3 (P=0.0005) (Figure 4H, 4I) after transfection miR-194-5p inhibitor. Ultimately, over-expression of miR-194-5p accelerated BC cells apoptosis and down-regulation of mi-194-5p restrained BC cells apoptosis.
PVT1 sponges miR-194-5p
Compared with si-NC groups, the miR-194-5p expressions were increased about 2.393 times in T24 (P=0.001) and about 3.223 times in UM-UC-3 (P= 0.004) (Figure 5A) in si-PVT1 groups. We used bioinformatics databases to predict some underlying binding sites of PVT1 with miR-194-5p. We verified the predictions by luciferase reporter assay. Our study proved that miR-194-5p mimics significantly suppressed PVT1 wild type reporter luciferase activity. Compared with the co-transfections NC+ pmirGLO-PVT1-Wt, the luciferase activity was notably reduced about 44.31% in T24 (P=0.0002) and about 45.88% in UM-UC-3 (P<0.001) in the co-transfections miR-194-5p mimics + pmirGLO-PVT1-Wt, nevertheless, miR-194-5p could not suppress the PVT1 mutant reporter vector luciferase activity (Figure 5B).
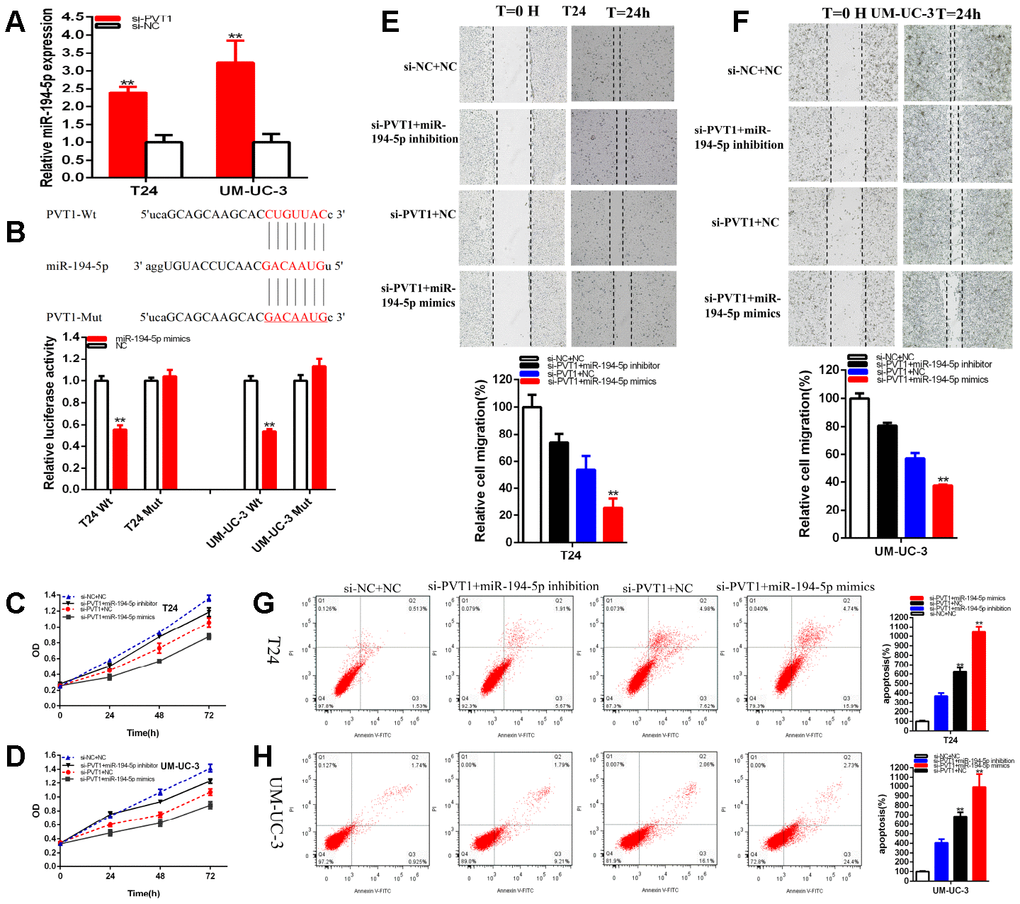
Figure 5. PVT1 was a target of miR-194-5p. The relative expression of miR-194-5p was increased by si-PVT1 (A). Dual-luciferase reporter assays were performed in T24 or UM-UC-3 cells co-transfected with PVT1-Wt or PVT1-Mut and miR-194-5p mimics or NC (B). Cell proliferation was detected in both BC cell lines after co-transfection with si-NC+NC, si-PVT1+miR-194-5p inhibitor or si-PVT1+miR-194-5p mimics (C, D). The relative cell migration after the co-transfection with si-NC+NC, si-PVT1+miR-194-5p inhibitor or si-PVT1+miR-194-5p mimics, and the representative images were as follow (E, F). The apoptotic cells were measured after the co-transfection with si-C+NC, si-PVT1+miR-194-5p inhibitor or si-PVT1+miR-194-5p mimics by flow cytometry analysis (G, H). (*P < 0.05, **P < 0.01).
PVT1 sponging miR-194-5p mediated BC cell progression
The luciferase reporter assays have verified that PVT1 sponged miR-194-5p. Firstly, we must verify that miR-194-5p co-regulated the repressive progression induced by knockdown PVT1 in BC cells. That si-PVT1 co-transfected miR-194-5p mimics could manifest more powerfully suppressed effects on BC cells proliferation (Figure 5C, 5D) and migration (Figure 5E, 5F) than si-NC co-transfection with NC (si-NC+NC). Meanwhile, compared with si-NC+NC group, apoptosis was accelerated in si-PVT1 co-transfection miR-194-5p mimics (si-PVT1+miR-194-5p mimics) group (Figure 5G, 5H). Conversely, miR-194-5p inhibitor could partially reverse inhibited effects on BC cells progression induced by si-PVT1.
The CCK-8 assays have manifested that si-PVT1 co-transfected miR-194-5p mimics (Figure 5C, 5D) remarkably restrained both BC cells proliferation in (p<0.01 in T24 and UM-UC-3). At the same time, miR-194-5p inhibitor could partially reverse inhibited effects on BC cells proliferation induced by si-PVT1 (Figure 5C, 5D).
Compared with si-NC+NC, si-PVT1 co-transfected miR-194-5p mimics could decrease the ratio of the relative migration about 77.28% in T24 (P= 0.0003) and about 62.39% in UM-UC-3 (P< 0.001). Moreover, miR-194-5p inhibitor could partially reverse inhibited effects on BC cells migration induced by si-PVT1 and increased about 19.86% in T24 and about 23.55% in UM-UC-3 cell lines (Figure 5E, 5F).
Compared with si-NC+NC, si-PVT1 co-transfected miR-194-5p mimics could accelerate the ratio of the relative apoptosis about 10.44 times in T24 (P<0.001) and about 9.91 times in UM-UC-3 (P<0.001), what’s more, miR-194-5p inhibitor could partially reverse promoting apoptosis on BC cells migration induced by si-PVT1 and reduced about 255.36% in T24 and about 277.04% in UM-UC-3 (Figure 5G, 5H).
PVT1 sponging miR-194-5p closely promoted BCLAF1 expression
Compared with para-carcinoma tissues, the relative expression level of BCLAF1 was significantly increased about 1.82 times of BC samples (P=0.002) (Figure 6A). Compared with si-NC groups, the BCLAF1 expressions were decreased about 59.97% in T24 (P=0.001) and about 48.52% in UM-UC-3 (P=0.025) (Figure 6B) in si-PVT1 groups. Compared with NC groups, the BCLAF1 expressions were decreased in T24 and UM-UC-3 (P<0.01) after the transfection of miR-194-5p mimics and were up-regulated in T24 and UM-UC-3 (P<0.01) after the transfection of miR-194-5p inhibition (Figure 6C).
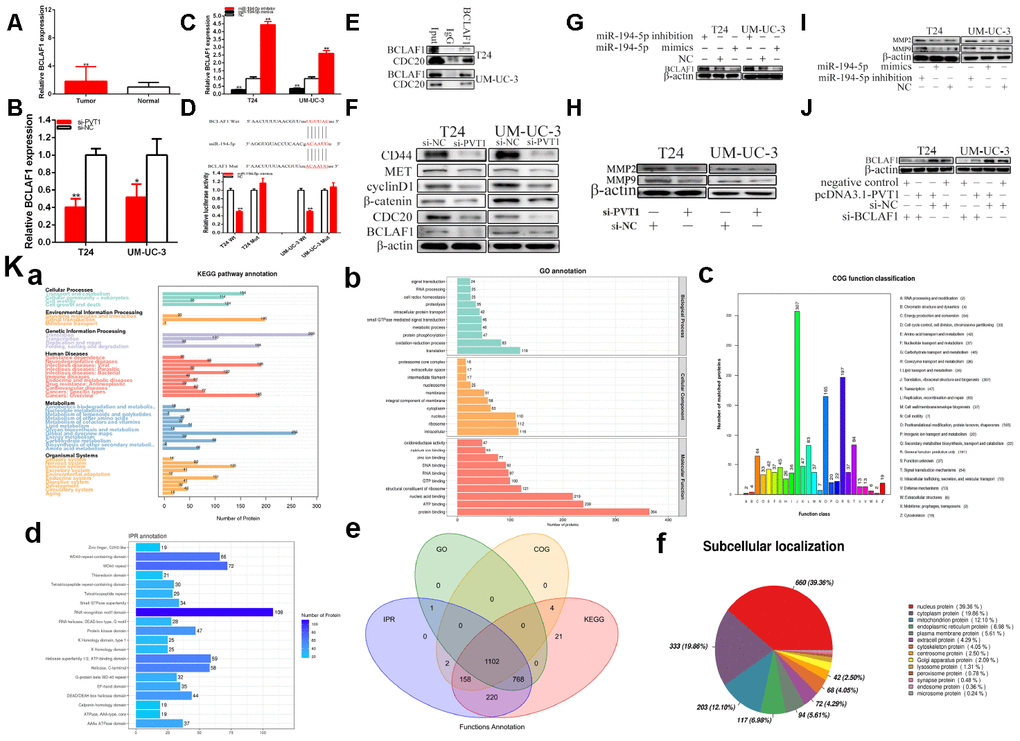
Figure 6. PVT1 regulates BCLAF1 expression via sponging miR-194-5p. The relative expression patterns of BCLAF1 were detected in paired bladder carcinomas tissues and normal tissues (A). The relative expression of BCLAF1 was reduced by si-PVT1 (B). Overexpressing miR-194-5p down-regulated BCLAF1 expression and knockdown of miR-194-5p up-regulated BCLAF1 expression in BC cells (C). Dual-luciferase reporter assay showed BCLAF1-Wt and miR-194-5p mimics co-transfection restrained luciferase activity (D). Immunoprecipitation assays were used to identify proteins associated with BCLAF1. The anti- BCLAF1 and IgG antibody were incubated with cell extracts and CDC20 was identified to be a BCLAF1-binding protein in the cancer cell line (E). Knockdown of PVT1 decreased BCLAF1 etc. expression in BC cells (F). Overexpressing miR-194-5p decreased BCLAF1 expression and knockdown of miR-194-5p increased BCLAF1 expression in BC cells (G). Knockdown of PVT1 decreased MPP2 and MPP9 expression in BC cells (H). Overexpressing miR-194-5p decreased MPP2 and MPP9 expression and knockdown of miR-194-5p increased MPP2 and MPP9 expression in BC cells (I). Knockdown of BCLAF1 reversed BCLAF1 expression promotion induced by overexpression PVT1 in BC cells (J). IP pyrolysis products are used for proteomics detection (Ka–f): a-KEGG, b-GO, c-COG, d-IPR, e-function annotation, f-subcellular localization (*P < 0.05, **P < 0.01).
We used bioinformatics databases to predict BCLAF1 with miR-194-5p possible mutual binding sites, which was shown as Figure 6D. The predicted binding sites and binding effects were manifested through luciferase reporter assay.
Compared with the co-transfections with NC + pmirGLO-PVT1-Wt, our results have confirmed that miR-194-5p mimics dramatically restrained BCLAF1 wild type reporter luciferase activity, which decreased about 49.66% in T24 (p< 0.001) and about 49.47% in UM-UC-3 (p<0.001) in the co-transfection with miR-194-5p mimics + BCLAF1C-3’UTR-Wt. Inversely, miR-194-5p mimics could not restrain the BCLAF1 mutant binding sites reporter vector luciferase activity (Figure 6D).
We identified that protein is associated with BCLAF1 through immunoprecipitation (IP/co-IP) assays. CDC20 was detected to be a BCLAF1-binding protein in the bladder cell lines (Figure 6E). At the same time, IP pyrolysis products are used for proteomics detection (Figures 6Ka–f), which was furthermore proved that BCLAF1 bound multiple functional proteins in BC cells, and KEGG, GO and other analysis were performed (Also as shown as the GO.anno,KEGG.anno and Subcellular.localization_anno), and we further revealed that BCLAF1 could interact with CDC20.
Our study proved that the relative expression level of PVT1 was closely related to BCLAF1 expression and down-regulation of PVT1 could reduce BCLAF1 expression in BC cells. Our further experiments confirmed that restrained PVT1 referred to the WNT signaling in BC cells (Figure 6F). Western blotting was used to detect the WNT signaling that is associated downstream genes expression. Knockdown of PVT1 decreased CD44, MET, cyclinD1, CDC20, BCLAF1 and β-catenin expression in BC cells. Therefore, the down-regulation of PVT1 inhibited the progression of BC cells through inhibition of the Wnt/β-catenin signaling pathway because β-catenin was the vital protein in this signaling pathway.
We must confirm whether PVT1 increased BCLAF1 expression via miR-194-5p-dependent manner in BC cells. Our studies proved that over-expression of miR-194-5p reduced BCLAF1 expression and miR-194-5p inhibition up-regulated expression of BCLAF1 in BC cells (Figure 6G). Our experiments indicated that PVT1 could closely promote BCLAF1 expression via sponging miR-194-5p in BC cells.
The knockdown of PVT1 caused the reduction of MMP-2 and MMP-9 (Figure 6H). Thus, we concluded that the knockdown of PVT1 suppressed the migration of BC cell lines, which is in accordance with that after transfection miR-194-5p inhibition and mimics. Over-expression miR-194-5p decreased MPP2 and MPP9 expression and the knockdown of miR-194-5p increased MPP2 and MPP9 expression in BC cells (Figure 6I). Therefore, we concluded that PVT1 and miR-194-5p referred to the migration of BC cell lines.
PVT1 accelerated malignant phenotypes of BC cells via BCLAF1-dependent manner
We should confirm whether PVT1 accelerated malignant phenotypes via BCLAF1-dependent manner in BC cells. Further experiments proved that knockdown of BCLAF1 dramatically reversed the promotion of BCLAF1 expression induced by over-expression of PVT1 in BC cells (Figure 6J). Moreover, the knockdown of BCLAF1 reversed BC cells proliferation promotion (Figure 7A–7D) induced by over-expression of PVT1. And BCLAF1 knockdown could reverse BC cells migration (Figure 7E, 7F) induced by over-expression of PVT1. Meanwhile, knockdown of BCLAF1 could notably reverse BC cells apoptosis suppression (Figure 7G, 7H) induced by over-expression of PVT1. Our studies proved that PVT1 could accelerate malignant phenotypes of BC cells via BCLAF1-dependent manner.
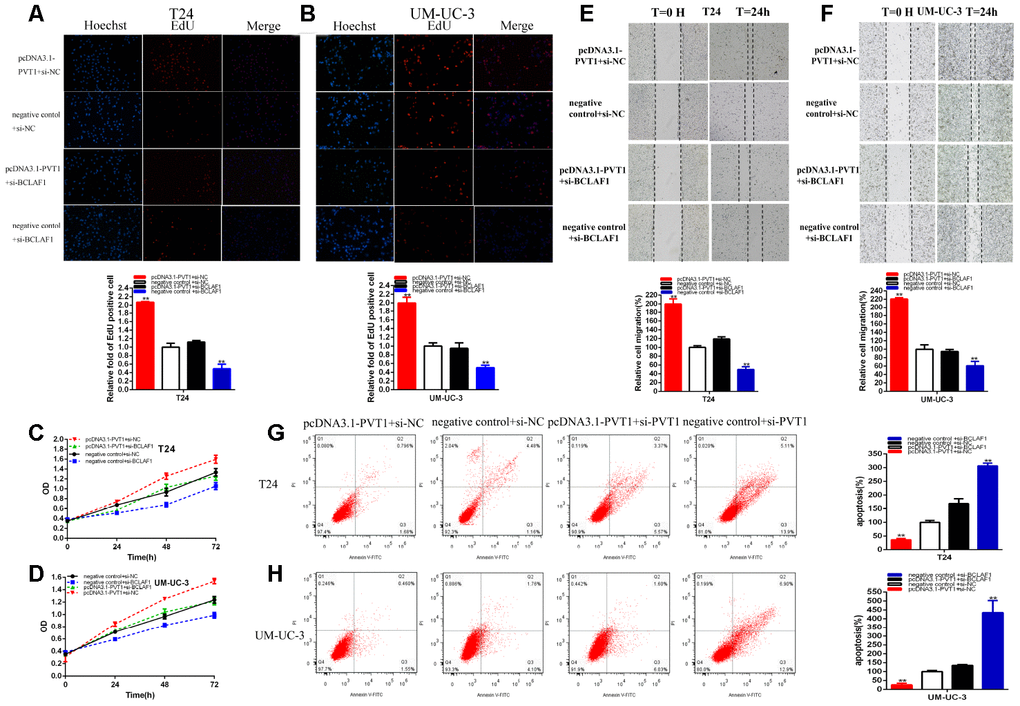
Figure 7. PVT1 positively regulates BCLAF1 expression via sponging miR-194-5p. Knockdown BCLAF1 significantly reversed cell proliferation promotion induced by Overexpression PVT1(EdU, A, B, CCK8, C,D). Knockdown BCLAF1 significantly reversed cell migration promotion induced by overexpression PVT1(E, F). Knockdown BCLAF1 significantly reversed cell apoptosis inhibition induced by overexpression PVT1 (G, H). (*P < 0.05, **P < 0.01).
The relative expression levels of miR-194-5p were significantly decreased in about 69.80% in SV-HUC-1 (p=0.0002) (Figure 8A). MiR-194-5p inhibition notably promoted bladder cells proliferation (Figure 8B) (p < 0.01). The ratio of the relative migration was up-regulated about 2.109 times in SV-HUC-1 (P= 0.026) (Figure 8C) after transfection miR-194-5p inhibitor.
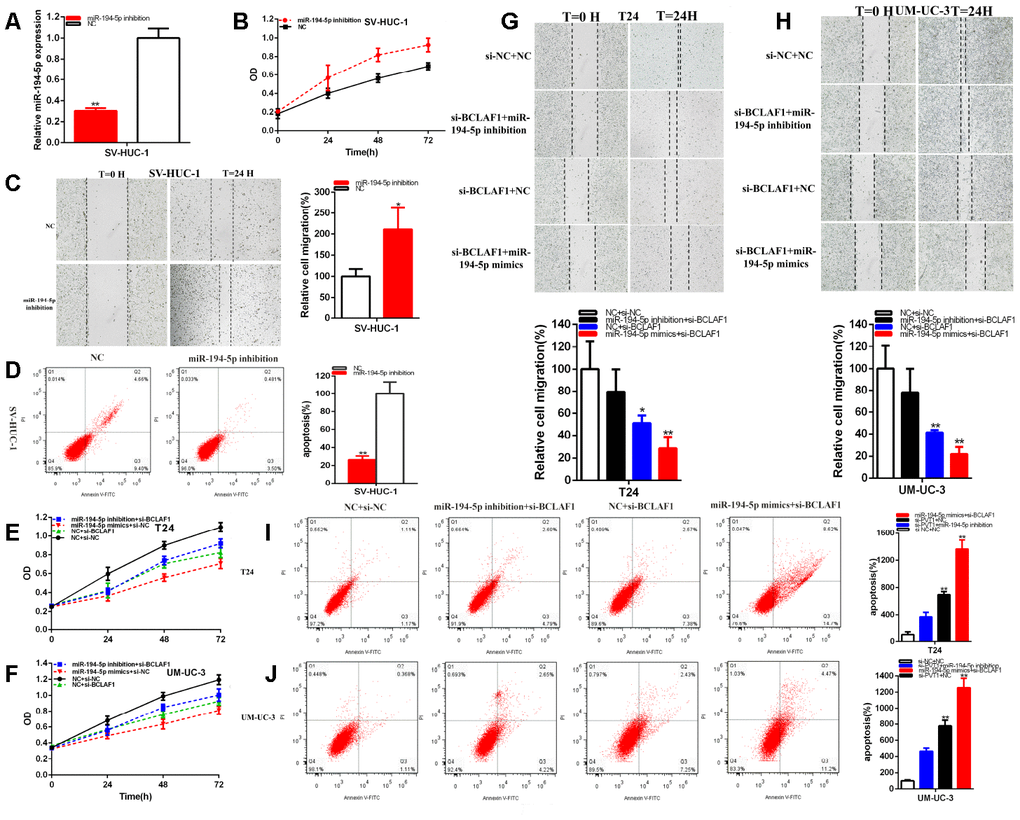
Figure 8. MiR-194-5p positively regulates BCLAF1 expression. The relative expression level of miR-194-5p was reduced by miR-194-5p inhibitor in SV-HUC-1 (A). Cell proliferation was detected in SV-HUC-1 after transfection of miR-194-5p inhibitor (B). The relative cell migration was accelerated after transfection of miR-194-5p inhibitor in the SV-HUC-1 (C). Apoptotic cells were measured after transfection of miR-194-5p inhibitor in SV-HUC-1 (D). Cell proliferation was detected in both bladder carcinomas cell lines after co-transfection with si-NC+NC and si-BCLAF1+miR-194-5p inhibitor or mimics (E, F). The relative cell migration after co-transfection with si-NC+NC, si-BCLAF1+miR-194-5p inhibitor or mimics, and the representative images were as follow (G, H). The apoptotic cells were measured after co-transfection with si-C+NC, si-BCLAF1+miR-194-5p inhibitor or mimics by flow cytometry analysis (I, J). (*P < 0.05, **P < 0.01).
These data suggested that the knockdown of mi-194-5p accelerated bladder cells migration. Compared with NC groups, the ratios of apoptosis were lessened about 0.264 times in SV-HUC-1 (P= 0.0008) (Figure 8D) after transfection miR-194-5p inhibitor.
MiR-194-5p co-regulated the repressive progression induced by knockdown BCLAF1 in BC cells. That si-BCLAF1 co-transfected miR-194-5p mimics could manifested more powerfully suppressed effects on BC cells proliferation (Figure 8E, 8F) and migration (Figure 8G, 8H) than si-NC co-transfection with NC (si-NC+NC), meanwhile, compared with si-NC+NC group, apoptosis was accelerated in si-BCLAF1 co-transfection miR-194-5p mimics (si-BCLAF1+miR-194-5p mimics) group (Figure 8I, 8J). Conversely, miR-194-5p inhibitor could partially reverse inhibited effects on BC cells progression induced by si-BCLAF1.
Knockdown of PVT1 suppressed BC cells tumorigenicity
The generation of xenograft was used to confirm whether PVT1 promoted the tumorigenicity of BC cells. Our experiments proved that the knockdown of PVT1 could restrain the tumorigenicity of BCs in vivo (Figure 9A–9F). Solid tumors that were obtained from mice were displayed in Figure 9A. It was confirmed that the relative expression of PVT1 was reduced in LV-shPVT1 groups compared with LV-shNC group of BC cells in vivo (Figure 9B). Tumor weight was lessened in LV-shPVT1 groups than LV-shNC groups in vivo (Figure 9C). Tumor growth was slower in LV-shPVT1 groups than LV-shNC groups in vivo (Figure 9D). Our experiments revealed that the knockdown of PVT1 could reduce CD44, MET, cyclinD1, CDC20, BCLAF1 and β-catenin expression of BC cells in vivo (Figure 9E). IHC experiments proved that the knockdown of PVT1 restrained Ki-67 and BCLAF1 expression (Figure 9F) of BC cells in vivo. Our experiments proved that PVT1 facilitated the tumorigenicity of BC via up-regulating BCLAF1.
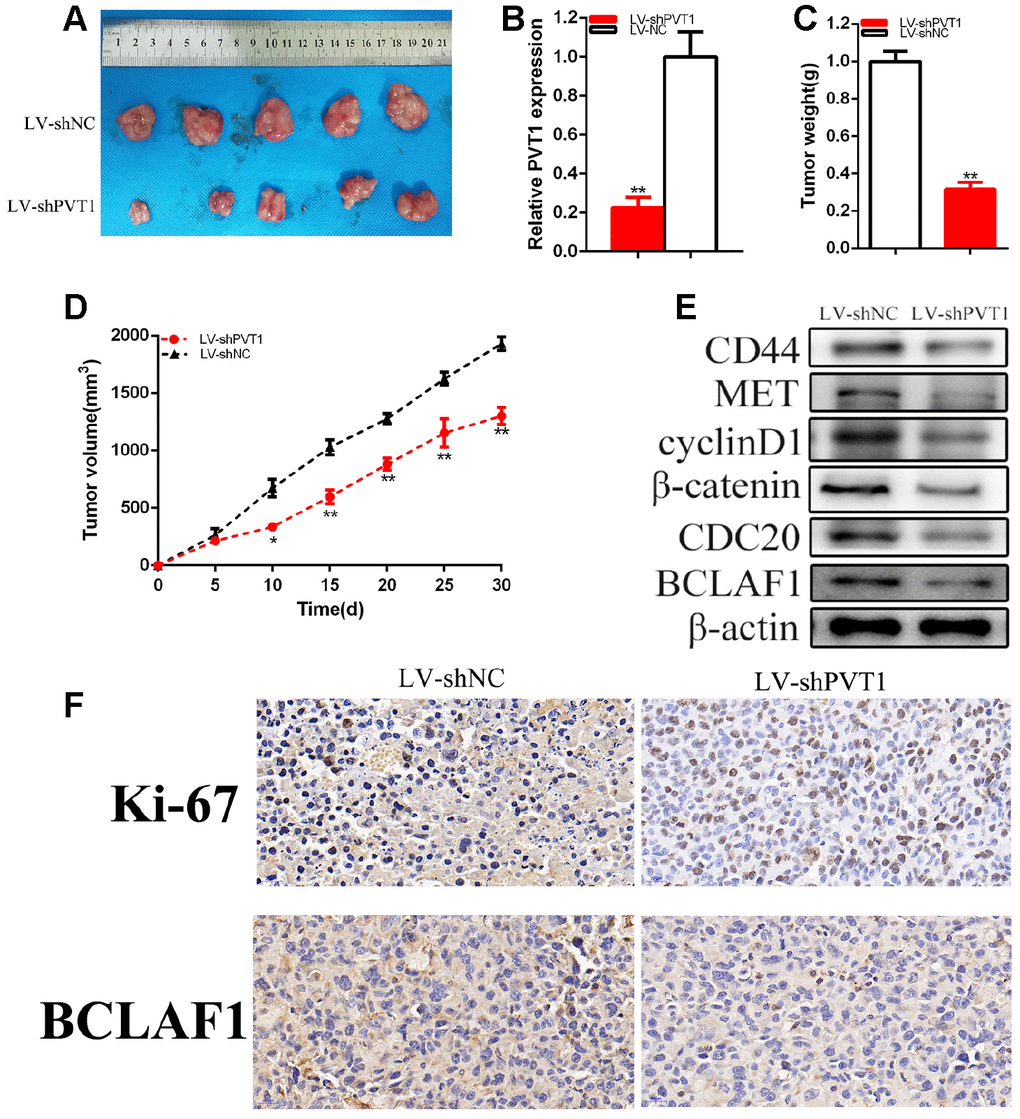
Figure 9. Knockdown of PVT1 suppressed BC cells tumorigenicity. Tumors collected from mice were exhibited (A). The relative expression level of PVT1 was reduced by LV-PVT1 (B). Tumor weight of LV-PVT1 or LV-shNC groups were measured (C). Tumor volume curve of LV-shPVT1 or LV-shNC groups were measured (D). Knockdown of PVT1 down-regulated BCLAF1 etc. expression (E). Knockdown of PVT1 decreased Ki-67 and BCLAF1 expression of BC cells in vivo (F). (*P < 0.05, **P < 0.01).
As simulated diagram shown as Figure 10, PVT1 acts as a microRNA sponge that actively promotes the expression of BCLAF1 to sponge miR-194-5p and subsequently increases malignant phenotypes of BC cells. PVT1 is dramatically upregulated in BC cells and PVT1 could sponge miR-194-5p to closely promote BCLAF1 expression. Up-regulated BCLAF1 protein could facilitate transcription and translation of proteins operating through indispensably abnormal protein signaling pathways, and subsequently accelerate malignant phenotypes of BC cells.
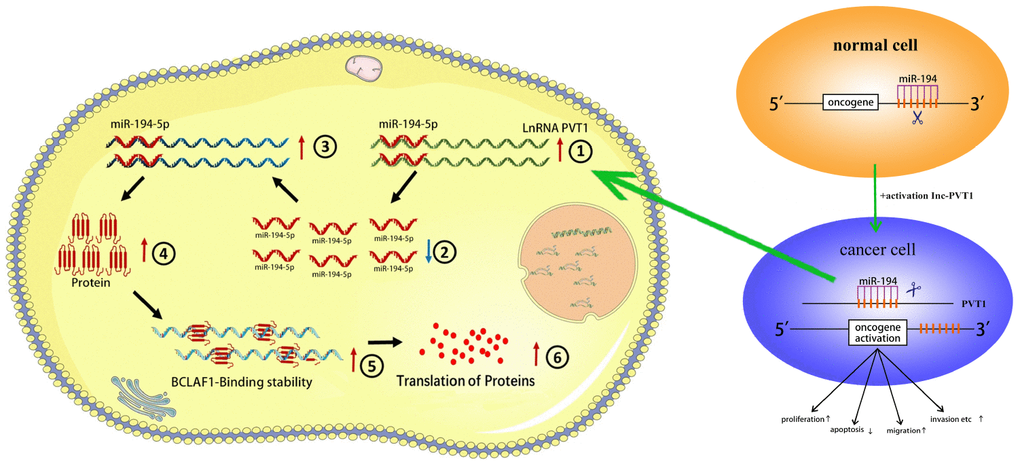
Figure 10. The schematic diagram of the oncogenic role of PVT1 in BC cells. PVT1 functions as a miRNA sponge to positively regulate the expression of BCLAF1 through sponging miR-194-5p and subsequently promotes malignant phenotypes of BC cells, and thus it plays an oncogenic role in BC pathogenesis.
Discussion
In terms of LncRNAs, transcripts are longer than 200 nucleotides, and lncRNAs are the main members of non-coding RNAs family [14, 17, 21, 23, 28]. Various literature reveal that lncRNAs play vital functions in genes’ regulation, and could regulate biological processes varying in different methods, such as regulating transcription, sponging miRNA, and modifying epigenetic regulation and so on [30–38]. LncRNAs also refer to tumor proliferation, apoptosis, invasion and migration [40, 42, 46, 56, 59], which broaden our knowledge about the biological behavior of diseases especially in bladder carcinomas. Meanwhile, miRNAs are is a kind of classic and potential biomarkers and key regulators in some hot spots included tumor, and play similar roles, including oncogenes, tumor suppressor genes in tumors, regulating the proliferation, migration, apoptosis and other important biological behaviors of tumor cells [17, 18, 20, 23]. Various literatures concluded that lncRNAs were closely related with miRNAs, and our study further confirmed the mutual relationship with them [26, 28, 35–37, 57, 59].
PVT1 is located in chromosome 8q24.21 that is a vulnerable site prone to genetic abnormalities, and it is also the star molecule in the long non-coding RNA family. Its role was demonstrated in other tumors, and has been manifested to be up-regulated in some tumor tissues, including osteosarcoma, squamous carcinoma, lung carcinomas, gastric carcinomas, liver carcinomas, colorectal carcinomas, nasopharyngeal carcinoma and so on [32–37]. PVT1 could involve in the development and progression of cancer, and could play an oncogenic role [38, 41–49]. Nevertheless, the correlation with PVT1 and miR-194-5p was rarely studied in bladder carcinomas.
Various literatures proved the mutual function between lncRNAs and miRNAs [22, 23, 26, 28, 30, 32–37] and our article further described this relationship. LncRNAs act as miRNAs sponges or baits, titrating the miRNAs concentration, thereby restraining miRNAs from binding to specific mRNAs. Numerous literatures have reported the roles of PVT in various tumors. [32–49].
PVT1 regulated oral squamous cell carcinoma by sponging miR-28-5p [34], and non-small cell Lung cancer by sponging miR-17-5p or miR-526b [35, 36], and gastric cancer cells by sponging miR-125 [37], and gallbladder by sponging miR-143. [40], pancreatic ductal adenocarcinoma by sponging miR-20a-5p [45] and so on. Our experiment is consistent with the above researches.
This report elucidated the mutual function between PVT1 and miR-194-5p in bladder carcinomas. Our study revealed that PVT1 sponging miR-194-5p could be the biomarker and therapeutic target for the diagnosis and treatment in the bladder carcinomas.
PVT1 expression was significantly up-regulated in BC samples and cell lines. Most importantly, PVT1 expression was closely related to histological grade and TNM stage in the bladder carcinomas. Our further experiments proved that the down-regulation of PVT1 expression could restrain BC cells proliferation or migration and up-regulate apoptosis and so on. The overexpression of PVT1 accelerated cell proliferation, migration and anti-apoptosis in SV-HUC-1. Our further experiments of the nude mice animals illustrated that the knockdown of PVT1 inhibited tumorigenicity and lessened tumor volume and weight in vivo.
LncRNAs could act as sponges to be saturated with miRNAs. However, these different expressions of lncRNAs and miRNAs in various cancers could lead to diverse binding effects. Bioinformatics predicted potential sites to study the mechanism of PVT1 in bladder carcinomas. MiR-194-5p was the underlying targets to be predicted and has been verified. MiR-194-5p was the up-regulation induced by knockdown of PVT1. Moreover, miR-194-5p was down-regulated in BC samples and cell lines. Histological grade and TNM stage were closely related to miR-194-5p expression. MiR-194-5p mimics restrained bladder carcinoma cell progression, however miR-194-5p inhibitor was converse. MiR-194-5p acted as the tumor suppressor gene through regulating BCLAF1 expression. In addition, the knockdown of PVT1 induced miR-194-5p over-expression and dramatically restrained the malignant behaviors of BC cells. Down-regulated miR-194-5p partially rescued the suppression induced by knockdown of PVT1. Our studies displayed that PVT1 could sponge miR-194-5p to participate in the progression of the bladder carcinomas.
As we all known, miRNAs are through the indirect role of protein regulation of life activities and the target genes are regulated by binding to the 3'UTR of specific mRNAs, inducing degradation or transcriptional suppression of the target genes. We predicted potential target genes of miR-194-5p with biological software and explored its mechanism in the bladder carcinomas. Luciferase reporter assay proved that BCLAF1 was the common target gene of miR-194-5p and BCLAF1 played the important role in regulating the evolution of tumors. Various literatures have reported BCLAF1 roles in some carcinomas’ tumorigenesis, such as hepatocellular carcinoma [60] and acute myeloid leukemias tumorigenesis [61].
Up-regulation of miR-194-5p restrained BCLAF1 expression, however, down-regulation of miR-194-5p up-regulated BCLAF1 expression. Therefore, the expression of BCLAF1 was negatively related to miR-194-5p expression. Our studies exhibited that the knockdown of BCLAF1 could reverse malignant BC cells phenotypes promotion induced by PVT1 up-regulation. For example, the knockdown of BCLAF1 dramatically reversed BC cells proliferation and migration promotion induced by PVT1 up-regulation, and clearly reversed BC cells apoptosis suppression induced by PVT1 up-regulation. MiR-194-5p/BCLAF1 axis may be pivotal in the BC cells progression.
In all, our studies manifested that PVT1 downregulation could up-regulate miR-194-5p expression and subsequently restrain BCLAF1 expression as the ceRNA-dependent manner. Furthermore, up-regulated miR-194-5p reversed BCLAF1 expression and BCLAF1 reduction reversed the malignant BC cells phenotypes promotion induced by overexpression of PVT1. The experiments opened up a new thought for novel molecular targets of human carcinomas, particularly in the bladder carcinoma, which broadened our comprehension on lncRNA-miRNA-proteins methods in illness evolution, and provided us an orientation to ulterior explore the disease’s occurrence mechanism, and provide theoretical basis for the new treatment as well. That could be transformed into more fresh and valid remedial method for BC, which could be brought more brilliant prospects for mankind to radically cure BC thus altering the current diagnostic and therapeutic bottleneck for numerous cancer patients, especially advanced BCs in the future.
Conclusions
The experiments proved that PVT1 could sponge miR-194-5p to closely promote BCLAF1 expression and subsequently accelerate the malignant BC cells’ phenotypes, and therefore could act as the carcinogene in the BCs. Our experiments could provide some useful directions to further exploration on its pathogenesis of the progression and development of the BC. In conclusion, the experiments revealed that PVT1-miR-194-5p-BCLAF1 axis could play the significant roles in the progression and development of BCs. PVT1 and miR-194-5p are novel and important tumor biomarkers, and could be some underlying diagnostic biomarkers and remedial targets for malignant BC in the future.
Materials and Methods
Patient specimens
Our study included BC patients who received tumorectomy. We quick-freeze the BC specimens and paired normal peritumoral specimens in liquid nitrogen quickly after resection. Every one patient has signed the written informed consent. The first affiliated hospital of Soochow University research ethics committee approved the experiment.
Cell lines and cell culture
T24, UM-UC-3 and SV-HUC-1 were obtained from the Institute of Cell Biology, Chinese Academy of Sciences in Shanghai. T24 and UM-UC-3 cells were cultivated in DMEM (Gibco, USA). SV-HUC-1 cells were cultivated in F12 (Life technologies, USA). 1% antibiotics (100 U/ml penicillin and 100 μg /ml streptomycin sulfates) and 10% FBS were blended in DMEM and F12. The atmosphere of the incubator is at 37° C and 5% CO2.
Cell transfection
Specific siRNA oligonucleotides were transiently transfected in T24, UM-UC-3 and SV-HUC-1 cells, si-PVT1 sense (5-CAGCTTCAACCCATTACGATT-3), si-BCLAF1 sense (5-GGTTCACTTCGTATCAGAA), si-NC and si-RNA (si-PVT1, si-BCLAF1) were obtained from Gene Pharma (Suzhou, China). Optimum density BC cells were cultivated and then transfected in 6-well plates. The plasmid vectors (pcDNA3.1-PVT1, negative control) were obtained from Gene Script (Nanjing, China). Cells were cultured for 24 hours before transfection. The cells were then transiently transfected with the corresponding vectors using Lipofectamine 3000 Transfection Reagent based on the product description. After 48 hours, cells transfected with the corresponding vector were collected.
RT-qPCR
Based on the product descriptions, the whole RNA was extracted from the specimens or the transfected cells using TRIzol reagent (Invitrogen, USA). The cDNA was synthesized from total RNA applying the Prime Script RT Reagent Kit with gDNA Eraser (Takara, Japan). The relative expression levels of PVT1 were measured by RT-qPCR with SYBR Premix Ex Taq II (Takara) on the CFX96 sequence detection system (Bio-Rad). The primer sequences were displayed in Supplementary Table 1. The endogenous controls were Glyceraldehyde 3-phosphate dehydrogenase (GAPDH) and U6 small nuclear RNA. The relative quantification method (2-ΔΔCt) was adopted to calculate the expressions that were normalized to endogenous controls.
Cell proliferation assays
CCK-8 (Beyotime, Shanghai) was applied to cell proliferation based on the product descriptions. Cells were incubated in a 96-well plate for 24 hours and then respectively transfected with siRNAs or plasmids in the CCK-8 assays. 0, 24, 48 and 72 h after transfection, the absorbance in each well was measured at by a microplate reader (Bio-Rad, USA).
EdU incorporation assay
EdU (Ethynyl-2-deoxyuridine) Apollo DNA in vitro kit (RIBOBIO, Guangzhou) was also used for cell proliferation that was detected by EdU incorporation assay based on the product descriptions. In a word, cells transfected siRNA or plasmid and were incubated with 100 μl of 50 μM EdU per well for 2 h at 37° C, respectively. Cells were visualized under a fluorescence digital camera system.
Cell migration assay
The cells were cultivated into the 6-well plates in the incubator. About 90% confluence was obtained before the transfection siRNA or plasma transfected cells. Use the sterilization 200ul pet tips to generate clean lines in 6-well plates. Use digital camera system to take photos in each well quickly. A day later, the picture was taken again. The travel distance is set at 0 and 24 hours.
Flow cytometry assay
SiRNAs or plasmid vectors were respectively transfected in bladder T24, UM-UC-3 and SV-HUC-1 cells. For 48 hours after transfection, cells were collected and resuspended in fixation fluid 5 μl of Annexin V-FIFC and 10 μl of propidium iodide were added to 195 μl of cell suspension. Flow cytometry (Beckman, USA) was applied to detect cell apoptosis.
Western blot analysis
Protein was separated by 10% SDS–PAGE and transferred to PVDF membranes. After blocking in the 5% non-fat milk and the membranes were incubated overnight for at least 16h in 4° C with the primary antibody. At room temperature for 1-2h, the membranes were then incubated with a secondary antibody and enhanced chemiluminescence ECL kit (Beyotime Biotechnology, China) was visualized. β-actin was the internal standard, and the antibodies were demonstrated in Supplementary Table 2.
Dual-luciferase assays
Based on the product descriptions, dual-Luciferase Reporter Assay System (Promega, USA) was used for the Dual-luciferase reporter assays. The binding and mutant sequences were respectively cloned into pmirGLO Dual-luciferase vectors (Fubio Biological Technology Co, Suzhou, China). PVT1, BCLAF1 WT or Mut constructed and co-transfected along with miR-194-5p mimics or NC, and then transfected with Lipofectamine 3000 and incubated for 48 h. Microplate reader was applied to measure the luciferase activities.
Mouse model experiments
Our experiment was approved by Institutional Ethics Review Board of Soochow University. 5-wk old male BALB/c nude mice were divided into two groups and each group included 5 mice. LV-PVT1 and LV-NC were purchased from Genechem (Shanghai, China). 2×10⁶ UM-UC-3 cells were injected into the mice dorsal flank regions. Every 5 days, tumor growth was measured. The formula, a*b2/2 (a represents the long diameter and b refers to the short diameter), was used to calculate tumor volume. Mice were executed after 30 days and the subcutaneous weight of each tumor was measured.
Statistical analysis
Assays were performed in triplicate at least and data were shown as mean ± standard deviation (SD) of those biological replicates or samples. SPSS 20.0 software (IBM, Chicago, IL, USA) etc. were used to analyze assays’ statistical analyses. Paired samples t-test was used to analyze the relative expression of PVT1 and miR-194-5p. ANOVA was used to analyze CCK-8 assay data. The independent samples t-test was used to analyze other data. P< 0.05 was regarded as the statistically significant one.
Supplementary Materials
Author Contributions
Mingwei Chen and Jianquan Hou designed the study; Mingwei Chen and Rongyuan Zhang, Chunyang Chen and KeKe Ding performed experiments; Mingwei Chen, Le Lu, Xuedong Wei and Yuhua Huang involved to collect data; Mingwei Chen wrote the manuscript; Mingwei Chen, Guangbo, Zhang and Jianquan Hou reviewed the paper.
Conflicts of Interest
There is no conflicts of interest.
Funding
The present study was supported by grants from the National Natural Science Foundations of China (81702511, 81472401,81772708 and 2016YFA0201204), Jiangsu Provincial Key Medical Discipline (ZDXKA2016012), Clinical Medicine Center of Suzhou (SZZXJ201501), and programs for Recruitment of Clinical Medical Top Team of Suzhou.
References
- 1. Kurtova AV, Xiao J, Mo Q, Pazhanisamy S, Krasnow R, Lerner SP, Chen F, Roh TT, Lay E, Ho PL, Chan KS. Blocking PGE2-induced tumour repopulation abrogates bladder cancer chemoresistance. Nature. 2015; 517:209–13. https://doi.org/10.1038/nature14034 [PubMed]
- 2. Lee SH, Hu W, Matulay JT, Silva MV, Owczarek TB, Kim K, Chua CW, Barlow LJ, Kandoth C, Williams AB, Bergren SK, Pietzak EJ, Anderson CB, et al. Tumor evolution and drug response in patient-derived organoid models of bladder cancer. Cell. 2018; 173:515–28.e17. https://doi.org/10.1016/j.cell.2018.03.017 [PubMed]
- 3. Zhai B, Wu Q, Wang W, Zhang M, Han X, Li Q, Chen P, Chen X, Huang X, Li G, Zhang Q, Zhang R, Xiang Y, et al. Preparation, characterization, pharmacokinetics and anticancer effects of PEGylated β-elemene liposomes. Cancer Biol Med. 2020; 17:60–75. https://doi.org/10.20892/j.issn.2095-3941.2019.0156 [PubMed]
- 4. Yang Z, Wang H, Zhang N, Xing T, Zhang W, Wang G, Li C, Yu C. Chaetocin abrogates the self-renewal of bladder cancer stem cells via the suppression of the KMT1A-GATA3-STAT3 circuit. Front Cell Dev Biol. 2020; 8:424. https://doi.org/10.3389/fcell.2020.00424 [PubMed]
- 5. Korac-Prlic J, Degoricija M, Vilović K, Haupt B, Ivanišević T, Franković L, Grivennikov S, Terzić J. Targeting Stat3 signaling impairs the progression of bladder cancer in a mouse model. Cancer Lett. 2020; 490:89–99. https://doi.org/10.1016/j.canlet.2020.06.018 [PubMed]
- 6. Zhai B, Chen P, Wang W, Liu S, Feng J, Duan T, Xiang Y, Zhang R, Zhang M, Han X, Chen X, Li Q, Li G, et al. An ATF24 peptide-functionalized β-elemene-nanostructured lipid carrier combined with cisplatin for bladder cancer treatment. Cancer Biol Med. 2020; 17:676–692. https://doi.org/10.20892/j.issn.2095-3941.2020.0454 [PubMed]
- 7. Wang H, Niu X, Jiang H, Mao F, Zhong B, Jiang X, Fu G. Long non-coding RNA DLX6-AS1 facilitates bladder cancer progression through modulating miR-195-5p/VEGFA signaling pathway. Aging (Albany NY). 2020; 12:16021–16034. https://doi.org/10.18632/aging.103374 [PubMed]
- 8. Yang Z, Chen J, Xie H, Liu T, Chen Y, Ma Z, Pei X, Yang W, Li L. Androgen receptor suppresses prostate cancer metastasis but promotes bladder cancer metastasis via differentially altering miRNA525-5p/SLPI-mediated vasculogenic mimicry formation. Cancer Lett. 2020; 473:118–29. https://doi.org/10.1016/j.canlet.2019.12.018 [PubMed]
- 9. Yao J, Qian K, Chen C, Liu X, Yu D, Yan X, Liu T, Li S. ZNF139/ circZNF139 promotes cell proliferation, migration and invasion via activation of PI3K/AKT pathway in bladder cancer. Aging (Albany NY). 2020; 12:9915–34. https://doi.org/10.18632/aging.103256 [PubMed]
- 10. Chen M, Zhuang C, Liu Y, Li J, Dai F, Xia M, Zhan Y, Lin J, Chen Z, He A, Xu W, Zhao G, Guo Y, et al. Tetracycline-inducible shRNA targeting antisense long non-coding RNA HIF1A-AS2 represses the Malignant phenotypes of bladder cancer. Cancer Lett. 2016; 376:155–64. https://doi.org/10.1016/j.canlet.2016.03.037 [PubMed]
- 11. Li J, Zhuang C, Liu Y, Chen M, Chen Y, Chen Z, He A, Lin J, Zhan Y, Liu L, Xu W, Zhao G, Guo Y, et al. Synthetic tetracycline-controllable shRNA targeting long non-coding RNA HOXD-AS1 inhibits the progression of bladder cancer. J Exp Clin Cancer Res. 2016; 35:99. https://doi.org/10.1186/s13046-016-0372-5 [PubMed]
- 12. Li J, Zhuang C, Liu Y, Chen M, Zhou Q, Chen Z, He A, Zhao G, Guo Y, Wu H, Cai Z, Huang W. shRNA targeting long non-coding RNA CCAT2 controlled by tetracycline-inducible system inhibits progression of bladder cancer cells. Oncotarget. 2016; 7:28989–97. https://doi.org/10.18632/oncotarget.8259 [PubMed]
- 13. Zhuang C, Li J, Liu Y, Chen M, Yuan J, Fu X, Zhan Y, Liu L, Lin J, Zhou Q, Xu W, Zhao G, Cai Z, Huang W. Tetracycline-inducible shRNA targeting long non-coding RNA PVT1 inhibits cell growth and induces apoptosis in bladder cancer cells. Oncotarget. 2015; 6:41194–203. https://doi.org/10.18632/oncotarget.5880 [PubMed]
- 14. Chen M, Li J, Zhuang C, Cai Z. Increased lncRNA ABHD11-AS1 represses the Malignant phenotypes of bladder cancer. Oncotarget. 2017; 8:28176–86. https://doi.org/10.18632/oncotarget.14945 [PubMed]
- 15. Zhuang C, Huang X, Zhuang C, Luo X, Zhang X, Cai Z, Gui Y. Synthetic regulatory RNAs selectively suppress the progression of bladder cancer. J Exp Clin Cancer Res. 2017; 36:151. https://doi.org/10.1186/s13046-017-0626-x [PubMed]
- 16. Hao L, Pang K, Pang H, Zhang J, Zhang Z, He H, Zhou R, Shi Z, Han C. Knockdown of P3H4 inhibits proliferation and invasion of bladder cancer. Aging (Albany NY). 2020; 12:2156–68. https://doi.org/10.18632/aging.102732 [PubMed]
- 17. Wang B, Zhang Y, Zhang H, Lin F, Tan Q, Qin Q, Bao W, Liu Y, Xie J, Zeng Q. Long intergenic non-protein coding RNA 324 prevents breast cancer progression by modulating miR-10b-5p. Aging (Albany NY). 2020; 12:6680–99. https://doi.org/10.18632/aging.103021 [PubMed]
- 18. Liu Y, Feng J, Sun M, Yang G, Yuan H, Wang Y, Bu Y, Zhao M, Zhang S, Zhang X. Long non-coding RNA HULC activates HBV by modulating HBx/STAT3/miR-539/APOBEC3B signaling in HBV-related hepatocellular carcinoma. Cancer Lett. 2019; 454:158–70. https://doi.org/10.1016/j.canlet.2019.04.008 [PubMed]
- 19. Ma F, Liu X, Zhou S, Li W, Liu C, Chadwick M, Qian C. Long non-coding RNA FGF13-AS1 inhibits glycolysis and stemness properties of breast cancer cells through FGF13-AS1/IGF2BPs/Myc feedback loop. Cancer Lett. 2019; 450:63–75. https://doi.org/10.1016/j.canlet.2019.02.008 [PubMed]
- 20. Zhu K, Yuan Y, Wen J, Chen D, Zhu W, Ouyang Z, Wang W. LncRNA Sox2OT-V7 promotes doxorubicin-induced autophagy and chemoresistance in osteosarcoma via tumor-suppressive miR-142/miR-22. Aging (Albany NY). 2020; 12:6644–66. https://doi.org/10.18632/aging.103004 [PubMed]
- 21. Feng F, Wang J, Bao R, Li L, Tong X, Han S, Zhang H, Wen W, Xiao L, Zhang C. LncPrep + 96kb 2.2 kb inhibits estradiol secretion from granulosa cells by inducing EDF1 translocation. Front Cell Dev Biol. 2020; 8:481. https://doi.org/10.3389/fcell.2020.00481 [PubMed]
- 22. Wu Y, Zhang F, Lu R, Feng Y, Li X, Zhang S, Hou W, Tian J, Kong X, Sun L. Functional lncRNA-miRNA-mRNA networks in rabbit carotid atherosclerosis. Aging (Albany NY). 2020; 12:2798–813. https://doi.org/10.18632/aging.102778 [PubMed]
- 23. Zhang L, Wang Y, Zhang L, Xia X, Chao Y, He R, Han C, Zhao W. ZBTB7A, a miR-663a target gene, protects osteosarcoma from endoplasmic reticulum stress-induced apoptosis by suppressing LncRNA GAS5 expression. Cancer Lett. 2019; 448:105–16. https://doi.org/10.1016/j.canlet.2019.01.046 [PubMed]
- 24. Li W, Liu J, Zhao H. Identification of a nomogram based on long non-coding RNA to improve prognosis prediction of esophageal squamous cell carcinoma. Aging (Albany NY). 2020; 12:1512–26. https://doi.org/10.18632/aging.102697 [PubMed]
- 25. Liu J, Mayekar MK, Wu W, Yan M, Guan H, Wang J, Zaman A, Cui Y, Bivona TG, Choudhry H, Xing Q, Cao W. Long non-coding RNA ESCCAL-1 promotes esophageal squamous cell carcinoma by down regulating the negative regulator of APOBEC3G. Cancer Lett. 2020; 493:217–227. https://doi.org/10.1016/j.canlet.2020.09.001 [PubMed]
- 26. Luo Y, Chen JJ, Lv Q, Qin J, Huang YZ, Yu MH, Zhong M. Long non-coding RNA NEAT1 promotes colorectal cancer progression by competitively binding miR-34a with SIRT1 and enhancing the Wnt/β-catenin signaling pathway. Cancer Lett. 2019; 440:11–22. https://doi.org/10.1016/j.canlet.2018.10.002 [PubMed]
- 27. Wang C, Chen Y, Chen K, Zhang L. Long noncoding RNA LINC01134 promotes hepatocellular carcinoma metastasis via activating AKT1S1 and NF-κB signaling. Front Cell Dev Biol. 2020; 8:429. https://doi.org/10.3389/fcell.2020.00429 [PubMed]
- 28. Qi Y, Wu H, Mai C, Lin H, Shen J, Zhang X, Gao Y, Mao Y, Xie X. LncRNA-MIAT-mediated miR-214-3p silencing is responsible for IL-17 production and cardiac fibrosis in diabetic cardiomyopathy. Front Cell Dev Biol. 2020; 8:243. https://doi.org/10.3389/fcell.2020.00243 [PubMed]
- 29. Mercatelli N, Fortini D, Palombo R, Paronetto MP. Small molecule inhibition of ewing sarcoma cell growth via targeting the long non coding RNA HULC. Cancer Lett. 2020; 469:111–23. https://doi.org/10.1016/j.canlet.2019.10.026 [PubMed]
- 30. Ye Y, Guo J, Xiao P, Ning J, Zhang R, Liu P, Yu W, Xu L, Zhao Y, Yu J. Macrophages-induced long noncoding RNA H19 up-regulation triggers and activates the miR-193b/MAPK1 axis and promotes cell aggressiveness in hepatocellular carcinoma. Cancer Lett. 2020; 469:310–22. https://doi.org/10.1016/j.canlet.2019.11.001 [PubMed]
- 31. Xu Y, Wang H, Li F, Heindl LM, He X, Yu J, Yang J, Ge S, Ruan J, Jia R, Fan X. Long non-coding RNA LINC-PINT suppresses cell proliferation and migration of melanoma via recruiting EZH2. Front Cell Dev Biol. 2019; 7:350. https://doi.org/10.3389/fcell.2019.00350 [PubMed]
- 32. Zhao W, Qin P, Zhang D, Cui X, Gao J, Yu Z, Chai Y, Wang J, Li J. Long non-coding RNA PVT1 encapsulated in bone marrow mesenchymal stem cell-derived exosomes promotes osteosarcoma growth and metastasis by stabilizing ERG and sponging miR-183-5p. Aging (Albany NY). 2019; 11:9581–96. https://doi.org/10.18632/aging.102406 [PubMed]
- 33. Shen SN, Li K, Liu Y, Yang CL, He CY, Wang HR. Silencing lncRNAs PVT1 upregulates miR-145 and confers inhibitory effects on viability, invasion, and migration in EC. Mol Ther Nucleic Acids. 2020; 19:668–82. https://doi.org/10.1016/j.omtn.2019.11.030 [PubMed]
- 34. Wang F, Ji X, Wang J, Ma X, Yang Y, Zuo J, Cui J. LncRNA PVT1 enhances proliferation and cisplatin resistance via regulating miR-194-5p/HIF1a axis in oral squamous cell carcinoma. Onco Targets Ther. 2020; 13:243–52. https://doi.org/10.2147/OTT.S232405 [PubMed]
- 35. Wang Z, Zhang Q, Sun Y, Shao F. Long Non-Coding RNA PVT1 Regulates BAMBI To Promote Tumor Progression In Non-Small Cell Lung Cancer By Sponging miR-17-5p. Onco Targets Ther. 2020; 13:131–142. https://doi.org/10.2147/OTT.S217335 [PubMed]
- 36. Qiu C, Li S, Sun D, Yang S. lncRNA PVT1 accelerates progression of non-small cell lung cancer via targeting miRNA-526b/EZH2 regulatory loop. Oncol Lett. 2020; 19:1267–72. https://doi.org/10.3892/ol.2019.11237 [PubMed]
- 37. Niu J, Song X, Zhang X. Regulation of lncRNA PVT1 on miR-125 in metastasis of gastric cancer cells. Oncol Lett. 2020; 19:1261–66. https://doi.org/10.3892/ol.2019.11195 [PubMed]
- 38. Jiang B, Yang B, Wang Q, Zheng X, Guo Y, Lu W. lncRNA PVT1 promotes hepatitis B virus-positive liver cancer progression by disturbing histone methylation on the c-Myc promoter. Oncol Rep. 2020; 43:718–26. https://doi.org/10.3892/or.2019.7444 [PubMed]
- 39. Yu F, Dong B, Dong P, He Y, Zheng J, Xu P. Hypoxia induces the activation of hepatic stellate cells through the PVT1-miR-152-ATG14 signaling pathway. Mol Cell Biochem. 2020; 465:115–23. https://doi.org/10.1007/s11010-019-03672-y [PubMed]
- 40. Chen J, Yu Y, Li H, Hu Q, Chen X, He Y, Xue C, Ren F, Ren Z, Li J, Liu L, Duan Z, Cui G, Sun R. Long non-coding RNA PVT1 promotes tumor progression by regulating the miR-143/HK2 axis in gallbladder cancer. Mol Cancer. 2019; 18:33. https://doi.org/10.1186/s12943-019-0947-9 [PubMed]
- 41. Boloix A, Masanas M, Jiménez C, Antonelli R, Soriano A, Roma J, Sánchez de Toledo J, Gallego S, Segura MF. Long non-coding RNA PVT1 as a prognostic and therapeutic target in pediatric cancer. Front Oncol. 2019; 9:1173. https://doi.org/10.3389/fonc.2019.01173 [PubMed]
- 42. Xu Y, Li Y, Jin J, Han G, Sun C, Pizzi MP, Huo L, Scott A, Wang Y, Ma L, Lee JH, Bhutani MS, Weston B, et al. LncRNA PVT1 up-regulation is a poor prognosticator and serves as a therapeutic target in esophageal adenocarcinoma. Mol Cancer. 2019; 18:141. https://doi.org/10.1186/s12943-019-1064-5 [PubMed]
- 43. Luo Z, Cao P. Long noncoding RNA PVT1 promotes hepatoblastoma cell proliferation through activating STAT3. Cancer Manag Res. 2019; 11:8517–27. https://doi.org/10.2147/CMAR.S213707 [PubMed]
- 44. Ogunwobi OO, Kumar A. Chemoresistance mediated by ceRNA networks associated with the PVT1 locus. Front Oncol. 2019; 9:834. https://doi.org/10.3389/fonc.2019.00834 [PubMed]
- 45. Sun C, Wang P, Dong W, Liu H, Sun J, Zhao L. LncRNA PVT1 promotes exosome secretion through YKT6, RAB7, and VAMP3 in pancreatic cancer. Aging (Albany NY). 2020; 12:10427–40. https://doi.org/10.18632/aging.103268 [PubMed]
- 46. Wang Y, Chen W, Lian J, Zhang H, Yu B, Zhang M, Wei F, Wu J, Jiang J, Jia Y, Mo F, Zhang S, Liang X, et al. The lncRNA PVT1 regulates nasopharyngeal carcinoma cell proliferation via activating the KAT2A acetyltransferase and stabilizing HIF-1α. Cell Death Differ. 2020; 27:695–710. https://doi.org/10.1038/s41418-019-0381-y [PubMed]
- 47. Derderian C, Orunmuyi AT, Olapade-Olaopa EO, Ogunwobi OO. PVT1 signaling is a mediator of cancer progression. Front Oncol. 2019; 9:502. https://doi.org/10.3389/fonc.2019.00502 [PubMed]
- 48. Wang W, Zhou R, Wu Y, Liu Y, Su W, Xiong W, Zeng Z. PVT1 promotes cancer progression via MicroRNAs. Front Oncol. 2019; 9:609. https://doi.org/10.3389/fonc.2019.00609 [PubMed]
- 49. Zimta AA, Tomuleasa C, Sahnoune I, Calin GA, Berindan-Neagoe I. Long non-coding RNAs in myeloid Malignancies. Front Oncol. 2019; 9:1048. https://doi.org/10.3389/fonc.2019.01048 [PubMed]
- 50. Malagobadan S, Ho CS, Nagoor NH. MicroRNA-6744-5p promotes anoikis in breast cancer and directly targets NAT1 enzyme. Cancer Biol Med. 2020; 17:101–11. https://doi.org/10.20892/j.issn.2095-3941.2019.0010 [PubMed]
- 51. Fernando N, Wong JH, Das S, Dietrich C, Aggio-Bruce R, Cioanca AV, Wooff Y, Chu-Tan JA, Schumann U, Ngo C, Essex RW, Dorian C, Robertson SA, et al. MicroRNA-223 regulates retinal function and inflammation in the healthy and degenerating retina. Front Cell Dev Biol. 2020; 8:516. https://doi.org/10.3389/fcell.2020.00516 [PubMed]
- 52. Yang Z, Li J, Feng G, Wang Y, Yang G, Liu Y, Zhang S, Feng J, Zhang X. Hepatitis B virus X protein enhances hepatocarcinogenesis by depressing the targeting of NUSAP1 mRNA by miR- 18b. Cancer Biol Med. 2019; 16:276–87. https://doi.org/10.20892/j.issn.2095-3941.2018.0283 [PubMed]
- 53. Quiñonero F, Mesas C, Doello K, Cabeza L, Perazzoli G, Jimenez-Luna C, Rama AR, Melguizo C, Prados J. The challenge of drug resistance in pancreatic ductal adenocarcinoma: a current overview. Cancer Biol Med. 2019; 16:688–699. https://doi.org/10.20892/j.issn.2095-3941.2019.0252 [PubMed]
- 54. Mullany LE, Slattery ML. The functional role of miRNAs in colorectal cancer: insights from a large population-based study. Cancer Biol Med. 2019; 16:211–19. https://doi.org/10.20892/j.issn.2095-3941.2018.0514 [PubMed]
- 55. Liu H, Ren SY, Qu Y, et al. MiR-194-5p restrained metastasis and EMT of nephroblastoma cells through targeting Crk[J]. The Kaohsiung journal of medical sciences. 2019. https://doi.org/10.1002/kjm2.12180
- 56. Wang C, Chen Y, Wang Y, Liu X, Liu Y, Li Y, Chen H, Fan C, Wu D, Yang J. Inhibition of COX-2, mPGES-1 and CYP4A by isoliquiritigenin blocks the angiogenic Akt signaling in glioma through ceRNA effect of miR-194-5p and lncRNA NEAT1. J Exp Clin Cancer Res. 2019; 38:371. https://doi.org/10.1186/s13046-019-1361-2 [PubMed]
- 57. Wu S, Sun H, Wang Y, Yang X, Meng Q, Yang H, Zhu H, Tang W, Li X, Aschner M, Chen R. MALAT1 rs664589 polymorphism inhibits binding to miR-194-5p, contributing to colorectal cancer risk, growth, and metastasis. Cancer Res. 2019; 79:5432–41. https://doi.org/10.1158/0008-5472.CAN-19-0773 [PubMed]
- 58. Chen Z, Han Y, Deng C, Chen W, Jin L, Chen H, Wang K, Shen H, Qian L. Inflammation-dependent downregulation of miR-194-5p contributes to human intervertebral disc degeneration by targeting CUL4A and CUL4B. J Cell Physiol. 2019; 234:19977–89. https://doi.org/10.1002/jcp.28595 [PubMed]
- 59. Ye Y, Zhang F, Chen Q, Huang Z, Li M. LncRNA MALAT1 modified progression of clear cell kidney carcinoma (KIRC) by regulation of miR-194-5p/ACVR2B signaling. Mol Carcinog. 2019; 58:279–92. https://doi.org/10.1002/mc.22926 [PubMed]
- 60. Mou SJ, Yang PF, Liu YP, Xu N, Jiang WW, Yue WJ. BCLAF1 promotes cell proliferation, invasion and drug-resistance though targeting lncRNA NEAT1 in hepatocellular carcinoma. Life Sci. 2020; 242:117177. https://doi.org/10.1016/j.lfs.2019.117177 [PubMed]
- 61. Dell’Aversana C, Giorgio C, D’Amato L, Lania G, Matarese F, Saeed S, Di Costanzo A, Belsito Petrizzi V, Ingenito C, Martens JH, Pallavicini I, Minucci S, Carissimo A, et al. miR-194-5p/BCLAF1 deregulation in AML tumorigenesis. Leukemia. 2017; 31:2315–2325. https://doi.org/10.1038/leu.2017.64 [PubMed]